

Abstract
Objective:
Approximately 70 patients with large and bulky tumors refractory to prior treatments were treated with photon spatially fractionated GRID radiation (SFGRT). We identified 10 additional patients who clinically needed GRID but could not be treated with photons due to adjacent critical organs. We developed a proton SFGRT technique, and we report treatment of these 10 patients.
Methods:
Subject data were reviewed for clinical results and dosimetric data. 50% of the patients were metastatic at the time of treatment and five had previous photon radiation to the local site but not via GRID. They were treated with 15–20 cobalt Gray equivalent using a single proton GRID field with an average beamlet count of 22.6 (range 7–51). 80% received an average adjuvant radiation dose to the GRID region of 40.8Gy (range 13.7–63.8Gy). Four received subsequent systemic therapy.
Results:
The median follow-up time was 5.9 months (1.1–18.9). At last follow-up, seven patients were alive and three had died. Two patients who had died from metastatic disease had local shrinkage of tumor. Of those alive, four had complete or partial response, two had partial response but later progressed, and one had no response. For all patients, the tumor regression/local symptom improvement rate was 80%. 50% had acute side-effects of grade1/2 only and all were well-tolerated.
Conclusion:
In circumstances where patients cannot receive photon GRID, proton SFGRT is clinically feasible and effective, with a similar side-effect profile.
Advances in knowledge:
Proton GRID should be considered as a treatment option earlier in the disease course for patients who cannot be treated by photon GRID.
Introduction
Spatially fractionated GRID radiation therapy (SFGRT) is used to treat large and bulky tumors as previously described.1,2 Conventional treatment uses a cerrobend or brass block for photon beam collimation with the dose prescribed as a single en face field to a maximum dose point (DMax) or a control point deeper within the tumor using the treatment planning software program. In order to increase dose to the tumor, a number of newer techniques have been described and clinically implemented including non-coplanar MLC fields and parallel opposed GRID.3,4 However, despite these options, there are number of patients who are not amenable to conventional photon-based GRID radiation treatment given the beam entry and exit angles as well as due to critical structures that would receive a prohibitively high dose of radiation. The advantages of proton radiation for GRID is that it allows a rapid dose fall-off after the Bragg peak and thereby spare critical organs beyond the target volume. Pencil beam scanning (PBS) in particular allows for beams as narrow as a few millimeters in width and the precise placement of the Bragg peak as spots of dose. Previous work has developed, described and shown the feasibility of a technique using protons to deliver a single field of spatially fractionated GRID radiation therapy.5 We now report on the clinical results of the first 10 patients ever to have been treated with proton GRID radiation.
Methods and materials
10 patients were treated with proton GRID from November 2016 to February 2018 for palliation of symptomatic large tumors. These tumors could not be treated with photons because the entrance or exit of the standard GRID beam would directly traverse critical organs in a dose prohibitive manner. Their medical charts were retrospectively reviewed per the approved institutional review board. Patients that were treated in this study are part of an IRB approved protocol PCG (Proton Collaborative Group) Registry Study for Proton Therapy Outcomes, NCT01255748.
Patient characteristics reviewed from the chart include age, gender, histology of tumor, anatomical site treated, stage, prior treatment, additional treatment after GRID, clinical symptoms before and after treatment (RTOG/EORTC toxicity scale), and the radiographic response based on CT and/or MRI using RECIST 1.1 criteria for the GRID targeted lesion (http://recist.eortc.org/recist-1-1-2/). Medical charts were reviewed for clinical impressions regarding symptom relief. A self-reported patient pain scale of 1 (no pain) to 10 (severe pain) and manual muscle testing grading system recorded by the physician were used.
Patients were planned using PBS where radiation was delivered to focal spots within the tumor volume. Each spot corresponded to a single Bragg peak and the location and intensity of each spot was determined through inverse planning in order to give the optimal dose distribution to the target while sparing normal tissues. The proton plans were created using a RayStation treatment planning system (RaySearch Labs, Sweden). The treatment fields were delivered in PBS mode using IBA proton delivery system (IBA, Belgium) equipped with a universal nozzle. Single-field, multilayer PBS was delivered with spot patterns aligned across the layers. Given an estimated relative biological effectiveness (RBE) of 1.1 for proton particle therapy compared to protons, the dose was reported as Cobalt Gray Equivalent (CGE), simply abbreviated here as Gy. The proton GRID technique has been previously described.5 The treatment planning system was reviewed for tumor volumes, critical organs of avoidance (OAR), proton beamlet count, and proton dose to the tumor and nearby structures. 41 different OARs were identified and contoured across the 10 patients. The maximum dose to the OAR was described as D1 (dose to 1% vol of the OAR) and the minimum dose as D99 (dose that covered 99% of the OAR volume). Each proton beamlet refers to a high-dose peak in the GRID field that traversed the gross tumor volume (GTV). The beamlet path-length was measured as the length of the 70% isodose line, with the planning objective of placing the 90–95% isodose across the GTV.
Results
Patient and treatment characteristics are summarized in chronological order of proton GRID treatment in Table 1. Nine males and one female had an average age of 58 years (range 22–88 years). 5 out of 10 patients had sarcoma (Table 1). 50% had widespread metastatic disease at the time of GRID treatment. Five patients had prior photon radiation treatment of dose 19.8 Gy (Patient #1), 50 Gy (#3), 44 Gy (#4), 86.4 Gy over 3 courses of 36 Gy, 36 Gy, and 14.4 Gy (#6), and 64 Gy (#10) to the local site now receiving proton GRID. The prior radiation for these five patients did not utilize any GRID to that site. All patients except two (patients #5 and #8 who had refused) had been administered chemotherapy, biologic, or immunotherapy without response prior to trying GRID treatment. Systemic therapy consisted of pazopanib/pembrolizumab (#1), GPX-150 anthracycline analog (#2), pembrolizumab/traztuzumab (#3), pazopanib (#4 and #7), heat shock protein peptide complex 16 vaccine trial (#6), cisplatinum/doxorubicin/methotrexate (#9), and pembrolizumab (#10).
Table 1.
Patient and treatment characteristics
| Patient | Histology | GRID Site | Critical organ(s) of avoidance | Tumor size (cm3) | GRID dose (CGE) | Alleviated symptom(s) | Status | FU (mo) |
|---|---|---|---|---|---|---|---|---|
| 1 | Osteosarcoma | Pharynx / Base of skull | Brain, spinal cord | 254 | 15 | Progressed, bleeding | Dead, PD | 1.1 |
| 2 | Liposarcoma | Retroperitoneum | Kidney, liver, stomach, bowel | 944 | 15 | Pain | Alive, PR | 18.6 |
| 3 | Endometrial clear cell carcinoma | Retroperitoneum | Kidney, liver, stomach, bowel | 624 | 15 | Hydronephrosis | Alive, PR | 16.5 |
| 4 | Pleomorphic sarcoma | Supraclavicular neck | Brachial plexus, lung | 130 | 18 | Pain, ROM | Dead, PR ( | 4.2 |
| 5 | Chordoma | Sacrum | Spinal cord | 561 | 15 | Pain | Alive, PR | 2.3 |
| 6 | Anaplastic ependymoma | Paraspinal | Spinal cord, kidney | 2,109 | 18 | Pain, ROM | Dead, PR | 4.0 |
| 7 | Chondrosarcoma | Upper thigh | Soft tissues, bladder, rectum | 579 | 20 | Stable | Alive, SD | 7.3 |
| 8 | Myoepithelial carcinoma | Cervical Neck | Spinal cord, salivary glands, pharynx | 390 | 18 | Pain, ROM | Alive, PR but PD | 7.4 |
| 9 | Osteosarcoma | Maxillary sinus | Brain, salivary glands, pharynx | 348 | 18 | Bleeding, pain | Alive, PR but PD | 7.0 |
| 10 | Non-small cell lung carcinoma | Supraclavicular neck | Brachial plexus, lung | 551 | 20 | Pain | Alive, CR | 4.8 |
CR, complete response; FU, time in months to last follow-up or death;PD, progressive disease; PR, partial response; ROM, range of motion; SD, stable disease.
All 10 patients were treated with 15–20 cobalt Gray (Gy) using a single proton GRID field with an average beamlet count of 22.6 (range 7–51). 80% received additional radiation treatment adjuvantly to the GRID treatment to an average dose of 40.8 Gy (range 13.7–63.8 Gy). Four patients also received subsequent systemic therapy, consisting of doxorubicin (#3), trabectedin (#4), “self-derived dendritic cell vaccine“ (#8), and pembrolizumab (#10).
The median time from GRID treatment to last follow-up was 5.9 months (range 1.1–18.9 months). At last follow-up, seven were alive and three had died (Figure 1). The median time to death was 4 months, and the median survival (at last follow up) in the living was 7.3 months. The presenting symptoms of complaint included pain in 60%, decreased range of motion in 30%, bleeding in 20%, and hydronephrosis in 10%.
Figure 1.
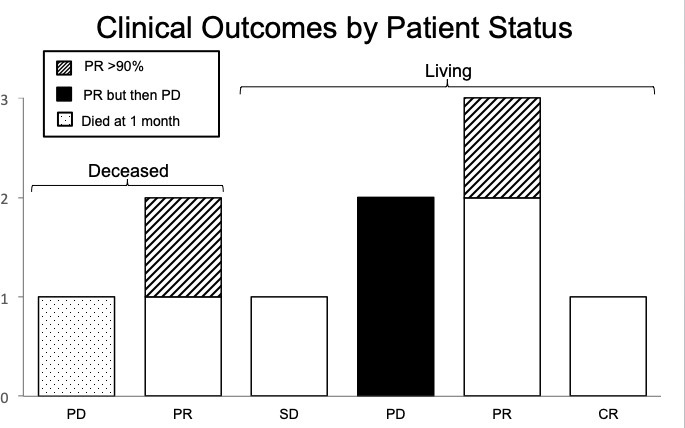
Clinical outcomes by patient status. CR, complete response; PD, progressive disease; PR,partial response; SD, stable disease.
Radiographic response:
Our very first patient was unable to complete radiation treatment and died nearly 1 month after GRID and incomplete adjuvant radiation due to local progressive disease (PD). Two patients who died had local shrinkage, with one (#6) of them being a partial response (PR) at 2 months after GRID and the other (#4) with substantial PR of >90% shrinkage at one month. This latter patient (#4) had been treated by photon GRID five times over 3 years to other sites with complete response (CR of 100% shrinkage) or substantial PR of 90–99% shrinkage each time. The two patients who died despite local response succumbed to pulmonary metastasis.
Of the seven patients who are alive, one had a complete response (CR) at the treated site at 5 months (#10) and one had substantial PR (of >90% shrinkage) at 3 months (#3). Two had significant partial and lasting response (#2, #5) by 2 months. Two (#8, #9) had a PR at 3 and 1 month but ultimately progressed at 8 and 2 months, respectively, and were scored as PD. One had stable disease (SD) with no response by 7 months (#7). These results are summarized in Figure 1.
Clinical response
Including the one patient with a follow-up of 1 month who progressed with bleeding and pain, the tumor clinical symptom improvement rate at the local GRID site for all patients was 8/10 (80%). Pain was alleviated in 7/8 (88%) patients who had presented with this symptom. Hydronephrosis was alleviated in one patient. Increased range of motion was achieved in 3 out of 3 patients (100%). Only one patient with chondrosarcoma “with osteoid features” of the upper thigh (#7) showed no response clinically as well as radiographically.
50% of patients experienced Grade 1 or 2 complications in the form of dry desquamation, erythema, patchy pseudomembranous mucosal reaction, and mild skin hyperpigmentation in the GRID spot pattern. None of the patients experienced Grade 3 or greater complications. Skin reactions included patients who received adjuvant radiation. The clinical effects of the last patient we treated (#10) can be seen in Figure 2.
Figure 2.
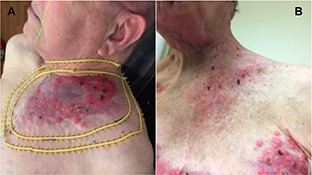
Complete Response seen in Patient #10. (A) disease prior to treatment, (B) after proton GRID.
Proton dosimetry
The range of energies used for protons was 98.6–188.6 MeV. The spot count for protons was an average of 302 spots (ranged from 89 to 664) that were arranged in an average of 25 layers (range 19–33). A beamlet was defined as the proton beam-dose that would “pass through” the “open hole” of a conventional photon block. There was an average of 23 and a median of 19 beamlets used (range of 7–51). Each beamlet was measured as a proximal to distal path-length of the 70% isodose line in centimeters (cm). The shortest beamlet path-length per patient was 0.1 cm (at the skin surface) to 7.9 cm with an average of 2.6 cm. The longest beamlet path-length per patient ranged from 7.5 to 22.7cm with an average of 12.7 cm.
The proton dose prescribed was 15–20.03 Gy, with an average of 17.2 Gy. The actual maximum dose in the GTV closely matched the prescription GRID dose, with a minimum of 15.2 Gy, maximum of 21 Gy, and an average of 17.6 Gy. The D1 of the GTV (1 cc of GTV receiving the GRID dose) was a minimum of 14.6 Gy, maximum of 19.4 Gy, and an average of 16.5 Gy. The volume of the beamlets that were covered by the 90% isodose line were calculated as a contour (in cm3), as was the volume covered by 95% of the dose. The percentage of the 90% isodose line volume covered by the 95% dose ranged from 35.3 to 79.3%, with an average of 54.1%. The 90% isodose volume contour represented 2.7–41.7 cm3 of the GTV volumes, with an average of 18.4 cm3. The entire GTV volumes for the 10 patients ranged from 130.5 to 2109 cm3, with an average volume of 649.1 cm3. The percentage of the GTV covered with the high dose GRID (95% isodose line) was therefore an average of 3%, with a range of 2–3.6%. Representative axial proton GRID plans for the 10 patients showing the GTV and the chosen beam angles can be seen in Figure 3.
Figure 3.

Patient treatment plans. Axial treatment plans of contoured GTV and the dose distribution.
The critical organs of avoidance (OAR) for each patient in the proton dosimetry are seen in Table 2. Comparison plans to photon GRID were not done because the photon GRID plan was meaningless; no photon GRID plan could clinically be used because it could not cover the GTV meaningfully (i.e. with >30% of the GTV covered by the open beam) without beams passing directly through the OARS in a dose prohibitive manner. The D1 (dose received by 1% of the organ) and D99 (dose received by 99% of the organ) were recorded to represent the maximum and minimum dose to the organs. 87 doses OARs were recorded for all ten patients. The D1 was 0 Gy for 31% of the structures, and it was <0.1 Gy for 48% of the structures. For the structures that received some dose, 30 (34%) structures had a dose between 0.1–5 Gy and 7 (8%) were between 5 and 10 Gy. A maximum dose D1 >10 Gy was seen in eight structures (9.2%), with a range of 11.7 Gy in liver to 18.9 Gy to the soft tissues of the posterior thigh. Many of these higher doses occurred in patients where part of the OAR was involved by the GTV.
Table 2.
Proton dosimetry to OARs for each of 10 patients
| Patient Number | |||||||||||||||
|---|---|---|---|---|---|---|---|---|---|---|---|---|---|---|---|
| 1 | 2 | 3 | 4 | 5 | |||||||||||
| Critical Structures of Avoidance | D1 | D99 | D(ave) | D1 | D99 | D(ave) | D1 | D99 | D(ave) | D1 | D99 | D(ave) | D1 | D99 | D(ave) |
| Bladder | – | – | – | – | – | – | – | – | – | – | – | – | 0 | 0 | 0 |
| Bowel | – | – | – | 1,222 | 0 | 169 | 218 | 0 | 8 | – | – | – | 30 | 0 | 2 |
| Brachial plexus | – | – | – | – | – | – | – | – | – | 15 | 0 | 1 | – | – | – |
| Brain | 258 | 0 | 8 | – | – | – | – | – | – | – | – | – | – | – | – |
| Brainstem | 0 | 0 | 0 | – | – | – | – | – | – | – | – | – | – | – | – |
| Carina | – | – | – | – | – | – | – | – | – | – | – | – | – | – | – |
| Cauda equina | – | – | – | – | – | – | – | – | – | – | – | – | 911 | 0 | 33 |
| Cervical spinal cord | – | – | – | – | – | – | – | – | – | – | – | – | – | – | – |
| Cochlea, left | 0 | 0 | 0 | – | – | – | – | – | – | – | – | – | – | – | – |
| Cochlea, right | 0 | 0 | 0 | – | – | – | – | – | – | – | – | – | – | – | – |
| Dental fillings | – | – | – | – | – | – | – | – | – | – | – | – | – | – | – |
| Duodenum | – | – | – | – | – | – | – | – | – | – | – | – | – | – | – |
| Esophagus | – | – | – | 1,420 | 0 | 374 | – | – | – | – | – | – | – | – | – |
| Esophagus, cervical | – | – | – | – | – | – | – | – | – | – | – | – | – | – | – |
| Eye, left | 722 | 14 | 156 | – | – | – | – | – | – | – | – | – | – | – | – |
| Eye, right | – | – | – | – | – | – | – | – | – | – | – | – | – | – | – |
| Glottic larynx | – | – | – | – | – | – | – | – | – | – | – | – | – | – | – |
| Heart | – | – | – | – | – | – | – | – | – | – | – | – | – | – | – |
| Kidney, left | – | – | – | 1 | 0 | 0 | 824 | 0 | 77 | – | – | – | 0 | 0 | 0 |
| Kidney, right | – | – | – | 1,293 | 0 | 272 | 0 | 0 | 0 | – | – | – | 0 | 0 | 0 |
| Lacrimal gland, left | – | – | – | – | – | – | – | – | – | – | – | – | – | – | – |
| Lacrimal gland, right | – | – | – | – | – | – | – | – | – | – | – | – | – | – | – |
| Larynx | 0 | 0 | 0 | – | – | – | – | – | – | – | – | – | – | – | – |
| Liver | – | – | – | 1,171 | 0 | 105 | 0 | 0 | 0 | – | – | – | – | – | – |
| Lung, left | – | – | – | 449 | 0 | 12 | – | – | – | – | – | – | – | – | – |
| Lung, right | – | – | – | 1,255 | 0 | 160 | – | – | – | – | – | – | – | – | – |
| Muscles of posterior thigh | – | – | – | – | – | – | – | – | – | – | – | – | – | – | – |
| Optic chiasm | – | – | – | – | – | – | – | – | – | – | – | – | – | – | – |
| Optic nerve, left | – | – | – | – | – | – | – | – | – | – | – | – | – | – | – |
| Optic nerve, right | – | – | – | – | – | – | – | – | – | – | – | – | – | – | – |
| Oral cavity | – | – | – | – | – | – | – | – | – | – | – | – | – | – | – |
| Parotid, left | 0 | 0 | 0 | – | – | – | – | – | – | – | – | – | – | – | – |
| Parotid, right | 52 | 0 | 3 | – | – | – | – | – | – | – | – | – | – | – | – |
| Prosthetic hip: metal cup | – | – | – | – | – | – | – | – | – | – | – | – | – | – | – |
| Prosthetic hip: metal rod | – | – | – | – | – | – | – | – | – | – | – | – | – | – | – |
| Rectum | – | – | – | – | – | – | 1 | 0 | 1 | – | – | – | 852 | 0 | 116 |
| Spinal cord | – | – | – | 46 | 0 | 7 | 0 | 0 | 0 | 25 | 0 | 4 | – | – | – |
| Spleen | – | – | – | 7 | 0 | 0 | 91 | 0 | 3 | – | – | – | – | – | – |
| Stomach | – | – | – | 405 | 0 | 18 | 0 | 0 | 0 | – | – | – | – | – | – |
| Subclavian vessels | – | – | – | – | – | – | – | – | – | – | – | – | – | – | – |
| Thyroid | – | – | – | – | – | – | – | – | – | – | – | – | – | – | – |
| Patient Number | |||||||||||||||
|---|---|---|---|---|---|---|---|---|---|---|---|---|---|---|---|
| 6 | 7 | 8 | 9 | 10 | |||||||||||
| Critical Structures of Avoidance | D1 | D99 | D(ave) | D1 | D99 | D(ave) | D1 | D99 | D(ave) | D1 | D99 | D(ave) | D1 | D99 | D(ave) |
| Bladder | – | – | – | 3 | 0 | 0 | – | – | – | – | – | – | – | – | – |
| Bowel | 7 | 0 | 0 | – | – | – | – | – | – | – | – | – | – | – | – |
| Brachial plexus | – | – | – | – | – | – | 204 | 0 | 37 | – | – | – | 235 | 0 | 68 |
| Brain | – | – | – | – | – | – | 0 | 0 | 0 | 26 | 0 | 2 | – | – | – |
| Brainstem | – | – | – | – | – | – | 0 | 0 | 0 | 1 | 0 | 0 | – | – | – |
| Carina | – | – | – | – | – | – | – | – | – | – | – | – | 3 | 0 | 0 |
| Cauda equina | – | – | – | – | – | – | – | – | – | – | – | – | – | – | – |
| Cervical spinal cord | – | – | – | – | – | – | 0 | 0 | 0 | 0 | 0 | 0 | – | – | – |
| Cochlea, left | – | – | – | – | – | – | 0 | 0 | 0 | 8 | 2 | 5 | 0 | 0 | 0 |
| Cochlea, right | – | – | – | – | – | – | 0 | 0 | 0 | 0 | 0 | 0 | 0 | 0 | 0 |
| Dental fillings | – | – | – | – | – | – | 6 | 0 | 2 | 287 | 0 | 24 | – | – | – |
| Duodenum | 0 | 0 | 0 | – | – | – | – | – | – | – | – | – | – | – | – |
| Esophagus | – | – | – | – | – | – | – | – | – | – | – | – | – | – | – |
| Esophagus, cervical | – | – | – | – | – | – | 126 | 0 | 16 | – | – | – | 77 | 0 | 4 |
| Eye, left | – | – | – | – | – | – | – | – | – | 251 | 7 | 35 | – | – | – |
| Eye, right | – | – | – | – | – | – | – | – | – | 9 | 0 | 2 | – | – | – |
| Glottic larynx | – | – | – | – | – | – | 809 | 0 | 144 | – | – | – | – | – | – |
| Heart | 1 | 0 | 0 | – | – | – | – | – | – | – | – | – | – | – | – |
| Kidney, left | 54 | 0 | 3 | – | – | – | – | – | – | – | – | – | – | – | – |
| Kidney, right | 63 | 0 | 7 | – | – | – | – | – | – | – | – | – | – | – | – |
| Lacrimal gland, left | – | – | – | – | – | – | – | – | – | 225 | 24 | 72 | – | – | – |
| Lacrimal gland, right | – | – | – | – | – | – | – | – | – | 1 | 0 | 0 | – | – | – |
| Larynx | – | – | – | – | – | – | – | – | – | – | – | – | – | – | – |
| Liver | 24 | 0 | 1 | – | – | – | – | – | – | – | – | – | – | – | – |
| Lung, left | 6 | 0 | 0 | – | – | – | – | – | – | – | – | – | 245 | 0 | 12 |
| Lung, right | 13 | 0 | 1 | – | – | – | – | – | – | – | – | – | 3 | 0 | 0 |
| Muscles of posterior thigh | – | – | – | 1,894 | 0 | 447 | – | – | – | – | – | – | – | – | – |
| Optic chiasm | – | – | – | – | – | – | – | – | – | 267 | 0 | 57 | – | – | – |
| Optic nerve, left | – | – | – | – | – | – | – | – | – | 568 | 18 | 201 | – | – | – |
| Optic nerve, right | – | – | – | – | – | – | – | – | – | 62 | 0 | 9 | – | – | – |
| Oral cavity | – | – | – | – | – | – | 21 | 0 | 3 | – | – | – | – | – | – |
| Parotid, left | – | – | – | – | – | – | 0 | 0 | 0 | 1,542 | 4 | 319 | 32 | 0 | 4 |
| Parotid, right | – | – | – | – | – | – | 517 | 4 | 53 | 0 | 0 | 0 | 0 | 0 | 0 |
| Prosthetic hip: metal cup | – | – | – | 22 | 0 | 2 | – | – | – | – | – | – | – | – | – |
| Prosthetic hip: metal rod | – | – | – | 345 | 0 | 13 | – | – | – | – | – | – | – | – | – |
| Rectum | – | – | – | 3 | 0 | 1 | – | – | – | – | – | – | – | – | – |
| Spinal cord | – | – | 0 | – | – | – | – | – | – | – | – | – | 0 | 0 | 0 |
| Spleen | – | – | – | – | – | – | – | – | – | – | – | – | – | – | – |
| Stomach | 0 | 0 | 0 | – | – | – | – | – | – | – | – | – | – | – | – |
| Subclavian vessels | – | – | – | – | – | – | – | – | – | – | – | – | 109 | 0 | 18 |
| Thyroid | – | – | – | – | – | – | – | – | – | – | – | – | 1,292 | 2 | 190 |
All doses in cGy. D1 = dose to 1% vol of OAR; D99 = dose to 99% vol of OAR; D(ave)=average dose to OAR.
The D99 was 0 Gy for all the OARs except eight structures (9%), with the highest doses being 0.24 Gy in a lacrimal gland and 0.18 Gy in an optic nerve. The higher D99 was due to the OAR’s overall small size. The other six structures recorded negligible dose. The D average (Dave) was also calculated for each OAR and can be seen in Table 2. For OARs with a high D1, the D99 and Dave were low.
Discussion
We were able to treat 10 patients with proton GRID who cannot be conventionally treated with conventional photon GRID techniques. Including the first patient who had 1 month follow-up, the clinical improvement and/or radiographic regression was 80% for the patients, with only 50% of them experiencing any tolerable, Grade1/2 acute reactions. 8 of 10 patients (80%) experienced local tumor shrinkage to the proton GRID, with 1 CR, two of the PRs being >90% tumor shrinkage from baseline and two that were transient (responded but then progressed). These clinical results are similar to photon GRID experiences.1,2
An obvious benefit of proton radiation treatment is that there is no exit dose with particle therapy due to the Bragg peak which allows sparing of deep tissues (Figure 3). This was particularly useful when treating the head and neck area to avoid the brachial plexus or trachea with an anterior oblique field, or when trying to avoid brain when treating near the base of skull with an en face field. In the abdomen, we were able to avoid kidney, large and small bowel and spinal cord. We could not treat this way with photons because each photon beamlet would ordinarily exit into a critical structure. With photon GRID, we are more limited in our beam angles, and if targeting a GTV but forced to be tangential to a critical OAR, we often have to settle for less beamlets and less coverage of the GTV, potentially leading to diminished clinical response.
Proton GRID radiation treatment also allows us to decrease the entrance dose and spare proximal tissues. This allowed us to treat through a kidney (#2) in order to treat a paraspinal mass (while also avoiding the distal bowel). Because photon radiation treatment with a single field tends to treat to a maximum dose (DMax), most of the high dose deposition is within a few centimeters of the entrance surface and any critical structures that are proximal to the GTV usually receive a prohibitive dose. With conventional photon GRID, these beam angles have to be avoided completely, limiting coverage of the GTV. The proximal dose from proton GRID can be decreased to 60–70% of the prescribed dose, increasing our dosimetric planning options and GTV coverage. In our case, we were able to partially cover the kidney near the tumor, but spare most of it. If using parallel opposed proton GRID (not done here), then the proximal field edges can be reduced yet more by half.
Another advantage of protons is a more uniform beam dose in the GTV since the distal and proximal edges of the dose fall off can be precisely prescribed. Conventional single field photon radiation treatment prescribes to DMax, so if prescribing 20 Gray, then the dose that actually traverses the GTV deeper in the body may be closer to 60–70% of the prescription dose (12–14 Gy). The DMax may be a small area only in photons. In our patients, we measured “consistency” by noting that the 90% isodose line contour covered by 95% of the dose was not just a point dose but ranged from 35.3 to 79.33%, with an average of 54.1% coverage. This range depended on the width of the tumor, with larger tumors having a larger and more consistent beamlet path-length. Thus ironically, the larger the tumor, the better the proton GTV coverage remained, which is the opposite effect for photons using a single enface field. Photon GRID would need to use parallel opposed fields to achieve the same, more consistent dose effect, which means the entrance and exit of both fields has to be considered in relations to the OARs. Protons allows for a consistent dose as prescribed to span the entire GTV, and therefore allows for dose escalation.
In this study, we mimicked the brass collimation block (.dot Decimal Inc., Florida) that corresponds to the spot pattern that clinically has been the most used and described in the literature.2 We used this GRID pattern because it has demonstrated longtime clinical efficacy in our experience. However, with protons, we can vary the GRID size and distance of spacing without a physical block by simply varying the energy. We can vary PBS spot separation also which would give different valley:peak sizes. Thus, proton-based GRID radiation treatment can encourage further research in trying to determine the optimal shapes of various GRID blocks more easily.
While this study is very encouraging and shows results similar to photon GRID treatment, there are a few caveats. First, the follow-up is short-term with an average of 6 months. This seems to reflect the type of patients who were sent to us with end-stage disease. Even compared to conventional photon GRID, these proton patients were referred later than usual because conventional GRID was not thought to be an option by the referring physicians. For example, the very first patient (#1) had been treated with radiation to the orbits as a young child for retinoblastoma in 1988 and had received prior radiation in 2005 to the same region for recurrence of his radiation induced secondary malignancy. Unfortunately, the patient was referred to us too late in his disease course because re-irradiation was not thought to be possible. While we were technically able to deliver the GRID treatment as proof of concept, his moribund state did not allow for adequate adjuvant radiation, follow-up and life expectancy. Demonstrating technical feasibility however allowed for more patients to be referred for proton GRID treatment.
It is also hard to demonstrate radiographic response in very large tumors at times. 5 of the 10 tumors were sarcomas. The goal of pre-operative radiation treatment for sarcomas is to induce a pathological response of greater than 90% necrosis at the time of surgical resection. Sarcomas respond to radiation but often take a long time to clinically regress as the body resorbs the non-viable tissue. During and shortly after treatment, they may even experience “pseudoprogression” where the tumor swells from radiation-induced inflammation before regressing later on. We therefore felt it was impressive to achieve rapid responses in three of five sarcoma patients with such short follow-up. The two patients (#1, #9) who progressed were osteosarcomas. The one patient who is alive but did not respond clinically (SD) in the thigh had chondrosarcoma “with osteoid features” (#7) and may ultimately show regression without surgery with longer follow-up as it can take months for enough dead tumor cell loss factor to allow us to see clinical regression.
For future studies, protons may allow us to see if there is value in dose-escalation with GRID. As mentioned, this is due to a more consistent high-dose region prescribed in the tumor, as well as the ability to prescribe a higher dose itself. The local bystander effect may be a threshold phenomenon, where radiation above a 12–15 Gy threshold enables different effects on tissues as compared to lower doses.6 There may be different effects at higher dose thresholds for the various interstitial tissues making up the tumor microenvironment that can be exploited. Proton dose-escalation studies may help us see if higher dose is more or less effective than conventional photon treatment.
One problem when comparing protons to photons is the RBE of particle therapy. For protons, a common ratio is 1.1 but there is some controversy since the RBE of ions can vary across the spread out Bragg Peak (SOBP) from 1.1 at the SOBP entrance, to 1.35 at the distal edge, and 1.7 in the distal falloff.7–9 RBE may be >1.1 in the distal part of the proton range, for lower doses, and for low alpha-beta tissues. A constant RBE of 1.1 (midpoint of SOBP) may therefore underestimate long-term side-effects. While years of clinical experience shows that there are no obvious clinical differences of photons vs protons at typical doses and fractionation schemes, this is not known at much higher doses. Our case series treats patients with proton doses of 15–20 Gy, which is much higher than typically used with protons. Future studies looking at dose-escalation may have to take a variable RBE into effect, though our short-term clinical report does not suggest any untoward side-effects.
Conclusions
We report on the first clinical series of patients who have been treated with proton SFGRT. We have shown that the proton GRID treatment is clinically feasible and is as effective as photon GRID with a similar side-effect profile. We believe that proton GRID should be considered as a treatment option earlier in the disease course for patients who cannot receive photon GRID radiation.
Contributor Information
Majid Mohiuddin, Email: majid.mohiuddin.md@gmail.com.
Connor Lynch, Email: connor.m.lynch@gmail.com.
Mingcheng Gao, Email: Mingcheng.Gao@nm.org.
William Hartsell, Email: whartsell@chicagocancer.org.
REFERENCES
- 1.Mohiuddin M, Curtis DL, Grizos WT, Komarnicky L. Palliative treatment of advanced cancer using multiple nonconfluent pencil beam radiation: a pilot study. Cancer 1990; 66: 114–8. doi: [DOI] [PubMed] [Google Scholar]
- 2.Mohiuddin M, Fujita M, Regine WF, Megooni AS, Ibbott GS, Ahmed MM, et al. Grid): a new paradigm in the management of advanced cancers. Int J Radiat Oncol Biol Phys 1999; 45: 721–7. [DOI] [PubMed] [Google Scholar]
- 3.Neuner G, Mohiuddin MM, Vander Walde N, Goloubeva O, Ha J, Yu CX, et al. High-Dose spatially fractionated grid radiation therapy (SFGRT): a comparison of treatment outcomes with Cerrobend vs. MLC SFGRT. Int J Radiat Oncol Biol Phys 2012; 82: 1642–9. doi: 10.1016/j.ijrobp.2011.01.065 [DOI] [PubMed] [Google Scholar]
- 4.Mohiuddin M, Park H, Hallmeyer S, Richards J. High-Dose radiation as a dramatic, immunological primer in locally advanced melanoma. Cureus 2015; 7: e417: e417. doi: 10.7759/cureus.417 [DOI] [PMC free article] [PubMed] [Google Scholar]
- 5.Gao M, Mohiuddin MM, Hartsell WF, Pankuch M. Spatially fractionated (grid) radiation therapy using proton pencil beam scanning (PBS): feasibility study and clinical implementation. Med Phys 2018; 45: 1645–53. doi: 10.1002/mp.12807 [DOI] [PubMed] [Google Scholar]
- 6.Garcia-Barros M, et al. Tumor response to radiotherapy regulated by endothelial cell apoptosis. Science 2003; 300: 1155–9. doi: 10.1126/science.1082504 [DOI] [PubMed] [Google Scholar]
- 7.Ilicic K, Combs SE, Schmid TE. New insights in the relative radiobiological effectiveness of proton irradiation. Radiat Oncol 2018; 13: 6,018–954. doi: 10.1186/s13014-018-0954-9 [DOI] [PMC free article] [PubMed] [Google Scholar]
- 8.Ödén J, DeLuca PM, Orton CG. The use of a constant RBE=1.1 for proton radiotherapy is no longer appropriate. Med Phys 2018; 45: 502–5. doi: 10.1002/mp.12646 [DOI] [PubMed] [Google Scholar]
- 9.Paganetti H, Giantsoudi D. Relative biological effectiveness uncertainties and implications for beam arrangements and dose constraints in proton therapy. Semin Radiat Oncol 2018; 28: 256–63. doi: 10.1016/j.semradonc.2018.02.010 [DOI] [PubMed] [Google Scholar]