

Abstract
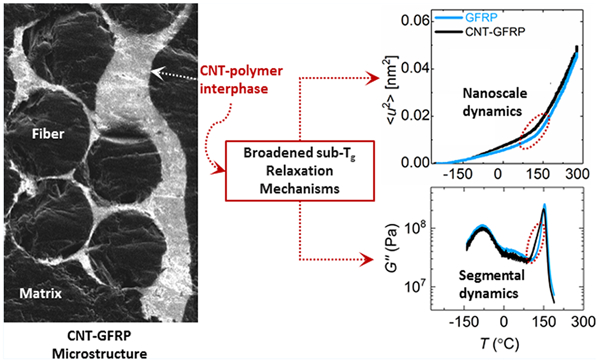
Carbon nanotube (CNT) grafted glass fiber reinforced epoxy nanocomposites (GFRP) present a range of stiffnesses (MPa to GPa) and length scales (μm to nm) at the fiber–matrix interface. The contribution of functionalized CNT networks to the local and bulk polymer dynamics is studied here by using a combination of torsion dynamical mechanical thermal analysis (DMTA), positron annihilation lifetime spectroscopy (PALS), and neutron scattering (NS) measurements. DMTA measurements highlight a reduction in the storage modulus (G′) in the rubbery region and an asymmetric broadening of the loss modulus (G″) peak in the α-transition region. NS measurements show a suppressed hydrogen mean-square displacement (MSD) in the presence of glass fibers but a higher hydrogen MSD after grafting functionalized CNTs onto fiber surfaces. PALS measurements show greater free volume characteristics in the presence of the functionalized CNT modified composites, supporting the view that these interface layers increase polymer mobility. While NS and DMTA are sensitive to different modes of chain dynamics, the localization of functionalized nanotubes at the fiber interface is found to affect the distribution of polymer relaxation modes without significantly altering the thermally activated relaxation processes.
Keywords: carbon nanotube composites, polymer nanocomposites, fiber reinforced polymer nanocomposites, polymer dynamics, viscoelastic properties, neutron scattering, hierarchical composites, positron annihilation lifetime spectroscopy
Graphical Abstract
INTRODUCTION
Addition of nanoscale reinforcements, such as CNTs, to polymer matrices has been shown to improve the structural, electrical, and thermal properties of the polymer. The large surface area of CNTs result in increased CNT–polymer interactions that improve the load transfer properties between the CNTs and the host matrix, while the interconnected nanotube contacts increase the electrical and thermal conductivities of typically insulating polymeric materials.1–4 Traditional approaches for manufacturing CNT-based polymer nanocomposites and CNT-based fiber reinforced polymer nanocomposites rely on directly dispersing CNTs into polymer matrices via ultrasonication,5,6 surfactant assisted/surface modified dispersions,3,7 three-roll mill,8 and high-speed shear mixing.9 Despite having success at lower CNT mass fractions (typically <1%), these methods are not effective in uniformly dispersing higher CNT mass fractions (>1%) because of the strong van der Waals interactions between the nanotube surfaces.8,10 This can lead to large-scale CNT agglomeration within the polymer matrix and cause processing issues due to increased resin viscosities and CNT screening from continuous fiber surfaces in the fiber reinforced polymer nanocomposites.11 Hence, the improvement in mechanical, thermal, and electrical properties of polymer nanocomposites and fiber reinforced polymer nanocomposites are often lower than theoretical predictions. Directly grafting CNTs onto microfiber surfaces presents a viable alternative to introduce a hierarchical composite architecture where CNT mass fractions (up to ≈20%) are localized on continuous fiber surfaces.12,13 The CNT networks impart a gradient in stiffness from the fiber to the matrix, thereby increasing the interfacial load transfer and toughness, and readily form a percolated network that increases electrical conductivity of fiber reinforced polymer nanocomposites.10,12,13 Two scalable approaches for directly grafting CNTs onto fiber surfaces include chemical vapor deposition (CVD) of carbon precursors10 and electrophoretic deposition (EPD) of functionalized CNTs.12 The latter approach has been found to preserve fiber sizing that allows covalent bonding between the fiber and polymer surfaces on commonly used continuous fiber surfaces (carbon12 and glass13) and is therefore adopted for CNT incorporation in this study.
Multifunctional application of CNT-based fiber reinforced polymer nanocomposites include utilizing the percolated CNT network for structural health monitoring, thermal transport, structural batteries, or antennae, which requires a knowledge of CNT–polymer interactions over long time durations or elevated temperatures.10,12,13 Furthermore, a thorough understanding of structure–interphase–property relationships (SIPR) is essential for designing and modeling the properties of hierarchical CNT-based fiber reinforced polymer nanocomposites. However, developing SIPR for hierarchical systems is challenging, as a single characterization technique does not adequately capture the structural influence of CNTs across bulk and nanoscale lengths. The polymer nanocomposite community has recognized the importance of understanding the role of reinforcement–polymer interactions via viscoelasticity and polymer dynamics for dispersions of 1-D (CNTs) and 2-D nanoscale reinforcements in thermoplastic or thermoset matrix.16–31 We first establish a framework for the effect of CNTs on polymer dynamics and viscoelasticity by summarizing both CNT-based polymer nanocomposites and CNT-based fiber reinforced polymer nanocomposites research literature.
The use of covalent and noncovalent functionalization to modify the surface properties of CNTs (to match the surface energy of the polymer matrix) is found to improve wetting and dispersion in thermoplastic polymers and increase the stiffness and the electrical conductivity of the matrix.20,21,32,33 In thermosets, optimizing CNT dispersion is challenging due to reinforcement induced increases in viscosity,34 potential for reaggregation and flocculation during cure, and the possible impact of nanoscale reinforcements on cure kinetics.16 Therefore, the results tend to be highly dependent on the system and processing conditions.14,17 Amine functionalization of the CNT surface improves dispersion and covalent bonding with the network,18,19 but the presence of excess surface amines distorts the local stoichiometry during curing and alters the viscoelastic properties of the epoxy.22 Viscoelastic property indicators of strongly bonded CNT–polymer systems are enhancements in the glassy and rubber moduli along with increases in the glass transition temperature (Tg).20–31 An increase in the glassy modulus is generally attributed to the improvements in stress transfer between the polymer and the CNTs, while an increase in the rubbery plateau modulus and polymer Tg is attributed to reduced polymer mobility at the surface of high-aspect-ratio CNTs (length/diameter up to 1000). The presence of CNTs has also been found to increase the stiffness of the matrix and reduce its damping properties (as measured by the area under the loss tangent (tan δ) peak).24,25,27,30,31 Nonbulk interphase domains of varying thicknesses are formed based on the chemical functionality,22,27,29 length,23,30 and rigidity27 of the functional groups on CNT surfaces that affect the polymer relaxation characteristics in these systems. Generally, favorable interactions between the matrix and the CNT functionality are found to increase21 and broaden segmental relaxation times,22,27,29 while unfavorable interactions cause reductions in segmental relaxation times.23
SIPR in hierarchical CNT–GFRPs involves a complex array of interactions beyond just the CNT (functionalization, geometry, dispersion) and polymer chemistry. The high CNT mass fraction–polymer interphase is localized at the rigid fiber substrate and becomes a third phase of the composite between the bulk polymer and the rigid fiber substrate with effects beyond controlling fracture and failure. The presence of the CNTs, extending hundreds of nanometers radially from the fiber surface, leads to a blurring of elastic and viscoelastic properties as one moves across the composite cross section. In this work, the nano- to mesoscale polymer properties are captured by characterizing the physical structure, the bulk viscoelasticity, and the polymer dynamics using a host of techniques. We show that within the time scales ranging between 10−12 and 106 s the viscoelastic behavior of a hierarchical CNT–GFRP is influenced by complex interactions of the topological constraints of the nanotubes, CNT–amine–epoxide chemical interactions, and continuous fiber surface constraints. Furthermore, the combination of metrologies used herein provides a pathway for understanding time-dependent properties of the fiber–matrix interphase in engineered multifunctional composites.
MATERIALS AND METHODS36
Sample Preparation.
Epoxy specimens were prepared by using a stoichiometric mixture (approximately 100:26.4, by mass) of bisphenol-F epichlorohydrin epoxy monomer (Epon 862; Hexion Specialty Chemicals) and an aromatic diamine curing agent (Epikure Curing Agent W; Hexion Specialty Chemicals). The liquid constituents were hand mixed, degassed, and drawn into approximately 1 mm thick films and cured in a convection oven. GFRP specimens were manufactured via a vacuum resin transfer process. The resin mixture was infused into four layers of unidirectional, E-glass fibers, where ≈15% of the overall fabric mass consisted of stitched fibers aligned perpendicular to the unidirectional fibers (Thayercraft, aminopropylsilane (APS) sizing). A multistep procedure is required for the manufacture of CNT–GFRP specimens. Multiwall CNTs (about 10–20 nm in diameter and over 200 nm in length) are dispersed in water and oxidized by a combination of ultrasonication–ozonolysis for about 16 h. After ozone treatment, hyperbranched polyethylenimine (PEI, Mw ≈ 25000 g/mol) was dissolved to a concentration of ≈1 g/L, and the dispersion was sonicated for about 4 h. Following this, the pH of the solution was adjusted to nominally 6 to facilitate the protonation of the amine groups and to form a stable dispersion of positively charged CNTs. The PEI-functionalized carbon nanotubes (CNT–PEI) were then deposited onto unidirectional E-glass fibers that were placed in direct contact with a stainless steel anode by using an electrophoretic deposition (EPD) process. The mass fraction of CNT–PEI on the glass fiber was determined by weighing the fabric before and after deposition on an analytical balance with a minimum resolution of 0.1 mg. The resulting CNT–PEI coating formed on the fibers is ≈25 mass % PEI.13 Because of the electrostatic interaction between the oxidized CNTs and protonated PEI molecules, it is noted that the CNT-rich layer (e.g., CNT, CNT–PEI, etc.) contains a PEI, epoxy, and diamine component. The CNT-coated fiber laminates (four layers) were processed similarly to the GFRP materials. A detailed description of this process is outlined in previous work by An et al.13 All materials were cured at ≈130 °C for ≈6 h and postcured at ≈150 °C for about 24 h. The samples were then machined using a high-speed water lubricated saw to approximately 35 mm by 4 mm by 1 mm for DMTA and approximately 50 mm by 30 mm by 1 mm for NS measurements.
Thermal Characterization.
Thermogravimetric analysis (TGA) was performed on the GFRP and CNT–GFRP to establish the fiber mass fraction in the composites. Samples weighing around 10 mg were heated to about 800 °C at a heating rate of nominally 10 °C/min in a platinum pan with an air purged volumetric flow rate of around 60 mL/min and maintained at that temperature for ≈30 min to remove any organic content. The residual mass content is nominally assigned to the fiber mass fraction. The experimentally determined mass fraction percentages of fiber content in GFRP and CNT–GFRP specimens are found to be similar (≈57%) and the mass fraction percentages of CNT and PEI were calculated to be ≈1.3% and ≈0.4%, respectively (details in Table S1).
Differential scanning calorimetry (DSC) was used to measure the limiting fictive temperature,35 on heating after cooling at the same rate, which is equivalent to Tg (within 1 °C) defined on cooling.37 We refer to limiting fictive temperature as the calorimetric Tg throughout the article. Two samples for each specimen, weighing ≈11 mg each, were sealed in an aluminum hermetic pan and cycled twice between about Tg − 65 °C and Tg + 40 °C at a heating rate of ≈10 °C/min and a nitrogen purge volumetric flow rate of nominally 50 mL/min. Prior to the start of each cooling cycle, the samples were held at around Tg + 40 °C for 30 min to remove the thermal history. The heat flow curve of the second heating cycle was then utilized to calculate the specimen Tg, as outlined by Moynihan et al.38 (FigureS1).
Dynamic Mechanical Thermal Measurements.
Dynamic mechanical thermal measurements were conducted on the specimens using an ARES-G2 rheometer equipped with a stainless steel rectangular torsion fixture and a liquid-nitrogen-cooled forced-convection oven. Prior to sample evaluation, the rheometer was calibrated as per manufacturer specifications to confirm that the standard uncertainties in the frequency and the modulus responses were within ±5% and ±8%, respectively. For temperature measurements, a standard uncertainty of ±0.1 °C was assumed. GFRP and CNT–GFRP specimens were mounted with the principal fiber direction parallel to the torsion axis to minimize their contribution to the shear modulus measurement. Multiple temperature sweeps (up to 3) were conducted between approximately Tg + 40 °C and −140 °C at an oscillating frequency of nominally 1 Hz and a cooling rate of 1 °C/min. Prior to the sweeps, all samples were held at about Tg + 40 °C for ≈1 h to remove thermal history. Strain sweeps were performed prior to the experiments to confirm that the initially set strain percentages at Tg + 40 °C (Epoxy: 1%; GFRP: 0.25%; CNT–GFRP: 0.35%) were within the linear viscoelastic range with sufficient signal/noise in the torque signal (minimum 200 μN·m) above Tg. The set strain values were automatically controlled (reduced) at each temperature step by the instrument to stay within a specified torque limit (200–500 μN·m).
Based on the maximum of the α-transition peak observed in G″ at 1 Hz, frequency sweeps were performed between about Tg + 40 °C and Tg − 65 °C. The temperature steps were nominally assigned to 8 °C intervals and reduced to 4 °C intervals in the transition region to increase data overlap for time–temperature superposition (TTS). At each temperature step, data were obtained across a frequency range of about 0.3 to 30 rad/s. For test temperatures that were equal to or above approximately Tg + 10 °C, all samples were thermally conditioned at the specified temperature for around 30 min to remove any thermal history. Below Tg + 10 °C, the samples were first held at approximately Tg + 10 °C for about 15 min to reset the thermal history and then isothermally held at the test temperature for about 1 h (≈10 times the testing time per Struik’s protocol)39 to minimize the effects of physical aging during data acquisition. Upon completing frequency sweeps for the entire test range, the frequency sweep measurement was repeated at approximately Tg + 40 °C to confirm the absence of sample degradation during experimentation. The method adopted by Dessi et al.40 was employed to verify that the instrument compliance did not significantly influence the measurement. By use of TTS, master curves were constructed by first reducing the tan δ using horizontal shifts (aT); subsequent vertical shifts were then performed with the aid of van Gurp–Palmen plot to reduce the G′ and G″ responses by using the aT obtained from tan δ shifts.35 Tref was chosen based on the Tg obtained from DSC measurements. This was similar to the α-transition temperature (Tα) obtained from single-frequency (1 Hz) G″–temperature sweeps.
Thermally activated processes in the glassy region (T < Tg − 150 °C) were investigated by performing frequency sweeps (nominally from 0.3 to 30 rad/s) between about 0 and −136 °C at an 8 °C temperature interval. As the effect of physical aging is considered minimal this far from the glass transition temperature,39 all samples were conditioned for ≈30 min at each temperature step prior to the measurements. After completion of frequency sweeps for the entire temperature range, the temperature step at 0 °C was repeated to confirm the validity of the frequency data. The TTS principle, described previously, was applied to generate master curves at a Tref ≈ −80 °C based on the maximum G″ response in the frequency sweep in the low temperature range.
Neutron Scattering.
Small-angle neutron scattering (SANS) measurements were performed to characterize the structure of the fiber–CNT–polymer interphase. The experiments were conducted on the NG-B 30m SANS instrument at the National Institute of Standards and Technology (NIST) Center for Neutron Research (NCNR). The samples were placed between quartz windows, and the measurements were performed with sample-to-detector distances of nominally (1, 4, and 13 m) and a neutron wavelength λ ≈ 6 Å to cover the Q-range from ≈0.004 to ≈0.5 Å−1, Q = 4π/λ sin(θ/2), λ being the incoming neutron wavelength and θ the scattering angle. Q represents the inverse of the length scale at which the structure of the system is probed and roughly corresponds to length scales of ≈13 to 1571 Å here. All scattering profiles were corrected for background, empty cell, and sample transmission to generate scattering patterns using Igor-based SANS packages developed at the NCNR.41
Elastic neutron scattering probes the nanoscale dynamics of polymers as a function of temperature. It is a nondestructive technique that uses a low-energy neutron beam to characterize atomic displacements by measuring changes in neutron energy upon scattering with the sample. Because of the high scattering cross section of hydrogen in NS techniques, it is well suited to probe relevant polymer dynamic processes at the nanoscale with characteristic times between 10−8 and 10−12 s. Here, only neutrons scattered elastically within the instrument resolution of ≈1 μeV (where |ΔE| = |Ef − Ei| ≲ 0.5 μeV, Ei and Ef being the initial and final energy of the scattered neutron, respectively) are recorded as a function of Q. The measurements were conducted on the high-flux backscattering (HFBS)42 spectrometer on NG-2 at the NCNR. The samples were wrapped with aluminum foil and placed in a sealed aluminum cylinder with a helium environment. The samples were isothermally kept at around 150 °C in this environment for about 12 h prior to measurement. The cylinder was placed in a top-loader closed-cycle thermal chamber that controls the sample temperature to an accuracy better than 1 °C. During the scans the temperature was varied between approximately −258.15 and 276.85 °C (14 and 550 K) at a heating rate of 1 °C/min. The intensity was collected across 16 detectors in a Q-range of ≈0.25 to ≈1.75 Å−1 that corresponds to length scales of ≈25.1 to ≈3.59 Å.
Electron Microscopy.
Prior to electron imaging, freshly cleaved cross sections (perpendicular to the glass fibers) of the CNT–GFRP laminate were wet polished using silicon carbide paper in the following order of grit size: 600, 800, 1200, and 2000. Scanning gallium ion microscopy (SGIM) imaging was conducted using a 30 kV electron-beam voltage at a 24 pA beam current. To obtain SEM images at magnifications greater than 1000×, the sample surfaces were sputter coated with a gold/palladium target for ≈40 s, which resulted in a nominal 4 nm thick conductive coating on the sample surfaces. The sample surfaces were then imaged using an electron beam with a 5 kV electron-beam voltage at a 100 pA beam current.
Positron Annihilation Lifetime Spectroscopy (PALS).
PALS is an electron/positron annihilation-based measurement that is often utilized to understand free-volume characteristics in polymeric materials. In materials with low electron densities, such as polymers and composites, thermalized positrons form a metastable bound state with an electron, termed positronium, which are largely confined to the pore structures/free volume.43 In fiber-composite specimens, this is assumed to occur at the fiber–polymer interfacial region and the polymer-rich regions.44 Under a vacuum environment, the triplet state of positronium, namely orthopositronium (o-Ps), has a lifetime of 142 ns. In polymers, this lifetime is often shortened to a few nanoseconds because of interactions between o-Ps and other electrons.43 The o-Ps lifetime (τ3) can be directly related to the cavity radius (R) and the cavity volume (Vc) via the Tao–Eldrup model45 via eqs 1 and 2, and the intensity of the o-Ps annihilation (I3) is often used as an indicator of the number density of interchain porosity. However, in commercial systems that contain a variety of chemical additives, the propensity of thermalized positrons to form positronium is affected by chemical moieties having high electron affinity, which consequently reduces I3.46 Hence, the product of τ3 and I3 or the relative free volume is not considered as a reliable metric to compare specimen porosity in this study; instead, only τ3 values are used.
| (1) |
| (2) |
Samples with approximate dimensions of 25 mm by 25 mm by 1.5 mm were tightly clamped on either side of a positron emission source. The source consists of 22NaCl salt (activity: 10 μCi) placed between two Kapton foils that are ≈50 μm thick and sealed using a commercial adhesive. The sample–source–sample assembly was wrapped in an aluminum foil and placed between two photomultiplier tubes (PMTs) coupled with plastic scintillators. The PMTs were designated to detect the γ-ray signatures corresponding to the positron emission process (≈1.27 MeV) and the subsequent positron/positronium (Ps) annihilation processes (≈0.511 MeV). The time difference in the positron production and the annihilation within the sample is recorded to generate the positron annihilation time spectrum, which was analyzed using a commercially available software. For each specimen, nearly 8 million counts of annihilation data were collected at room temperature conditions and atmospheric pressure.
The lifetime data obtained from each specimen are convoluted with the timing resolution (≈270 ps) of the spectrometer. Prior to sample measurements, the timing-resolution function of the spectrometer was estimated from an undoped, polycrystalline Si wafer having known positron lifetimes. A nominal source correction from positron annihilation within the 22NaCl salt and the surrounding Kapton film was applied to the specimen data by using an empirical relationship derived by McGuire et al.47 For each specimen, the PALS spectra were analyzed by assuming three discrete exponential lifetime components using PALSfit3.48 The shortest lifetime (τ1) is nominally assigned to the self-annihilation of parapositronium (p-Ps), the middle lifetime (τ2) to the free-positron annihilation, and the longest lifetime (τ3) to the orthopositronium (o-Ps) annihilation.
RESULTS AND DISCUSSION
Structural Characterization: Microscopy and SANS.
A key attribute of CNT–GFRP is the hierarchical microstructure surrounding fiber surfaces, as previously described by An et al.13 and represented in Figure 1a. It is difficult to observe the location and uniformity of the CNT layer across a large area at lower magnifications using SEM (Figure 1b). Stitching together high-magnification SEM images is time-consuming and requires a conductive coating that may alter the appearance of the deposited CNT layer. SGIM is a focused ion-beam technique that has been previously used to image large areas (up to 300 μm × 400 μm) in CNT-based polymer nanocomposites by applying a charge contrast between CNT-rich areas and the polymer-rich areas.8 Briefly, SGIM uses positively charged gallium ions which upon interaction with conductive and nonconductive surfaces alter the local surface electronic states. The Ga+ ions prevent the release of secondary electrons (SE) from epoxy- and glass-fiber-rich areas and cause them to appear dark, while the CNT-rich areas readily release SEs that neutralize the Ga+ and appear bright.8 This enables the visualization of the CNT–polymer interphase and provides a qualitative assessment of CNT confinement to fiber surfaces in the final composite, as shown in Figure 1c.
Figure 1.

(a) Illustration of a CNT–GFRP composite with the CNTs uniformly coating the glass fiber surfaces. (b) SEM image of the CNT–polymer interphase region where CNT-rich areas are not clearly visible. (c) SGIM image of CNT–polymer interphase shown in (b), where the charge contrast enables visualization of CNT-rich areas within the composite.
A thin CNT coating of about 100–200 nm was observed on individual fiber surfaces within a fiber bundle. Fibers situated in the outer regions of a ply show thicker CNT films (≈5 μm) than the fibers situated inside a ply (Figure 1c and Figure S2). This is attributed to the diffusion/deposition kinetics of CNTs during the EPD process. CNT deposition is typically initiated at the surface of the electrode, and the CNTs readily form a film around glass fibers that are in direct contact with the electrode. These CNT-coated glass fiber layers act as an extension of the electrode and promote further film growth. However, upon reaching a certain coating thickness on the outer layers, the diffusion of CNTs to the inner fiber layers within a ply is reduced. This is described in greater detail by An et al.13 An assumption of a minimum layer thickness ≈100 nm and a calculated mass percentage of deposited CNTs of 1.7% leads to an interphase volume of ≈2% of the total composite volume in the materials investigated here.
SANS measurements were conducted to characterize the averaged CNT morphology at length scales between approximately 1 and 200 nm, which is comprised mainly of the CNT layers internal to the composite. The coherent scattering intensity in SANS results from the differences in scattering length densities of the constituent atoms in each component, which includes any organic polymer (C, H, O, N), glass fibers (Si, O), and CNTs (C). Based on the length scale investigated, the mesh size between fibers and the textile laminates is too large to be resolved; the relevant structural feature probed is the roughness of the fiber–polymer interface. Figure 2a shows the 2-D neutron detector data for the GFRP and CNT–GFRP samples. Well-defined, ordered glass fiber structures arranged in a mesh result in highly anisotropic patterns with bands separated by 90° and with a higher intensity in the principal fiber direction of the unidirectional composite. The power law dependence of SANS intensity with exponent ≈−4 (Porod scattering)49 in the GFRP system (Figure 2b) suggests a sharp, smooth interface formed between the epoxy and the fibers, in agreement with the microscopy images (Figure S3). CNT–GFRP shows a diffuse, isotropic scattering in addition to the ordered fiber structure of the GFRP at higher length scales (lower Q), as shown in 2-D detector image in Figure 2b. The CNT features are present in the intermediate Q range. Subtracting the intensity of CNT–GFRP from the intensity of GFRP yields the profile shown in Figure 2c, which corresponds to form factor contributed only by the CNT–polymer interphase. There are multiple length scales associated with the tube-like 2-D structures of CNTs that crossover at Q ≈ 0.03 Å−1, which is a length scale associated with the CNT diameter (≈2π/Q) of 20 nm. At larger length scales, or lower Q, the rod-like nature of CNTs yields the power-law exponent of −1.5, which is consistent with previous observations.8 Note that this exponent is observed to be −1 only in the case of perfect individual rods, which is not expected for functionalized CNTs deposited on fiber surfaces. Similarly, at smaller Q, the scaling deviates from −4, an ideal case for rods.
Figure 2.

Small-angle neutron scattering measurements on fiber composite specimens. (a) 2-D detector images obtained from GFRP and CNT–GFRP showing highly ordered bare fiber structure (left) and additional diffuse scattering due to CNT coating on fiber (right). (b) Scattering intensity–wavevector profiles from the GFRP and CNT–GFRP samples clearly showing the CNT contribution in the intermediate Q-range. (c) Intensity of CNT–GFRP subtracted by the intensity of GFRP showing the bare contribution of CNTs. The numbers in the figure correspond to exponents from the power law scattering dependence.
Several conclusions may be drawn about the structure of the CNT–GFRP system from microscopy and SANS. The functionalized CNT network is preferentially distributed at the interface of the majority of glass fibers and has a varying coating thicknesses that is infiltrated by the epoxy matrix. Moving outward from the glass fiber interface, there is a transition from the CNT–PEI–epoxy interphase to the bulk epoxy matrix. SANS data show that a sharp interface formed between the glass fibers and the polymer matrix is modified into a rougher interface in the presence of CNTs. Based on these structural observations, the CNT–GFRP composite is expected to exhibit different viscoelastic properties and polymer dynamics than the GFRP, and any differences are expected to be localized in the nonbulk, polymer–CNT–fiber interphase layer (composed of CNT–PEI–epoxy) in this system.
Viscoelastic Properties as a Function of Temperature at a Single Frequency.
The temperature dependence of G′ and G″ in the presence/absence of grafted CNT networks and glass fibers was evaluated at a fixed frequency, i.e., nominally 1 Hz, for CNT–GFRP, GFRP, and Epoxy specimens, as shown in Figure 3 and Figure S4. G′ increases by nearly 2 orders of magnitude when the specimens undergo a transition from a rubbery to a glassy state (Figure 3a). An α-transition (segmental relaxation) is observed between 100 and 190 °C and a β-transition (side-chain motion or sub-Tg dynamics) between 0 and −140 °C, as shown from the G″ response in Figure 3b.50,51 The temperatures corresponding to the maximum value of G″ in the α- and β-transition regions are designated as the α- and β-transition temperatures (Tα and Tβ), respectively. The widths of the β-transition peaks are ≈2 times broader than the α-transition peaks (Figure 3b), and the Tβ occurs at ≈−80 °C for all specimens. A Tα of ≈149 °C was observed in the CNT–GFRP, which is about 5 °C lower than that observed for the GFRP and the Epoxy specimens (≈154 °C) (Figure 3b and Table 1). The Tα measured from DMTA was compared against the Tg measured using a DSC (Table 1). The calorimetric Tgs of the CNT–GFRP and the GFRP specimens differ by only about 2 °C. A good agreement (difference of <1%) between Tα and Tg was observed for all specimens in this study (Table 1), although both techniques may capture relaxation time distributions differently.35
Figure 3.

(a) Storage (G′) and (b) loss (G″) moduli of Epoxy, GFRP, and CNT–GFRP represented as a function of temperature, measured at a single frequency (nominally 1 Hz) and a cooling rate of about 1 °C/min. The standard uncertainty on the frequency and the modulus responses were found to be within ±5% and ±8%, respectively. For temperature measurements a standard uncertainty of ±0.1 °C is assumed based on manufacturer specifications.
Table 1.
Transition Temperatures (Tg and Tα) Pertaining to the Segmental Relaxation of the Specimens Determined by Using Thermal (DSC) and Dynamic Mechanical (DMTA) Measurementsa
| sample | Tg, DSC (°C) | Tα, DMTA (°C) |
|---|---|---|
| Epoxy | 153.2 ± 0.2 | 154.5 ± 0.3 |
| GFRP | 152.9 ± 0.6 | 153.3 ± 0.1 |
| CNT-GFRP | 151.0 ± 0.1 | 149.4 ± 0.4 |
The standard deviations in DSC measurements are derived from testing two samples from each specimen, and the standard deviations in DMTA measurements are obtained by averaging peak intensities over two consecutive measurements.
Both CNT–GFRP and GFRP specimens exhibit higher G′ and G″ than the Epoxy specimen over the entire temperature range. This is attributed to the presence of continuous, microscale glass fibers (≈57 mass %) that increase both the torsional stiffness (G′) and the frictional losses (G″) at the fiber–polymer interface (Figure 3a,b). However, the tan δ peak intensity (Figure S4) is lower in GFRP and CNT–GFRP compared to the Epoxy system, indicating that the purely elastic reinforcements of glass fibers (magnitude of G′) dominate any frictional losses at the fiber–polymer interface (magnitude of G″).52,53 The CNT–GFRP specimen exhibits marginally lower dynamic moduli (G′ and G″) (Figure 3a,b) and a significantly wider α-transition peak than the GFRP specimen (Figure 3b and Figure S4). A single-frequency temperature sweep evaluates the moduli responses weighted strongly to relaxation processes closest to 1/ω at each temperature. At low temperatures, the technique is sensitive to the shortest relaxation times and at high temperatures toward the longest relaxation times. Because the interfacial properties of the hierarchical microstructure are expected to exhibit a range of viscoelastic responses over different relaxation times, multiple frequency sweep measurements were conducted over a large temperature range to probe these relaxation processes.
Viscoelastic Properties as a Function of Temperature and Frequency.
Frequency scans were conducted in the α and β transition temperature ranges for all specimens to explore the origins of broadening in the α-transition peak observed in the single-frequency temperature scan of the CNT–GFRP. The frequency range was fixed between nominally 0.3 and 30 rad/s (2 orders of magnitude) to reduce measurement time and limit instrumental errors associated with long data collection.50 Frequency sweeps conducted on the CNT–GFRP between Tg + 40 °C and Tg − 65 °C are shown in Figure 4. The frequency sweeps of the Epoxy and the GFRP specimens are shown in Figures S5 and S6.
Figure 4.

(a) Storage (G′) and (b) loss (G″) moduli as a function of frequency (ω) between 0.3 and 30 rad/s over the α-transition range for a CNT–GFRP specimen. The standard uncertainty on the frequency and the modulus responses were found to be within ±5% and ±8%, respectively. For temperature measurements a standard uncertainty of ±0.1 °C is assumed based on manufacturer specifications.
TTS was used to construct the G′, G″, and tan δ master curves over a relaxation time range of ≈10 decades. Time–temperature equivalence in commercial epoxy formulations is often an approximation;54 its feasibility to this study is verified as part of the data reduction process. We briefly describe the shifting process in the interest of clarity. In the first step of data reduction, tan δ responses at various temperatures (as a function of frequency) were shifted to a reference temperature (Tref) along the frequency axis, by applying a set of horizontal shift factors, aT. For TTS shifts in the α-transition region, Tref was equal to Tg for all specimens by DSC. In the case of β-transition, Tref was assigned to the temperature corresponding to the peak G″ response (Tβ ≈ −80 °C for all samples). Subsequent vertical shifts (bT) were performed with the aid of van Gurp–Palmen plots and applied to the G′ and G″ master curves. An example of the shifting process performed in the α-transition region is shown for the Epoxy specimen in Figure S7, and the van Gurp–Palmen plots for GFRP and CNT–GFRP specimens in the α-transition region are shown in Figure S8.35 The overlap of complex moduli shifts in the van Gurp–Palmen plot was also used to assess thermorheological complexity of the specimens. Both Figures S7 and S8 highlight a minor mismatch in data overlap at the maximum in the α-transition peak and at the highest temperatures. Because of the reasonable overlap across the majority of the G′, G″, and tan δ master curves, a TTS approximation may be considered valid for comparing relaxation characteristics in these materials.
Trends in bT for the α-relaxation process are presented in Figure 5a. Vertical shifts during TTS are governed by physical aging in the glassy region and the temperature to density ratio of samples in the rubbery region. Corrections for changes in magnitude of G′ and G″ are typically small (or negligible) for simple polymers.55 Though the commercially formulated epoxy resin and the presence of micro- and nanoscale reinforcements may introduce variations in bT, the magnitude of bT for all specimens is found to be much smaller than aT, as observed in Figure 5 and Figure S9. It is also observed that the magnitude of bT for the CNT–GFRP is lower than that observed for the GFRP and the Epoxy specimens, especially in the glassy region. This may be attributed to the presence of strong interfacial interactions between CNT–PEI and the epoxy matrix, which has previously been shown to reduce composite expansion in the glassy–rubbery transition region.56
Figure 5.

Variation of (a) vertical shift factors (bT) and horizontal shift factors (aT) as a function of temperature for all specimens. In (b), the fit line represents a WLF fit above Tref and shows a departure from equilibrium conditions below the α-transition temperature. The adjusted R2 values for WLF fit was at least 99% for all specimens.
Trends in aT as a function of temperature are shown in Figure 5b. Above Tref (≈Tg), trends in aT for all specimens are found to obey the Williams–Landel–Ferry (WLF) equation:55
| (3) |
where C1 and C2 are the WLF fit constants, T is the measurement temperature, and Tref is the reference temperature (≈ Tg). The constants C1 and C2 are found to be similar for all specimens, and the values are reported in Table S2.
Below Tref, aT deviates from the WLF model as the polymer chain dynamics approach a nonequilibrium glassy state. The deviation from equilibrium is found to be smaller in magnitude (larger aT) in the CNT–GFRP specimen as compared to GFRP and Epoxy specimens (Figure 5b). As all samples were subjected to similar thermal conditioning, it is likely that the relaxation characteristics of the epoxy are altered in the presence of functionalized CNT networks. At lower temperatures near β-transition, aT was fit by using an Arrhenius model, as shown in Figure S10. The activation energy (Ea) for the β-relaxation process is ≈16 kcal/mol for all specimens, which is similar to the Ea reported by Hunston et al.50 for a commercial epoxy-amine system.
The reduced master curves obtained after TTS are presented in Figure 6. General trends in G′ over the entire frequency range show an increase in the magnitude of G′ for both the GFRP and the CNT–GFRP specimens as compared to the Epoxy specimen (Figure 6a). This is attributed to the inclusion of glass fibers and was previously observed in the single frequency (1 Hz), temperature sweeps. In this study, glass shear modulus (Gg) is defined as the storage shear modulus measured at (Tref − 65 °C) and the highest frequency (30 rad/s), while rubbery shear modulus (Gr) is defined as the storage shear modulus measured at (Tref + 40 °C) and the lowest frequency (0.3 rad/s). The Gg and Gr of the GFRP and CNT–GFRP specimens are presented in Table 2. A minor increase in Gg and a reduction in Gr are observed for the CNT–GFRP as compared to the GFRP specimen. The increase in Gg is likely due to an increase in sample stiffness caused by the presence of interfacial CNT networks while the reductions in Gr are less clear. We attribute this decrease to reduced epoxy cross-linking reactions or increased polymer segmental mobility within the CNT–PEI–epoxy–fiber interface. Further study is underway to elucidate this observation.
Figure 6.

Reduced master curves generated after horizontal shifts of frequency and vertical shifts of dynamic moduli at Tref. (a) Reduced storage (bTG′) and (b) reduced loss (bTG″) moduli versus reduced frequency (aTω). (c) Normalized loss tangent (tan δ) versus normalized reduced frequency. The tan δ axis was normalized against its maximum value while the frequency axis was normalized against the reduced frequency corresponding to the maximum tan δ. The fits shown for (a) and (b) are based on Maxwell’s equations for generating a discrete relaxation spectrum. The standard deviations for the fits are <0.02% for all specimens.
Table 2.
Glassy (Gg) and Rubbery (Gr) Shear Modulus of the GFRP and CNT–GFRP Specimensa
| sample | Gg (MPa) at Tref − 65 °C | Gr (MPa) at Tref + 40 °C |
|---|---|---|
| GFRP | 1945 ± 5 | 168 ± 4 |
| CNT-GFRP | 2144 ± 5 | 124 ± 5 |
The standard deviations on the Gg data were calculated from the scatter in limiting high-frequency, and the standard deviation in Gr was estimated based on scatter in limiting low-frequency from two independent measurements at Tref + 40 °C.
G″ master curves for all specimens are shown in Figure 6b. Both the GFRP and the CNT–GFRP specimens show a significantly broader α-relaxation characteristic compared to the Epoxy specimen, originating from the frictional losses caused by increased physical and chemical interactions between the glass fiber and the polymer surfaces at the interface. The CNT–GFRP exhibits additional broadening at both high- and low-frequency regions of the G″ curve, asymmetrically stretching further in the high-frequency (glassy) region, similar to that observed in G″ response at 1 Hz (Figure 3b).
To better understand the magnitude of broadening observed in the α-transition region, the tan δ peak was normalized against its maximum value (tan δmax) and is presented as a function of frequency for all specimens in Figure 6c.57 The addition of glass fibers in the GFRP results in a nearly 5-fold increase in the full width at half-maximum (fwhm) of normalized tan δ as compared to the Epoxy specimen. This may be due to the shifting of the dominant rubbery and glassy relaxation modes introduced by interfacial interactions between the fiber sizing and the epoxy resin.58 The fwhm of the normalized tan δ response further broadens asymmetrically by nearly 2-fold, specifically into the glassy region upon grafting PEI-functionalized CNTs (≈1.7 mass %) onto the fiber surfaces. The observation of this type of broadening in α-relaxation characteristics is not uncommon in CNT-based polymer nanocomposites. It has been previously reported that covalent interactions between dispersed CNTs and polymer matrices result in the formation of nonbulk interphase domains around nanotube surfaces, and their viscoelastic properties often differ from bulk polymer characteristics, along with changes in polymer Tg.21,23,59 A similar treatment of CNT–resin interaction can be extrapolated to this study; however, it is important to note that some of the key differences between this study and its predecessors include the presence glass fibers, the differences in resin chemistry, CNT morphologies, CNT mass fractions, CNT functionality, and importantly the localization of the CNTs to the fiber–polymer interface. As the CNT–PEI–epoxy interactions are largely restricted to interphase regions, which are estimated to be around only 2% of the total composite volume, the role of the interphase in affecting bulk polymer dynamics may be less drastic as compared to previous studies.
The relaxation characteristics of the CNT–GFRP system are represented as a function of time by fitting a sum of Maxwell elements (eqs 4 and 5) to the master curves (G′ and G″) using a commercial software developed by Winter et al.55,60,61
| (4) |
| (5) |
where Ge is the equilibrium modulus (Ge > 0 for solids), ω is the angular frequency in rad/s, gi is the series coefficient, and τi is the relaxation time of the ith coefficient, to develop discrete relaxation spectra shown in Figure S11. The model fits to their respective master curves are shown in Figure 6a,b. The standard deviations for the fits are <0.02% for all specimens.
The trends observed in the relaxation spectrum fit (Figure 7) are similar to that observed in frequency space presented in Figure 6. The relaxation spectra have been normalized to the highest series coefficient to facilitate comparison of the shapes between specimens. The Epoxy specimen exhibits relaxation processes spanning nearly 10 orders of magnitude, similar to that observed previously by Brien et al.62 in an identical resin–hardener combination. In GFRP and CNT–GFRP, the presence of glass fibers retards the polymer chain relaxation primarily at the interfacial region, leading to an increase in the influence of longer relaxation times (100−107 s) in the rubbery region. Similar to the behavior in frequency space, the changes in viscoelastic properties of the CNT–GFRP is localized to fast relaxation time processes (τ/τmax < 1).
Figure 7.

Normalized relaxation spectra calculated using dynamic moduli master curves shown in Figure 6. The relaxation spectra have been normalized based on the highest series coefficient.
Several potential factors, based on the influence of the CNT–polymer interphase, could contribute to the broadening observed in the viscoelastic characteristics (identified in Figures 3, 6, and 7). The surface functionality on CNTs consist of high-molecular-weight (25000 g/mol), flexible, hyperbranched amine groups. Faster PEI–epoxy segmental mobility at the interphase (as compared to the bulk of the polymer) may lead to reductions in Tα (and Tg) and broadened relaxation characteristics, as observed by Chen et al. in a CNT–epoxy system consisting of large molecular weight (≈2000 amu) amine grafts on CNTs.23 The presence of excessive amine groups in the PEI may also affect the local nanoscale cure kinetics within the CNT–PEI–epoxy interphase and, thus, modify its relaxation characteristics. For all specimens, the ratio of epoxy resin to aromatic hardener was maintained at stoichiometry. We assume that within the CNT interphase region the presence of hyperbranched PEI increases the equivalent hydrogens available for the epoxide ring-opening reactions. The stoichiometric offset in reaction chemistry between amine and epoxide groups may cause minor reductions in Tg because of an increase in the chain ends, which leads to excessive free volume at the CNT–PEI–epoxy interphase, similar to that observed by Palmese et al.63 Another possible effect on the cure chemistry may be due to the topological constraints associated with the hyperbranched amine structure that reduces the accessibility to the internal amine groups of PEI and decreases the kinetics of the cross-linking reactions between the PEI and the epoxy.64 Reduced covalent interactions can result in increased noncovalent interactions (van der Waals and hydrogen bonding) between the CNT–PEI–epoxy–fiber constituents that are analogous to thin polymer films enclosed within nonwetting, hard surfaces (or free surfaces), where the relaxation characteristics along with the Tg are affected.65,66 Further study is underway to understand whether PEI-influenced cure changes are likely to increase, decrease, or broaden relaxation times.
Regardless of the specific physical or chemical nature of the heterogeneity introduced into the epoxy relaxation mechanisms, the incorporation of grafted CNTs on glass-fiber surfaces has achieved a change in viscoelastic characteristics of the CNT–GFRP that is unique to this commercially relevant, hierarchical composite architecture. The time dependence of the polymer segmental relaxation has been altered without significant changes to the temperature dependence. This is evident from the lack of significant changes to the Tg (or Tα) of the polymer matrix before and after CNT–PEI addition, which are different from the trends observed in poor23 or strongly21 interacting CNT–polymer systems. Therefore, the overall influence of the CNT–PEI–epoxy interphase on the polymer dynamics is highly localized and less drastic as compared to dispersed CNT-based polymer nanocomposites, as mentioned earlier.
Nanoscale Polymer Dynamics and Free-Volume Characterization.
The HFBS spectrometer was used to characterize the nanoscale polymer chain dynamics in the Epoxy, GFRP, and CNT–GRFP specimens and ascertain the role of CNT–PEI–epoxy interphase. These measurements capture both incoherent and coherent scattering of neutrons from the sample. Incoherent scattering is related to the spatial correlations of the same atom at different times and gives a measure of the self-motion, while coherent scattering is due to spatial correlations between different atoms at different times and gives a measure of the collective motion. The scattering intensity is dominated by the self-motion of H atoms since the incoherent scattering cross section of H atoms is very large when compared to coherent and incoherent cross sections of other atoms in the samples. Therefore, incoherent scattering measured on the HFBS instrument provides information about the self-motion of H in polymer chains, both in the bulk phase and in the interphase.
A temperature scan of the elastic scattered intensity provides information about the motions and thermal transitions occurring in the samples (Figure 8a). The elastic intensity Iel(Q,T) is dominated by the hydrogen dynamics slower than ≈1 ns (instrumental resolution). Differences in sample volume or polymer weight fraction are eliminated by normalizing intensities to those obtained at the lowest temperature Iel(Q,T)/Iel(Q, T ≈ −258.15 °C) which allows a direct comparison between the samples as shown in Figure 8a. At the lowest temperature T ≈ −258.15 °C, all motions are essentially frozen at the time scale of the instrument (≈1 ns). Increasing temperature decreases the elastic intensity as the atoms on the pendant functional groups vibrate or rotate faster than the instrument resolution. The stepwise decrease in slope at ≈127 °C is a signature of the glass transition indicative of main chain motion. Above the Tg, the chain segments in the backbone contribute to faster hydrogen dynamics (lower elastic intensity and larger MSDs) due to translational motion. In the region of glass transition, α (side chain) and β (main chain) relaxation merges whereas at temperatures well above the Tg, the localized dynamics are too fast, and the observed intensity change at the highest temperature is solely due to segmental dynamics of the epoxy chains. From the Q dependence of the elastic intensity, the mean-square displacement (MSD) of the hydrogen atoms, 〈u2〉, is estimated by eq 667,68 and shown in Figure 8b.
| (6) |
On the basis of the results shown in Figure 8, we see that the MSD within the range of the temperature–frequency sweep measurements follows the following trend: Epoxy > CNT–GFRP > GFRP. Increasing the fraction of interfacial area within the specimens via the addition of fillers widens the transition region between sub-Tg dynamics and segmental dynamics as observed in Figure 8b. Above 177 °C, the contribution of the interphase weakens and the MSDs of GFRP and CNT–GFRP merge. The inclusion of rigid fiber fillers in both glass and CNT-coated glass fiber composites retard the overall polymer dynamics, in both the glassy and the rubbery regime.
Figure 8.

Elastic neutron scattering results. (a) Normalized elastic intensity–temperature scans for the polymer, GFRP, and CNT–GFRP samples. (b) Mean-square-displacement of H atoms determined from the Q dependence of the elastic scattering intensity (see the text) as a function of temperature.
The differences in the o-Ps lifetimes and their corresponding intensities as measured by PALS is shown in Table 3. The normalized spectra and the complete analysis are shown in the Supporting Information (Figure S12 and Table S3). At room temperature conditions, the lifetime values follow the trend Epoxy > CNT–GFRP > GFRP, which indicates that the average pore-size in the polymer reduces upon addition of fibers. This is similar to the trend observed for the MSD at room temperature conditions. The reduction of pore size in the fiber composite specimens may be attributed to increased polymer chain confinement between densely packed fibers due to physical and chemical interactions between the fiber surfaces and the polymer.69 Upon comparison of GFRP and CNT–GFRP specimens, the CNT–PEI interface is found to increase the average size of free-volume sites. As discussed previously, this is likely due to a variety of reasons including increased polymer chain ends from nonstoichiometric cure process at the interface, higher flexibility (reduced chain frustration) of the PEI molecule, and increased surface roughness due to addition of CNTs.
Table 3.
Orthopositronium Annihilation Lifetime (τ3) and Its Corresponding Intensity (I3) for the Various Test Specimensa
| sample | τ3 (ns) | I3 (%) | reduced χ2 |
|---|---|---|---|
| Epoxy | 1.700 ± 0.005 | 26.7 ± 0.1 | 0.99 ± 0.02 |
| GFRP | 1.643 ± 0.007 | 17.5 ± 0.2 | 1.03 ± 0.02 |
| CNT-GFRP | 1.684 ± 0.008 | 16.6 ± 0.2 | 1.01 ± 0.02 |
The standard deviations for all the samples are based on the nonlinear least-squares fitting process carried out using a commercial software, with reduced χ2 values shown in the table.
The I3 values in the Epoxy sample are found to be higher than the fiber composite samples. This is attributed to the lower polymer mass fraction (≈40%) in the fiber composite samples, as compared to the 100% Epoxy sample. Though a minor reduction in I3 was observed in CNT–GFRP specimen as compared to GFRP specimen, the origins of this reduction were not explored due to potential interference from positronium quenching mechanisms in these samples.
CONCLUSIONS
Direct attachment of CNTs to the surface of microscale glass fibers is a commercially viable, alternate route to produce hierarchical, multifunctional nanocomposites. The effects of CNTs on viscoelastic properties are not as well understood as the mechanical or fracture properties due to the complex nature of the CNT–PEI–epoxy interphase localized to fiber surfaces. A combination of DMTA temperature–frequency measurements and NS techniques was used to interrogate the GFRP and CNT–GFRP materials—in particular, the interphase contribution to viscoelasticity and polymer dynamics throughout the glassy-to-rubbery transition region. Results from both techniques, despite their differences in sensitivity to length and time scales, suggest that the polymer viscoelasticity is influenced by the presence of PEI-functionalized CNT layers. The combination of techniques provides a unique insight into the effects of confining an anisotropic interphase layer on the dynamic properties of bulk CNT–GFRP that have not been previously reported. These insights are summarized below.
(1) The localization of the CNT complex at the fiber interface does not significantly alter the Tg of the composite. DSC, DMTA, and HFBS provide a slightly different estimate of Tg; e.g., the transition occurs at ≈127 °C for HFBS, which is ≈5% smaller compared to the values obtained from the DSC and DMTA. More importantly, the addition of neither glass fibers nor CNT–PEI causes a substantial change in Tg. This is consistent with the results observed in highly filled attractive polymer nanocomposites where the changes in Tg remain within 10%.70
(2) The introduction of nonbulk interphase domains broadens the glassy–rubbery transition region of the epoxy across both the measured frequency and time scales, as evidenced by both DMTA and HFBS measurements. The α-transition peak of the epoxy is observed to undergo broadening with the addition of both micro- and nanoscale reinforcing constituents, i.e., glass fibers (≈58 mass %) and CNT–PEI (≈1.7 mass %). In the DMTA measurements, the broadening in α-relaxation process is more significant right below Tg (or Tα), while in HFBS measurements, the broadening is consistent across the entire transition region. This translates into increased contribution of short time-scale relaxation process (or high frequency in TTS) due to the CNT–PEI complex. The fact that the MSD of CNT–GFRP is larger than that of GFRP near-Tg and in the sub-Tg region suggests that the localized dynamics of the epoxy are faster in the presence of CNT–PEI coating. The broadening is likely related to the heterogeneity in local environments experienced by the epoxy due to the presence of the CNT–PEI complex extending a significant distance out from the fiber surfaces.
(3) While the CNTs increase the elastic stiffness of the composite deeper in the glassy region, they alternatively result in a more compliant material above the glass temperature. The Gr of CNT–GFRP is ≈26% lower than GFRP. This indicates higher mobility of cross-links or lower cross-link density in the rubbery region and is supported by higher MSD of the CNT–GFRP in this temperature range. The nano- to microscale roughness introduced by CNT deposition (as shown by SGIM and SANS) on the glass fiber surfaces may induce topological constraints that result in a higher free volume (as shown by PALS measurements at room-temperature conditions) and faster local hydrogen dynamics (HFBS measurements). Alternatively, the stoichiometric offset by the presence of excessive hydrogen from the PEI may reduce interfacial covalent bonding between CNT–PEI and the epoxy and thereby reduce Gr.
The specific origin of viscoelastic broadening and influences on MSD are difficult to isolate in this complex system. Overall, the results suggest that the PEI-functionalized CNT coating on the glass fibers increases the contribution of the interphase to the mechanical relaxation of the composites without altering a key engineering specification, the Tg. In the broader context with respect to engineering applications of these materials, the changes in relaxation properties may not be inconsequential. The transport of small molecules (water, solvent, etc.) through the fiber reinforced composites, creep and stress relaxation, electrical conductivity, and thermal expansion may be influenced by the structural and viscoelastic variations identified here. The ability to measure both structure and interfacial viscoelastic properties will guide engineering of the percolated CNT networks for various multifunctional applications.
Supplementary Material
ACKNOWLEDGMENTS
The authors acknowledge Dr. Jonathan Seppala for his timely assistance with the dynamical mechanical testing. Research performed in part at the NIST Center for Nanoscale Science and Technology NanoFab. A.K. acknowledges financial assistance from the U.S. Department of Commerce, National Institute of Standards and Technology (Award 70NANB15H272). R.T. acknowledges the National Institute of Standards and Technology for funding (Award 70NANB15H112). Access to NGB-30m SANS and HFBS was provided by the Center for High Resolution Neutron Scattering, a partnership between the National Institute of Standards and Technology and the National Science Foundation under Agreement DMR-1508249 for financial assistance of E.S., E.T.T., and S.M.D. acknowledge financial assistance by the U.S. National Science Foundation (Grant 1254540). B.N. acknowledges the support of the Air Force Office of Scientific Research (Award F1ATA00236G002). D.H. acknowledges support from National Institute of Standards and Technology for funding (Award SB1341-12-CQ-0011). F.A.B. acknowledges funding from the National Institute of Standards and Technology for funding (Award 70NANB18H027). A.M.F, A.L.F., and A.F. were supported through congressional appropriations to the National Institute of Standards and Technology.
Footnotes
Supporting Information
The Supporting Information is available free of charge on the ACS Publications website at DOI: 10.1021/acsapm.9b00464.
DSC thermograms for all specimens; SGIM and SEM images of CNT–GFRP and GFRP cross sections; DMTA supporting information: (i) loss tangent responses of all specimens as a function of temperature measured at a single frequency and a cooling rate of 1 °C/min, (ii) temperature–frequency sweeps of Epoxy and GFRP specimens, (iii) van Gurp–Palmen plots of all specimens, (iv) horizontal shift factors in the β-transition region for all specimens, (v) relaxation spectra of all specimens, (vi) WLF fitting parameters for all specimens; TGA analysis for all specimens; PALS spectra and the analysis table for all specimens (PDF)
The authors declare no competing financial interest.
REFERENCES
- (1).Spitalsky Z; Tasis D; Papagelis K; Galiotis C Carbon Nanotube-Polymer Composites: Chemistry, Processing, Mechanical and Electrical Properties. Prog. Polym. Sci 2010, 35 (3), 357–401. [Google Scholar]
- (2).Thostenson ET; Ren Z; Chou T-W Advances in the Science and Technology of Carbon Nanotubes and Their Composites: A Review. Compos. Sci. Technol 2001, 61 (13), 1899–1912. [Google Scholar]
- (3).Gojny FH; Wichmann MHG; Fiedler B; Kinloch IA; Bauhofer W; Windle AH; Schulte K Evaluation and Identification of Electrical and Thermal Conduction Mechanisms in Carbon Nanotube/Epoxy Composites. Polymer 2006, 47 (6), 2036–2045. [Google Scholar]
- (4).Thostenson ET; Li C; Chou TW Nanocomposites in Context. Compos. Sci. Technol 2005, 65 (3–4), 491–516. [Google Scholar]
- (5).Gkikas G; Barkoula NM; Paipetis AS Effect of Dispersion Conditions on the Thermomechanical and Toughness Properties of Multi Walled Carbon Nanotubes-Reinforced Epoxy. Composites, Part B 2012, 43 (6), 2697–2705. [Google Scholar]
- (6).Pagani G; Green MJ; Poulin P; Pasquali M Competing Mechanisms and Scaling Laws for Carbon Nanotube Scission by Ultrasonication. Proc. Natl. Acad. Sci. U. S. A 2012, 109 (29), 11599–11604. [DOI] [PMC free article] [PubMed] [Google Scholar]
- (7).Vaisman L; Wagner HD; Marom G The Role of Surfactants in Dispersion of Carbon Nanotubes. Adv. Colloid Interface Sci. 2006, 128–130 (2006), 37–46. [DOI] [PubMed] [Google Scholar]
- (8).Natarajan B; Orloff ND; Ashkar R; Doshi S; Twedt K; Krishnamurthy A; Davis C; Forster AM; Thostenson E; Obrzut J; Sharma R; Liddle JA Multiscale Metrologies for Process Optimization of Carbon Nanotube Polymer Composites. Carbon 2016, 108, 381–393. [Google Scholar]
- (9).Sandler J; Shaffer MSP; Prasse T; Bauhofer W; Schulte K; Windle AH Development of a Dispersion Process for Carbon Nanotubes in an Epoxy Matrix and the Resulting Electrical Properties Matrix and the Resulting Electrical Properties. Polymer 1999, 40, 5967–5971. [Google Scholar]
- (10).Wicks SS; Wang W; Williams MR; Wardle BL Multi-Scale Interlaminar Fracture Mechanisms in Woven Composite Laminates Reinforced with Aligned Carbon Nanotubes. Compos. Sci. Technol 2014, 100, 128–135. [Google Scholar]
- (11).Lachman N; Wiesel E; Guzman de Villoria R; Wardle BL; Wagner HD Interfacial Load Transfer in Carbon Nanotube/Ceramic Microfiber Hybrid Polymer Composites. Compos. Sci. Technol 2012, 72 (12), 1416–1422. [Google Scholar]
- (12).An Q; Rider AN; Thostenson ET Electrophoretic Deposition of Carbon Nanotubes onto Carbon-Fiber Fabric for Production of Carbon/Epoxy Composites with Improved Mechanical Properties. Carbon 2012, 50 (11), 4130–4143. [Google Scholar]
- (13).An Q; Rider AN; Thostenson ET Hierarchical Composite Structures Prepared by Electrophoretic Deposition of Carbon Nanotubes onto Glass Fibers. ACS Appl. Mater. Interfaces 2013, 5 (6), 2022–2032. [DOI] [PubMed] [Google Scholar]
- (14).Thostenson ET; Chou T-W Real-Time in Situ Sensing of Damage Evolution in Advanced Fiber Composites Using Carbon Nanotube Networks. Nanotechnology 2008, 19 (21), 215713. [DOI] [PubMed] [Google Scholar]
- (15).Gao L; Thostenson ET; Zhang Z; Byun J-H; Chou T-W Damage Monitoring in Fiber-Reinforced Composites under Fatigue Loading Using Carbon Nanotube Networks. Philos. Mag 2010, 90, 4085–4099. [Google Scholar]
- (16).Allaoui A; El Bounia N How Carbon Nanotubes Affect the Cure Kinetics and Glass Transition Temperature of Their Epoxy Composites? - A Review. eXPRESS Polym. Lett 2009, 3 (9), 588–594. [Google Scholar]
- (17).Saeb MR; Bakhshandeh E; Khonakdar HA; Mader E; Scheffler C; Heinrich G Cure Kinetics of Epoxy Nanocomposites Affected by MWCNTs Functionalization: A Review. Sci. World J 2013, 2013, 1. [DOI] [PMC free article] [PubMed] [Google Scholar]
- (18).Khare KS; Khabaz F; Khare R Effect of Carbon Nanotube Functionalization on Mechanical and Thermal Properties of Cross-Linked Epoxy-Carbon Nanotube Nanocomposites: Role of Strengthening the Interfacial Interactions. ACS Appl. Mater. Interfaces 2014, 6 (9), 6098–6110. [DOI] [PubMed] [Google Scholar]
- (19).Yang K; Gu M; Jin Y Cure Behavior and Thermal Stability Analysis of Multiwalled Carbon Nanotube/Epoxy Resin Nanocomposites. J. Appl. Polym. Sci 2008, 110 (5), 2980–2988. [Google Scholar]
- (20).Wang M; Pramoda KP; Goh SH Enhancement of Interfacial Adhesion and Dynamic Mechanical Properties of Poly-(Methyl Methacrylate)/Multiwalled Carbon Nanotube Composites with Amine-Terminated Poly(Ethylene Oxide). Carbon 2006, 44 (4), 613–617. [Google Scholar]
- (21).Eitan A; Fisher FT; Andrews R; Brinson LC; Schadler LS Reinforcement Mechanisms in MWCNT-Filled Polycarbonate. Compos. Sci. Technol 2006, 66 (9), 1162. [Google Scholar]
- (22).Abdalla M; Dean D; Adibempe D; Nyairo E; Robinson P; Thompson G The Effect of Interfacial Chemistry on Molecular Mobility and Morphology of Multiwalled Carbon Nanotubes Epoxy Nanocomposite. Polymer 2007, 48 (19), 5662–5670. [Google Scholar]
- (23).Chen W; Lu H; Nutt SR The Influence of Functionalized MWCNT Reinforcement on the Thermomechanical Properties and Morphology of Epoxy Nanocomposites. Compos. Sci. Technol 2008, 68 (12), 2535–2542. [Google Scholar]
- (24).Rahman MM; Zainuddin S; Hosur MV; Malone JE; Salam MBA; Kumar A; Jeelani S Improvements in Mechanical and Thermomechanical Properties of e-Glass/Epoxy Composites Using Amino Functionalized MWCNTs. Compos. Struct 2012, 94 (8), 2397–2406. [Google Scholar]
- (25).González-Domínguez JM; Díez-Pascual AM; Ansón-Casaos A; Gómez-Fatou MA; Martínez MT Epoxy Composites with Covalently Anchored Amino-Functionalized SWNTs: Towards the Tailoring of Physical Properties through Targeted Functionalization. J. Mater. Chem 2011, 21 (38), 14948. [Google Scholar]
- (26).Gojny FH; Schulte K Functionalisation Effect on the Thermomechanical Behaviour of Multi-Wall Carbon Nanotube/Epoxy-Composites. Compos. Sci. Technol 2004, 64 (15), 2303–2308. [Google Scholar]
- (27).Yoonessi M; Lebrón-Colón M; Scheiman D; Meador MA Carbon Nanotube Epoxy Nanocomposites: The Effects of Interfacial Modifications on the Dynamic Mechanical Properties of the Nanocomposites. ACS Appl. Mater. Interfaces 2014, 6 (19), 16621–16630. [DOI] [PubMed] [Google Scholar]
- (28).Jin F-L; Ma C-J; Park S-J Thermal and Mechanical Interfacial Properties of Epoxy Composites Based on Functionalized Carbon Nanotubes. Mater. Sci. Eng., A 2011, 528 (29), 8517–8522. [Google Scholar]
- (29).Špitalský Z; Matějka L; Šlouf M; Konyushenko EN; Kovářová J; Zemek J; Kotek J Modification of Carbon Nanotubes and Its Effect on Properties of Carbon Nanotube/Epoxy Nanocomposites. Polym. Compos 2009, 30 (10), 1378–1387. [Google Scholar]
- (30).Wang S; Liang Z; Liu T; Wang B; Zhang C Effective Amino-Functionalization of Carbon Nanotubes for Reinforcing Epoxy Polymer Composites. Nanotechnology 2006, 17 (6), 1551–1557. [DOI] [PubMed] [Google Scholar]
- (31).Sun L; Warren GL; O’Reilly JY; Everett WN; Lee SM; Davis D; Lagoudas D; Sue HJ Mechanical Properties of Surface-Functionalized SWCNT/Epoxy Composites. Carbon 2008, 46 (2), 320–328. [Google Scholar]
- (32).Ma PC; Siddiqui NA; Marom G; Kim JK Dispersion and Functionalization of Carbon Nanotubes for Polymer-Based Nanocomposites: A Review. Composites, Part A 2010, 41 (10), 1345–1367. [Google Scholar]
- (33).Rausch J; Mäder E Health Monitoring in Continuous Glass Fibre Reinforced Thermoplastics: Tailored Sensitivity and Cyclic Loading of CNT-Based Interphase Sensors. Compos. Sci. Technol 2010, 70 (13), 2023–2030. [Google Scholar]
- (34).Song YS; Youn JR Influence of Dispersion States of Carbon Nanotubes on Physical Properties of Epoxy Nanocomposites. Carbon 2005, 43 (7), 1378–1385. [Google Scholar]
- (35).Tao R; Simon SL Bulk and Shear Rheology of Silica/Polystyrene Nanocomposite: Reinforcement and Dynamics. J. Polym. Sci., Part B: Polym. Phys 2015, 53 (9), 621–632. [Google Scholar]
- (36).The full description of the procedures used in this paper requires the identification of certain commercial products and their suppliers. The inclusion of such information should in no way be construed as indicating that such products or suppliers are endorsed by NIST or are recommended by NIST or that they are necessarily the best materials, instruments, software or suppliers for the purposes described.
- (37).Badrinarayanan P; Zheng W; Li Q; Simon SL The Glass Transition Temperature versus the Fictive Temperature. J. Non-Cryst. Solids 2007, 353 (26), 2603–2612. [Google Scholar]
- (38).Moynihan CT; Easteal AJ; De Bolt MA; Tucker J Dependence of the Fictive Temperature of Glass on Cooling Rate. J. Am. Ceram. Soc 1976, 59 (1–2), 12–16. [Google Scholar]
- (39).Struik LCE Physical Aging in Plastic and Other Glassy Materials. Polym. Eng. Sci 1977, 17 (3), 165–173. [Google Scholar]
- (40).Dessi C; Tsibidis GD; Vlassopoulos D; De Corato M; Trofa M; D’Avino G; Maffettone PL; Coppola S Analysis of Dynamic Mechanical Response in Torsion. J. Rheol 2016, 60 (2), 275–287. [Google Scholar]
- (41).Kline SR Reduction and Analysis of SANS and USANS Data Using IGOR Pro. J. Appl. Crystallogr 2006, 39 (6), 895–900. [Google Scholar]
- (42).Meyer A; Dimeo RM; Gehring PM; Neumann DA The High-Flux Backscattering Spectrometer at the NIST Center for Neutron Research. Rev. Sci. Instrum 2003, 74 (5), 2759–2777. [Google Scholar]
- (43).Jean YC; Van Horn JD; Hung WS; Lee KR Perspective of Positron Annihilation Spectroscopy in Polymers. Macromolecules 2013, 46 (18), 7133–7145. [Google Scholar]
- (44).Dale J; Hulett L; Rosseel T; Fellers J A Positron Annihilation Spectroscopy Study of Carbon-Epoxy Composites. J. Appl. Polym. Sci 1987, 33 (8), 3055–3067. [Google Scholar]
- (45).Eldrup M; Lightbody D; Sherwood JN The Temperature Dependence of Positron Lifetimes in Solid Pivalic Acid. Chem. Phys 1981, 63, 51–58. [Google Scholar]
- (46).Howarter JA; Liu M; McDonough WG; Soles C; Holmes GA Nanostructural Evidence of Mechanical Aging and Performance Loss in Ballistic Fibers. J. Polym. Sci., Part B: Polym. Phys 2017, 55 (23), 1711–1717. [Google Scholar]
- (47).McGuire S; Keeble DJ Positron Lifetime and Implantation in Kapton. J. Phys. D: Appl. Phys 2006, 39 (15), 3388–3393. [Google Scholar]
- (48).Mostgaard M; Kirkegaard P; Olsen JV; Eldrup M PALSfit3: A Software Package for Analysing Positron Lifetime Spectra A Software Package for Analysing Positron Lifetime Spectra; 2017; Vol. 2016. [Google Scholar]
- (49).Astley OM; Donald AM A Small-Angle X-Ray Scattering Study of the Effect of Hydration on the Microstructure of Flax Fibers. Biomacromolecules 2001, 2 (3), 672–680. [DOI] [PubMed] [Google Scholar]
- (50).Hunston DL; Carter WT; Rushford JL Linear Viscoelastic Properties of Solid Polymers as Modelled by a Simple Epoxy In Developments in Adhesives -2; Kinloch AJ, Ed.; Applied Science Publishers Ltd: London and Englewood, NJ, 1981, pp 125–172. [Google Scholar]
- (51).Li Q; Hutcheson SA; McKenna GB; Simon SL Viscoelastic Properties and Residual Stresses in Polyhedral Oligomeric Silsesquioxane-Reinforced Epoxy Matrices. J. Polym. Sci., Part B: Polym. Phys 2008, 46 (24), 2719–2732. [Google Scholar]
- (52).Akay M Aspects of Dynamic Mechanical Analysis in Polymeric Composites. Compos. Sci. Technol 1993, 47 (4), 419–423. [Google Scholar]
- (53).Duc F; Bourban PE; Plummer CJG; Månson JAE Damping of Thermoset and Thermoplastic Flax Fibre Composites. Composites, Part A 2014, 64, 115–123. [Google Scholar]
- (54).Chin J; Hunston DL; Forster A Thermo-Viscoelastic Analysis of Ambient Cure Epoxy Adhesives Used in Construction Applications; NISTIR 7429, 2008. [Google Scholar]
- (55).Ferry JD Viscoelastic Properties of Polymers, 3rd ed.; Wiley: 1980. [Google Scholar]
- (56).Liu L; Etika KC; Liao KS; Hess LA; Bergbreiter DE; Grunlan JC Comparison of Covalently and Noncovalently Functionalized Carbon Nanotubes in Epoxy. Macromol. Rapid Commun. 2009, 30 (8), 627–632. [DOI] [PubMed] [Google Scholar]
- (57).Montazeri A The Effect of Functionalization on the Viscoelastic Behavior of Multi-Wall Carbon Nanotube/Epoxy Composites. Mater. Eng 2013, 45, 510–517. [Google Scholar]
- (58).Chiang C-H; Koenig JL Chemical Reactions Occurring at the Interface of Epoxy Matrix and Aminosilane Coupling Agents in Fiber-reinforced Composites. Polym. Compos 1980, 1 (2), 88–92. [Google Scholar]
- (59).Fisher FT; Eitan A; Andrews R; Schadler LS; Brinson LC Spectral Response and Effective Viscoelastic Properties of MWNT Reinforced Polycarbonate. Adv. Compos. Lett 2004, 13 (2), 105–112. [Google Scholar]
- (60).Winter HH; Mours M The Cyber Infrastructure Initiative for Rheology. Rheol. Acta 2006, 45 (4), 331–338. [Google Scholar]
- (61).Baumgaertel M; Winter HH Determination of Relaxation and Retardation Spectra from Dynamical Mechanical Data. Rheol. Acta 1989, 28, 511–519. [Google Scholar]
- (62).O’Brien DJ; Mather PT; White SR Viscoelastic Properties of an Epoxy Resin during Cure. J. Compos. Mater 2001, 35 (10), 883–904. [Google Scholar]
- (63).Palmese GR; McCullough RL Effect of Epoxy-Amine Stoichiometry on Cured Resin Material Properties. J. Appl. Polym. Sci 1992, 46 (10), 1863–1873. [Google Scholar]
- (64).Fernández-Francos X; Ramis X Structural Analysis of the Curing of Epoxy Thermosets Crosslinked with Hyperbranched Poly(Ethyleneimine)s. Eur. Polym. J 2015, 70, 286–305. [Google Scholar]
- (65).Elmahdy MM; Chrissopoulou K; Afratis A; Floudas G; Anastasiadis SH Effect of Confinement on Polymer Segmental Motion and Ion Mobility in PEO/Layered Silicate Nanocomposites. Macromolecules 2006, 39 (16), 5170–5173. [Google Scholar]
- (66).Bansal A; Yang H; Li C; Cho K; Benicewicz BC; Kumar SK; Schadler LS Quantitative Equivalence between Polymer Nanocomposites and Thin Polymer Films. Nat. Mater 2005, 4 (9), 693–698. [DOI] [PubMed] [Google Scholar]
- (67).Bee M Quasielastic Neutron Scattering; Adam Hilger: London, 1988. [Google Scholar]
- (68).Frick AB; Richter D The Glass from of the Microscopic Basis in Polymers Transition Studies Scattering Neutron. Adv. Sci 2010, 267 (5206), 1939–1945. [DOI] [PubMed] [Google Scholar]
- (69).Munirathnamma LM; Ravikumar HB Microstructural Characterization of Short Glass Fibre Reinforced Polyethersulfone Composites. J. Appl. Polym. Sci 2016, 133 (32), 1–10. [Google Scholar]
- (70).Moll J; Kumar SK Glass Transitions in Highly Attractive Highly Filled Polymer Nanocomposites. Macromolecules 2012, 45 (2), 1131–1135. [Google Scholar]
Associated Data
This section collects any data citations, data availability statements, or supplementary materials included in this article.