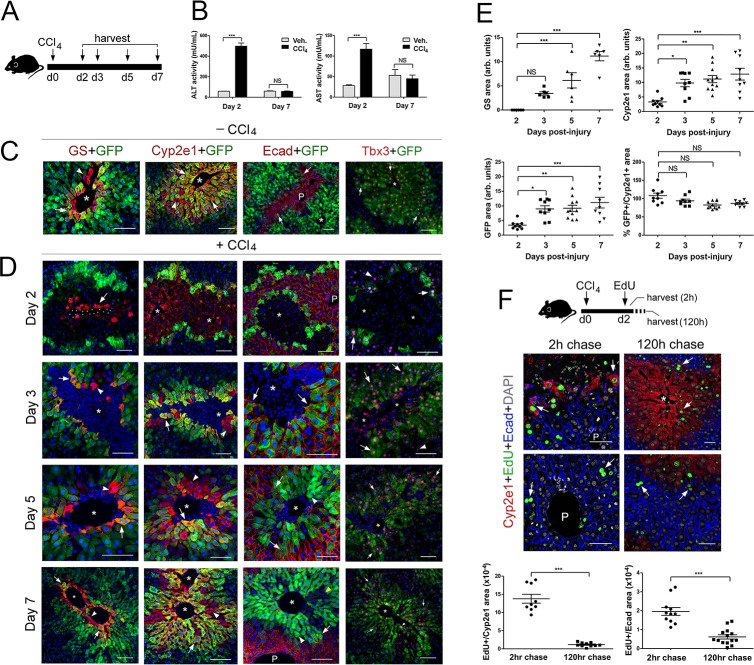
Figure 4. Proliferation and not de novo expression restore Claudin-2+ and Cyp2e1+ hepatocytes in the CCl4-injured liver.
(A) Experimental strategy for Cldn2-EGFP mice injected with CCl4. (B) ALT/AST serum levels demonstrate liver damage 2 days post-CCl4 (n = 3). p values were determined by two-way ANOVA, NS, not significant (p>0.05), ***p<0.001. (C) Expression of Zone 3 (GS+), Zone 2/3 (Cyp2e1+, claudin-2/GFP+) and Zone 1 (Ecad+) markers and Tbx3 in the corn oil-injected Cldn2-EGFP adult liver. (D) Spatial distribution of the markers indicated above during the recovery phase that follows a CCl4 bolus (see text for details). (Day 2, arrow, enucleated GS+ cell. Days 3–7, arrows, GFP double-positive hepatocytes; arrowheads, GFP– hepatocytes. Asterisks indicate central vein lumens.) (E) Quantification of GS+, Cyp2e1+ and claudin-2/GFP+ areas, and the GFP+/Cyp2e1+ ratio, 2–7 days post-CCl4. 3–4 representative fields from three individual livers dissected at the indicated time points were used for quantification. p values were determined by one-way ANOVA with Bonferroni’s multiple comparisons test, NS, not significant (p>0.05), *p<0.05, **p<0.01, ***p<0.001. (F) (Top) Schematic of EdU administration and tissue harvesting post-CCl4. (Middle) Immunofluorescence results show EdU incorporation (arrows) in Cyp2e1+ hepatocytes located in the Zone 2 remnant and the undamaged Zone 1 (Ecad+) 2 days post-CCl4. Both Cyp2e1+ hepatocytes (arrows, top) and Ecad+ hepatocytes located at the margins of restored Zone 2 (arrows, bottom) retain the EdU label after a 5 day chase. (Bottom) Quantification of EdU+ hepatocytes in Zone 2/3 and Zone 1. 3–4 representative fields from three individual livers dissected at the indicated time points were used for quantification. p values were determined by two-tailed unpaired Student’s t-test, ***p<0.001. (C,D,F) asterisks and dots indicate central vein lumens and images are from 3 to 4 individual livers. (B, F) n = 3. NS, not significant (p>0.05), *p<0.05, **p<0.01, ***p<0.001. P, portal veins. Scale bars: 100 μm (C, D) and 50 μm (F). Related data can be found in Figure 4—figure supplements 1 and 2.
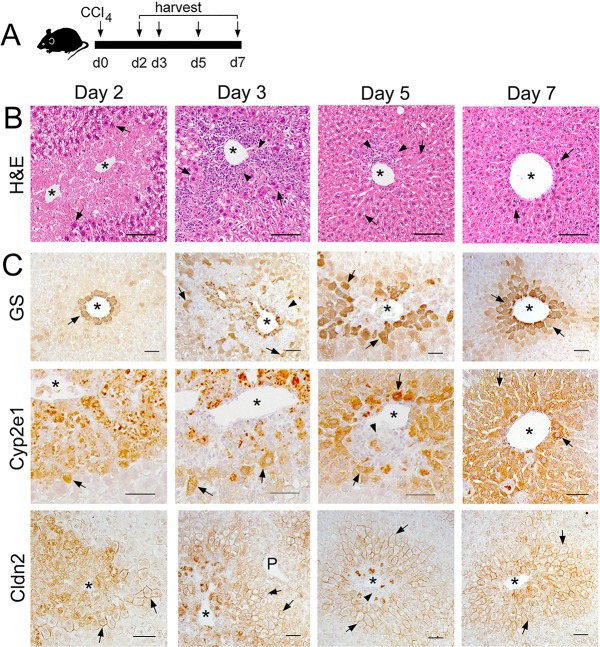
Figure 4—figure supplement 1. Changes in liver histology and Zone 2/3 protein expression after a CCl4 bolus.
Figure 4—figure supplement 2. Sox9+ hepatocytes do not contribute to Zone 2/3 restoration after CCl4 induced acute liver injury.


