

Abstract
STUDY QUESTION
Is the age of onset of pubertal markers related to subsequent changes in DNA methylation (DNAm)?
SUMMARY ANSWER
We identified 273 cytosine-phosphate-guanine (CpG) dinucleotides in girls and 67 CpGs in boys that were related to puberty and that were replicable in two other investigations.
WHAT IS KNOWN ALREADY
Previously, 457 CpGs (not gender-specific) and 347 (in girls) and 50 (in boys), respectively, were found to be associated with puberty, according to investigations of studies from Denmark (20 girls and 31 boys) and North America (30 girls and 25 boys).
STUDY DESIGN, SIZE, DURATION
The study was based on a birth cohort of 1456 participants born in 1989/90, with follow-up at age 10 and 18 years.
PARTICIPANTS/MATERIALS, SETTING, METHODS
The follow-up included 470 participants with information on DNAm and age of pubertal onset (244 girls and 226 boys). Age of pubertal onset was ascertained retrospectively at age 18 years. Using the Pubertal Development Scale, both genders were asked about ages of onset of growth spurt, body hair growth and skin changes. Ages at voice deepening and growth of facial hair were inquired from boys; ages at breast development and menarche from girls. Blood samples were collected at 10 and 18 years of age. DNA was extracted using a standard salting out procedure. The methylation level for each CpG site was assessed using one of two different platforms. DNAm was measured by a ratio of intensities denoted as β values for each CpG site. After quality control, 349 455 CpG sites were available for analysis. M values were calculated (log2(β/(1−β)) to approximate a normal distribution, and their levels were adjusted for blood cell proportions. Linear mixed models were applied to test the association between age of pubertal markers and repeated measurement of DNAm at 10 and 18 years.
MAIN RESULTS AND THE ROLE OF CHANCE
In girls, a total of 63 019 CpGs statistically significantly changed after occurrence of any of the five pubertal events and 13 487 were changed subsequent to all five events: the respective number is boys were 3072 and 301. To further exclude false-positive findings, we investigated which CpGs were replicable in prior studies from Denmark or North America, resulting in 273 replicable CpG in girls and 67 CpGs in boys (236 and 68 genes, respectively). Most identified genes are known to be related to biological processes of puberty; however, genetic polymorphisms of only four of these genes were previously linked to pubertal markers in humans.
LIMITATIONS, REASONS FOR CAUTION
The relative age of pubertal onset to the age of DNAm measurements does not allow causal inference, since DNAm at an earlier age may have affected the pubertal age or pubertal age may have altered later DNAm. This investigation concentrates on autosomes. CpGs on X and Y chromosomes are not included in the current study.
WIDER IMPLICATIONS OF THE FINDINGS
Assessment of biological processes involved in pubertal transitions should include epigenetic information. Differential DNAm related to puberty needs to be investigated to determine whether it can act as an early marker for adult diseases known to be associated with puberty.
STUDY FUNDING/COMPETING INTEREST(S)
This work was supported by NIH grants R03HD092776 (Epigenetic characterization of pubertal transitions) and R01AI121226. The 10-year follow-up of this study was funded by National Asthma Campaign, UK (Grant No 364), and the 18-year follow-up by a grant from the National Heart and Blood Institute (R01 HL082925). The authors have no conflicts to report.
Keywords: puberty, epigenetics, gender, DNA methylation, birth cohort, Pubertal Development Scale
WHAT DOES THIS MEAN FOR PATIENTS?
In girls and boys, puberty shows up with a variety of signs such as menstrual bleeding, growth spurt, facial and body hair growth, deepening of the voice and breast development. Age at puberty is also related to many medical conditions occurring later in life such as asthma, obesity, cardiovascular diseases and cancer. To identify biological indicators of puberty that could be used for early detection of such medical risks, the researchers investigated DNA-methylation.
DNA-methylation describes a change made to the DNA in genes that does not involve alterations to the DNA sequence itself (epigenetics). Methyl groups are either added to or removed from the DNA, which then alter the function of genes. The researchers explored whether genome-wide changes of DNA methylation between the age of 10 and 18 years can be linked to age of onset of different pubertal events. To this end, the researchers used a large number of children born on the Isle of Wight in the UK (244 girls and 226 boys at either age 10 or 18 years). To exclude false-positive findings, the researchers then checked which DNA-methylation changes had also been found in earlier, smaller studies from Denmark and North America.
The researchers identified 273 DNA-methylation changes in girls and 67 in boys that had also been found in earlier studies, covering 236 and 68 genes, respectively. Most of the genes identified are related to biological processes of puberty; however, in genetic studies only four of the identified genes had previously been linked to pubertal markers in humans. This novel epigenetic information will be used in future studies to investigate which of these markers are risk factors for adult medical conditions and whether they be altered in order to reduce the risk of disease.
Introduction
Puberty is defined as a series of biological and physical transformations initiated by central activation of the hypothalamic–pituitary–gonadal axis (Dorn and Biro, 2011). Pulsatile release of GnRH signals the pituitary gland to secrete the gonadotrophins LH and FSH, and testosterone in females and males, respectively, which trigger the development of secondary sexual characteristics. Age at pubertal onset has been related to a wide variety of conditions including asthma, overweight and obesity, metabolic changes, blood pressure, cardiovascular diseases, stroke, type 2 diabetes, cancer, mortality and psychological well-being in women (Hsieh et al., 1990; de Ridder et al., 1992; van Lenthe et al., 1996; Guo et al., 1997; Remsberg et al., 2005; Varraso et al., 2005; Jacobsen et al., 2007; Mendle et al., 2007; Jacobsen et al., 2009; Lakshman et al., 2009; Baek et al., 2015; Gomes et al., 2015; Ryu et al., 2015; Chang et al., 2016; Gemelli et al., 2016; Yoo, 2016; He et al., 2017; Li et al., 2017; Platt et al., 2017; Yang et al., 2017), men (Hardy et al., 2006; Maule et al., 2012; Mendle and Ferrero, 2012; Ong et al., 2012; Platt et al., 2017) or both sexes (Hardy et al., 2006; Day et al., 2015; Mahmoud et al., 2018).
One potential factor regulating the timing of pubertal onset is DNA methylation (DNAm) (Demetriou et al., 2013; Lomniczi and Ojeda, 2016), which is considered to serve as an archive of markers of early developmental exposures, such as maternal smoking. In addition, DNAm may also change as a consequence of pubertal onset and in turn may affect adult diseases. Methylation is a dynamic process of addition of methyl groups to cytosine where cytosine–phosphate–guanine (CpG) dinucleotides occur in the DNA sequence, while demethylation occurs both actively and passively (Chen and Riggs, 2011). Methylation of gene promoter regions is considered to modulate gene expression (Shenker and Flanagan, 2012), but methylation occurring at other genomic regions (e.g. gene body, intergenic) may also influence transcription (Jones, 2012). DNAm also regulates alternative splicing (Oberdoerffer, 2012; Lev Maor et al., 2015), which results in different messenger RNAs and different biological functions (Black, 2003). In girls, precocious puberty has been found to be associated with both increased and decreased methylation levels of different genes (Bessa et al., 2018).
There is a need to better understand changes in DNAm following the onset of different pubertal markers such as menarche, thelarche, growth spurt and voice deepening. Hence, a first step is to explore which CpGs can be linked with age of onset of different pubertal events. Two recent longitudinal cohort studies using epigenome-wide analyses investigated associations between puberty timing and DNAm (Almstrup et al., 2016; Thompson et al., 2018). The first study included healthy Danish children, 20 girls and 31 boys, who were examined twice including measurements of DNAm before and after achievement of pubertal Tanner state B2 (Marshall and Tanner, 1969; Marshall and Tanner, 1970). Testicular volume (≥4 ml) for boys and Tanner breast stage for girls (both indicating a Tanner state of B2 and higher) were utilized as a means of measuring pubertal stage for both genders separately (Almstrup et al., 2016). When boys and girls were analyzed together while adjusting for age and the different cell counts in analyzed blood samples, the Danish study identified 457 CpGs that changed as a consequence of onset of puberty with a false discovery rate (FDR) of 0.05. Associated methylation levels were either increased or decreased before and after pubertal events. A limitation of the Danish investigation is that the first measurement of DNAm was close to pubertal onset and thus methylation levels may already have been affected by the process of pubertal transition. The second study was based on 30 girls and 25 boys from North America with DNAm measured at 8 and 14 years of age (Thompson et al., 2018). Puberty was assessed at both ages by Tanner staging. With separate analyses of girls and boys, the study identified 347 CpGs in girls and 50 CpGs in boys that changed as a consequence of puberty. In addition, 48 differentially methylated CpGs were found in the combined sample of boys and girls. The Thompson et al. (2018) study did not adjust for age at sample collection or cell composition of the samples drawn at 8 and 14 years. Thus, some DNAm changes could be related to aging but not pubertal changes. Moreover, not adjusting for cell composition, which is likely to change between 8 and 14 years, may have led to some CpGs remaining undetected.
Since age at menarche is not part of the Tanner’s Sexual Maturation Scale (Marshall and Tanner, 1969; Marshall and Tanner, 1970), information on age at menarche, a frequently used indicator of puberty in girls (James et al., 2018), also in genetic studies (Elks et al., 2010; Perry et al., 2014; Willemsen and Dunger, 2016), was not assessed in the above investigations. As genome-wide associations explain only 2.7% of the variance of age at menarche (Perry et al., 2014), it is important to explore whether DNAm could be associated with age at menarche.
We previously investigated variables collected by the Pubertal Development Scale (PDS) (Petersen et al., 1988) for association with child growth (Yousefi et al., 2013). In this study, based on a larger birth cohort of children born on the Isle of Wight (IoW) in the UK (244 girls and 226 boys at either age 10 or 18 years), we investigated whether ages of pubertal events are associated with DNAm at 10 and 18 years. To this end, we used the age of onset of different pubertal events (Bond et al., 2006). Since puberty-related processes vary among girls and boys, we conducted separate analyses for both sexes and adjusted for age and cell composition of the DNAm collected at both ages, 10 and 18 years. We identified CpGs, and their respective genes, that are associated with age of different pubertal markers. In addition, we compared our findings with those published by Almstrup et al. (2016) and Thompson et al. (2018). Finally, we identified biological pathways represented by the genes whose CpGs gained statistical significance.
Materials and Methods
Data analyzed in this study were from a birth cohort composed of children born between 1 January 1989 and 28 February 1990 on the IoW, UK (Arshad et al., 2018). The IoW is a semi-rural island located close to the British mainland. Of the 1536 children born in this period, 1456 were recruited, and 1313 participated in both follow-ups at ages 10 and 18 years. In subsamples of these children, DNAm was measured at ages 10 and 18 years.
Assessment of puberty
The National Institute of Child and Human Development (NICHD) questionnaire from the Study of Early Child Care and Youth Development based on the PDS was used (Petersen et al., 1988). At age 18 years, children self-reported their development using five markers of pubertal growth. Both genders were asked about ages of onset of growth spurt, body hair growth and skin changes. Ages at voice deepening and growth of facial hair were inquired from boys, while ages at breast development and menarche were reported by girls. Since we asked 18-year-old participants, we focused on ages of onset which is a subpart of the five questions of the NICHD questionnaire (Yousefi et al., 2013). Ages at which pubertal events occurred were provided as years in whole numbers (i.e. age 13 years).
The varying ages of onset of a specific pubertal event provide unique pubertal timing information in relation to DNAm measurements. For instance, if a girl’s first period occurs at age 12 years, then DNAm measurement at age 10 is 2 years before onset of menarche; DNAm measurement at 18 years is 6 years later (Fig. 1). If another girl’s first period occurs at age 17 years, then DNAm measurement at age 10 and 18 is 7 years before and 1 year after, respectively (Fig. 1). Although DNAm was measured at the same chronological age, 10 and 18 years, the timing of puberty in relation to DNAm measurements of both girls is different (−2 and +6 in the first girl, −7 and +1 in the second). In our statistical analyses, we followed the approach by Almstrup et al. (2016) by using the difference in years of the age at methylation assessment and age at pubertal onset (Δyears) for identification of differential CpG methylation. For example, in our repeated measurement analysis, −2 and +6 were used as differences in time (Δyears) between DNAm measurement and onset of specific pubertal markers (Fig. 1). Using repeated DNAm measurements and their differences to pubertal age allowed us to integrate ages at pubertal events that occurred before the first DNAm measurement at age 10 years (e.g. when breast development started at age 8 years).
Figure 1.
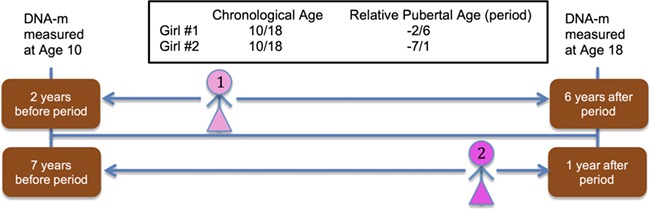
Examples of ages of pubertal onset, age at DNA-methylation measurements and time differences between pubertal onset and DNA-methylation assessment used in repeated measurement analyses (girl 1: −2, +6 years; girl 2: −7, +1 years).
DNA methylation analysis
Blood samples were collected at ages 10 and 18 years. DNA was extracted using a standard salting out procedure (Miller et al., 1988). DNA concentration was estimated by fluorometric quantitation. The methylation level for each CpG site was assessed using one of two platforms, the Illumina Infinium HumanMethylation450 BeadChip (Illumina, Inc., San Diego, CA, USA) or the Infinium MethylationEPIC BeadChip (Illumina, Inc., San Diego, CA, USA). For each sample, 1 μg of DNA was bisulfite-treated for cytosine to thymine conversion using the EZ-96 DNA methylation kit (Zymo Research, Irvine, CA, USA), following the manufacturer’s protocol. HumanMethylation450 BeadChip interrogates >484 000 CpGs and MethylationEPIC BeadChip >850 000 CpGs, both associated with over 24 000 genes. Arrays were processed using a standard protocol (Bibikova and Fan, 2009) with multiple identical control samples assigned to each bisulfite conversion batch to assess array variability. DNA samples were randomly distributed on the arrays, aiming to eliminate batch effects. DNAm was measured by a ratio of intensities, denoted as β values for each CpG site, which is a ratio of methylated (M) over the sum of methylated and unmethylated (U) probes (β = M/[c + M + U]), where c is used as a constant to prevent zero in the denominator. M values were calculated via log2(β/(1−β)), which better approximate a normal distribution.
Methylation data at age 10 and 18 years
Quality control was undertaken and quantile normalized beta values were processed following the CPACOR pipeline (Lehne et al., 2015) from a total of seven batches—two from 450K and five from the EPIC array platform (DNAm samples at 10 years) and six batches—two from 450K and four from the EPIC array platform (DNAm samples at age 18 years). These samples from different array platforms and batches were combined, and only the shared probes between EPIC and 450K arrays were included. In both the 10- and 18-year methylation data, the R package ComBat (Johnson et al., 2007) was used to remove the batch effect in the combined dataset. CpG sites with probe-single nucleotide polymorphisms within 10 base pairs and with a minor allele frequency greater than 0.007 in the Caucasian population (which represented ~10 subjects expected in the sample of this study cohort) were excluded. In total, 349 455 CpG sites from a total 470 participants (n = 322 at age 10 and n = 465 at age 18 years) with pubertal information were available for analysis.
Cell type proportions
The estimateCellCounts() function from the Minfi package (Aryee et al., 2014) using the adult reference panel (Reinius et al., 2012) and the method by Houseman et al. (2012) and Jaffe and Irizarry (2014) was utilized to estimate cell proportions for each sample at each age (10 and 18 years). White blood cell counts (CD4T, CD8T, natural killer cells, B cells, monocytes, granulocytes and eosinophils) were estimated using DNAm data of separate platforms (450 k and EPIC) and then combined.
Analytical design
Using epigenome-wide DNAm data to identify differentially methylated CpGs that were associated with the onset of the five pubertal events, we applied linear mixed models with repeated methylation measurements of individual CpGs (dependent variable) determined at age 10 (n = 322) and 18 years (n = 465). Following Almstrup’s approach (Almstrup et al., 2016), the differences in years between the age of puberty onset and the age of DNAm measurements (Fig. 1) were used as independent variables (Δyears). Analyses were run separately for girls and boys. The analysis was not restricted to paired data (DNAm measured at 10 and 18 years), since missing DNAm data at one age does not result in exclusion of observations in linear mixed models. To adjust for methylation changes that are simply due to the chronological age, the methylation of 349 455 CpGs was first regressed on age of DNAm measurement using M values. Then, the residual methylations not explained by age were regressed in the linear mixed models on differences in years (Δyears). For each pubertal event (body hair growth, breast growth, menarche, skin changes and growth spurt in girls and body hair growth, facial hair growth, voice deepening, skin changes and growth spurt in boys), the residual methylations and Δyears were modeled as follows:
 |
where  is the residual methylations of the ith individual at the jth time point (i.e. age 10 and 18 years) after regression out of chronological age of DNAm measurements,
  is the random intercept for each subject in the repeated measurement model with
  ;
;  represents Δyears of the ith individual at the jth time point;
  ’s are covariates such as cell proportions;
  represents the Δyears’ effect on the residual of the DNAm for a pubertal event;
  is the error term. To adjust for cell composition at each period (age 10 and age 18 years), cell proportions were added into the model as covariates. To prevent a large proportion of false positives (Benjamini and Hochberg, 1995) resulting from 349 455 tests and a P value on 0.05, we controlled for the FDR to correct for multiple tests. P values of the genome-wide association studies, stratified by gender, are illustrated using Manhattan plots. Volcano plots were used to show the extent of positive or negative associations between methylation of CpGs and Δyears. Next, findings were compared with those of a Danish and a North American study (Almstrup et al., 2016; Thompson et al., 2018). Among the 453 CpGs provided by Almstrup et al. (personal communication), 389 were found among the 349 455 CpGs in the IoW cohort. Thompson et al. (2018) identified 347 CpGs in girls and 50 in boys, of which 288 for girls and 43 for boys were available for analysis in the IoW dataset. The analyses were performed using the R package (Vienna, Austria) and SAS version 9.4 (Cary, NC, USA). Finally, we investigated biological pathways for the genes of those CpGs that were replicated in either study, using the ToppFun server (http://toppgene.cchmc.org/enrichment.jsp) (Chen et al., 2009) as a functional annotation tool. To this end, we first annotated the CpGs to their corresponding gene names by using the Infinium MethylationEPIC v1.0 B4 Manifest File. We found the nearest gene names using Snipper v1.2 (https://csg.sph.umich.edu/boehnke/snipper/) for the CpGs that had no gene names in the EPIC manifest file.
Results
With respect to sex and socioeconomic status, there was no statistically significant difference between the 1313 offspring who were followed up at age 18 years and the 470 adolescents who had information on both ages at pubertal events and DNAm at age 10 or 18 years. (Table I).
Table I.
Comparison of all participants in the Isle of Wight birth cohort at 18 years and those with information on age of pubertal onset and DNA methylation at 10 or 18 years.
| Variable | Total sample at age 18 years (n = 1313), % | Sample with puberty data and DNA methylation (n = 470), % | P value chi-square test |
|---|---|---|---|
| Sex (girls) | 50.3 | 51.9 | 0.37 |
| Socioeconomic status of the parents | 0.87 | ||
| Low | 14.4 | 15.0 | |
| Medium | 77.3 | 76.5 | |
| High | 8.4 | 8.5 | |
| Participation at age 18 yrs | <0.0001 | ||
| In person | 65.8 | 97.7 | |
| By telephone | 32.1 | 2.3 | |
| By mail | 2.1 | 0 | |
| Still in education at age 18 years | 69.8 | 77.9 | <0.0001 |
At age 18 years, puberty information was collected from subjects through in-person visits (843 of 864, 97.6% provided puberty information), telephone interviews (391/421, 92.9% with puberty information) or mailed questionnaires (27/28, 96.4% with puberty information). Of the 470 participants with pubertal and DNAm information at ages 10 or 18 years, 226 were boys and 244 were girls. In total, 322 participants had pubertal information and DNAm at age 10 years, and 465 at age 18 years. In girls, ages at menarche, breast growth and body hair growth were recalled by most participants (Table II). In boys, ages at facial hair growth and deepening of the voice were questions with a larger number of recalls. Regarding growth spurt, body hair growth and skin change, girls started about 1 year earlier than their male counterparts. The ages of onset of different puberty events were significantly correlated among boys and girls. All puberty variables had high internal consistency; the overall raw Cronbach’s alpha coefficient was 0.80 in boys and 0.86 in girls (Yousefi et al., 2013).
Table II.
Age of onset of pubertal events in girls and boys.
| Observations with methylation at age 10 or 18 years (n) | Mean (years) | Median (years) | SD | Minimum (years) | Maximum (years) | ||
|---|---|---|---|---|---|---|---|
| Girls | Growth spurt | 194 | 12.4 | 12 | 1.82 | 5 | 16 |
| Body hair growth | 230 | 12.2 | 12 | 1.45 | 7 | 16 | |
| Skin changes | 176 | 13.1 | 13 | 1.59 | 9 | 17 | |
| Breast growth | 230 | 12.3 | 12 | 1.59 | 8 | 16 | |
| Age at menarche | 237 | 12.3 | 13 | 1.36 | 9 | 17 | |
| Boys | Growth spurt | 204 | 13.5 | 14 | 1.65 | 7 | 16 |
| Body hair growth | 214 | 13.3 | 13 | 1.4 | 8 | 17 | |
| Skin changes | 179 | 13.9 | 14 | 1.3 | 10 | 18 | |
| Deepening of the voice | 218 | 14.1 | 14 | 1.2 | 10 | 17 | |
| Facial hair growth | 223 | 15.3 | 15 | 1.12 | 11 | 18 |
We identified more CpGs that were significantly changed related to age at puberty in girls than in boys (Figs 2 and 3). Almstrup et al. (2016) did not provide gender-specific CpGs associated with pubertal events; hence, we included the CpGs identified by them in the Manhattan plots of both sexes (Fig. 2). For girls, Fig. 2 shows that we determined more significantly associated CpGs than the two prior studies, in particular for P values of less than e−10. In boys, the Manhattan plot using the IoW data demonstrates more significant gender-specific CpGs than Thompson (blue triangles). Since Almstrup did not separate gender-specific associations, the red dots in the Manhattan plot for boys may present CpGs related to puberty in both genders.
Figure 2.
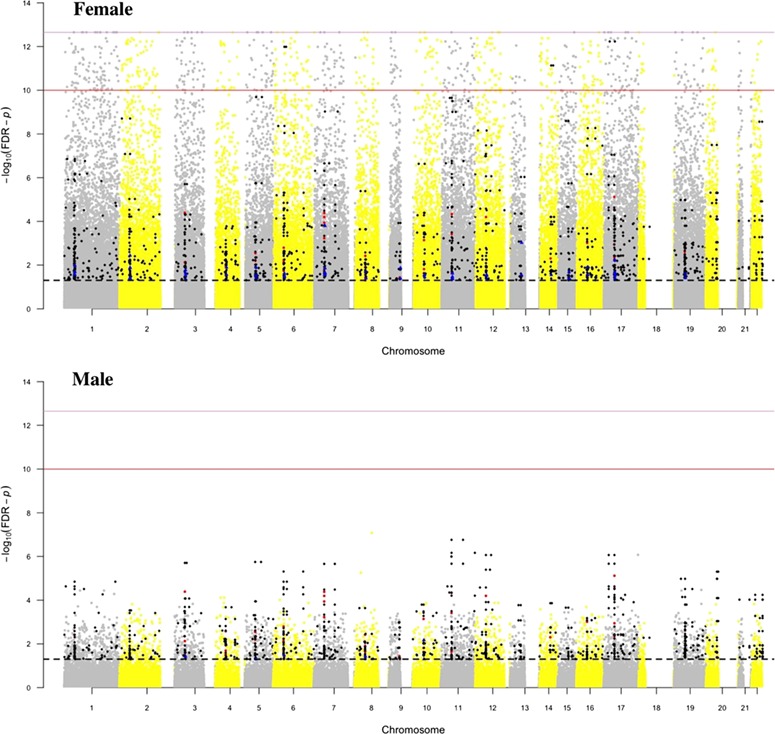
Manhattan plot of the CpGs related to age at pubertal onset. Manhattan plot shows the CpGs related to ages of pubertal onset in the Isle of Wight (IoW) birth cohort (gray and yellow dots) including a plot of the statistical significant CpGs determined in the IoW study replicated by Almstrup et al. (2016) or Thompson et al. (2018). The black diamonds in the Manhattan plot are the CpGs identified in the IoW study and replicated in either Almstrup et al. (2016) or Thompson et al. (2018). The red dots are CpGs identified as statistically significant by Almstrup et al. but not our study; the blue triangles were detected by Thompson et al. but not our study. The dashed black line represents a false discovery rate (FDR) P value of 0.05; the solid red line presents a P value of 1 e−10, and the solid violet line gives the lower limit of 2.44 e−13. The gray and yellow dots above the dashed black line characterize CpGs identified in the IoW study but not replicated by either Almstrup et al. or Thompson et al. (Almstrup et al., 2016, Thompson et al., 2018). Note: The negative log of adjusted P values on the Y-axis stretches the scale and makes it easier to visualize the significant CpGs.
Figure 3.
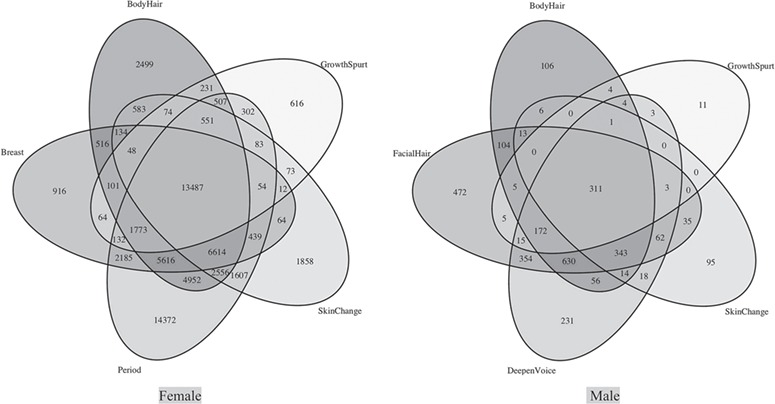
Venn diagram of the number of CpGs associated with changes at puberty. The diagram shows the number of CpGs associated with ages of changes of body hair, and skin, growth spurt, breast growth (girls), menarche (girls), facial hair (boy) and deepening of the voice (boy) at a FDR cut-off P value of 0.05 in boys and girls.
Separately for girl and boys, the Venn diagram (Fig. 3) characterizes CpG detected with a FDR P value <0.05 for each event and their overlap. In girls, a total of 63 019 CpGs changed related to any of the five pubertal ages and 13 487 were associated with all five ages. The number of CpGs that changed related to age at menarche is largest. Age at menarche also shows the largest overlap of detected CpGs with age at breast development, body hair growth and skin changes. In boys, the total and overlapping numbers of CpGs among the five pubertal events are 3072 and 311 CpGs, respectively, and are much smaller. The largest overlap in boys is seen for facial hair growth and deepening of the voice. In total, we identified more CpGs significantly related to any puberty event in girls than in boys (gray and yellow dots in Figs 2 and 3). To investigate overestimations of statistical significance due to inflation of test statistics in this epigenome-wide study, we used Q–Q plots and the genomic inflation factor (Hinrichs et al., 2009). Except for age at menarche (inflation factor = 1.13), all other inflation factors for the ages at pubertal events were below 1, indicating that all our reported findings were not inflated and no adjustment was necessary. Regarding age at menarche, an inflation factor of 1.13 indicates only a minor inflation of results.
Inspecting the directions of effects and strength of the regression coefficients using volcano plots shows that there are equal numbers of positive and negative effects of puberty on methylation in boys and girls (Supplementary Fig. S1). However, there are many more CpGs in girls strongly linked to Δyears than in boys. A positive coefficient between Δyears and DNAm at ages 10 or 18 years means that the puberty event is related to an increase in DNAm over time. A negative coefficient describes methylation levels that are higher prior to the experience of puberty and decrease thereafter. Supplementary Figs S2 and S3 each provide four examples, two CpGs for each gender, showing an increase and decrease in DNAm over Δyears, with and without adjustment for blood cell composition.
In total we tested 349 455 CpGs measured at 10 and 18 years of age (Table III). In the analysis, we used the distance of pubertal onsets relative to 10 and 18 years (Δyears) and residual DNAm (adjusted for age of DNA methylation measurements) and controlled for cell composition. Table III shows that the majority of statistically significant CpGs were associated with age of menarche (k = 55 230) in girls and facial hair growth in boys (k = 2524). In girls, 18% of all CpGs were statistically significantly associated with age of at least one pubertal event and 8.8% in boys (FDR P value ≤0.05). In girls, 3.9% of the CpGs showed a differential methylation for all five events, and 0.089% in boys. Almstrup et al. (2016) provided 453 statistically significant CpGs (FDR ≤ 0.05) from the combined samples of 51 boys and girls. After data cleaning, we found 389 of these CpGs in our list of 349 455 CpGs. In the sample of 55 North American adolescents, Thompson et al. (2018) reported 347 statistically significant CpGs in girls and 50 in boys, of which 288 CpGs in girls and 43 CpGs in boys, respectively, are available in our IoW data as shown in the flowchart (Fig. 4). Hence, for girls, the two previous studies provided 745 statistically significant CpGs, of which 629 CpGs are available in our IoW data (288 CpGs from Thompson et al. 2018 combined with 389 CpGs gender-unspecific CpGs from Almstrup et al., excluding those CpGs identified by both investigations). In boys, a total of 496 individual CpGs were detected by the two studies (Fig. 4), of which 425 CpGs are available in the IoW data (43 from Thompson et al. and 389 gender-unspecific CpGs from Almstrup et al., after excluding those CpGs identified by both investigations and those not available in the IoW data). Of these 629 and 425 in girls and boys, respectively, we detected 43.4 and 15.8% as statistically significant related to at least one pubertal event (Fig. 4).
Table III.
Number of CpGs significantly associated with pubertal events based on analysis of 349 455 CpGs.
| Sex | Age at: | Number of significant CpGs associated with each event | Number of CpGs significantly associated with at least one pubertal event (% of 349 455 CpGs) | Number of CpGs significantly associated with all five pubertal events (% of 349 455 CpGs) | Number of significant CpGs (at least one event) that overlapped with those detected by Almstrup et al. (2016) or Thompson et al. (2018) | Number of significant CpGs (all five events) that overlapped with those detected by Almstrup et al. (2016) or Thompson et al. (2018) |
|---|---|---|---|---|---|---|
| Girls | Growth spurt | 18 108 | 63 019 (18.0) | 13 487 (3.86) | 273 (43.4% of 629 CpGs detected by Almstrup or Thompson) | 112 (17.8% of 629 CpGs detected by Almstrup or Thompson) |
| Body hair growth | 40 242 | |||||
| Skin changes | 28 237 | |||||
| Breast growth | 32 155 | |||||
| Menarche | 55 230 | |||||
| Boys | Growth spurt | 534 | 3072 (8.8) | 311 (0.089) | 67 (15.8% of 425 CpGs detected by Almstrup or Thompson) | 10 (2.3% of 425 CpGs detected by Almstrup or Thompson) |
| Body hair growth | 1769 | |||||
| Skin change | 901 | |||||
| Deepening of the voice | 2217 | |||||
| Facial hair growth | 2524 |
Figure 4.
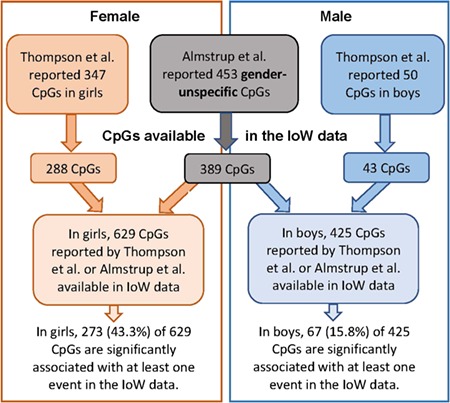
Flowchart of the replication approach addressing the number of available and statistically significant CpGs in three different studies, for girls and boys separately. The flow chart is for the present study, Thompson et al. (2018) and Almstrup et al. (2016).
Tables IV and V show the top 50 most significant and replicated CpGs associated with Δyears among the five pubertal events. The respective FDR-adjusted P value ranges from e−13 to e−5 in girls and from e−4 to 0.03 in boys. Supplementary Tables SI and SII provide all significant and replicated CpGs (273 CpGs in girls and 67 in boys) with details such as pubertal event and regression coefficients. In total, we identified 236 genes in girls and 68 genes in boys (at least one CpG was related to two gene names). The CpGs are almost evenly distributed across all chromosomes.
Table IV.
Fifty CpGs most significantly associated with  years of body hair growth, breast growth, menarche, skin changes and/or growth spurt in girls.
| CpG | Highest absolute t value | Smallest P value | P value after FDR adjustment | Chr | Gene name | MapInfo | UCSC ref gene group | Relation to UCSC CpG island |
|---|---|---|---|---|---|---|---|---|
| cg18369972 | 8.09 | 6.7E-16 | 5.9E-13 | 17 | GAS7 | 9 940 121 | Body; TSS200 | |
| cg09037630 | 7.99 | 1.3E-15 | 1.0E-12 | 6 | NFKBIL1 | 31 528 239 | ||
| cg08129129 | −7.71 | 1.3E-14 | 7.3E-12 | 14 | BCL11B | 99 714 031 | Body | S_Shore |
| cg02387618 | −7.19 | 6.4E-13 | 2.0E-10 | 5 | TCF7 | 133 453 480 | Body | S_Shelf |
| cg05895618 | 7.18 | 7.1E-13 | 2.3E-10 | 11 | CSRP3 | 19 222 395 | 5′UTR | |
| cg26207239 | −7.13 | 1.0E-12 | 3.1E-10 | 11 | BIRC2 | 102 231 936 | Body | |
| cg07168526 | 7.00 | 2.5E-12 | 9.4E-10 | 7 | ST7 | 116 797 907 | Body | |
| cg06881914 | 6.94 | 4.0E-12 | 9.8E-10 | 11 | MS4A6A | 59 951 663 | TSS1500 | |
| cg05087455 | 6.83 | 8.7E-12 | 2.0E-09 | 2 | RNF144A | 7 171 869 | Body | N_Shore |
| cg10403394 | 6.84 | 8.2E-12 | 2.6E-09 | 15 | TPM1 | 63 349 192 | Body | |
| cg03834031 | 6.82 | 8.9E-12 | 2.8E-09 | 22 | MIRLET7BHG | 46 465 717 | N_Shore | |
| cg09248660 | 6.70 | 2.1E-11 | 4.3E-09 | 6 | RIPOR2 | 24 969 848 | ||
| cg08059678 | −6.66 | 2.7E-11 | 5.4E-09 | 16 | VAC14 | 70 728 425 | Body | |
| cg23368715 | 6.62 | 3.7E-11 | 7.0E-09 | 12 | C1R | 7 245 510 | TSS1500 | |
| cg08486432 | −6.57 | 4.9E-11 | 9.0E-09 | 6 | ITPR3 | 33 598 003 | Body | N_Shelf |
| cg00259097 | −6.47 | 9.6E-11 | 1.6E-08 | 16 | VAC14 | 70 770 604 | Body | |
| cg24403644 | −6.36 | 2.1E-10 | 3.2E-08 | 20 | TOX2 | 42 574 624 | 5′UTR; Body; 1stExon |
|
| cg06740227 | 6.55 | 5.6E-11 | 3.3E-08 | 12 | RASSF9 | 86 229 804 | Body | |
| cg09437994 | −6.38 | 1.7E-10 | 3.4E-08 | 16 | CBFA2T3 | 89 035 147 | Body | S_Shore |
| cg15302376 | −6.19 | 6.1E-10 | 8.3E-08 | 2 | DNMT3A | 25 560 263 | 5′UTR | N_Shelf |
| cg27364319 | 6.19 | 6.1E-10 | 8.3E-08 | 12 | RARG | 53 626 837 | TSS1500 | S_Shore |
| cg01538166 | 6.21 | 5.3E-10 | 8.9E-08 | 17 | SREBF1 | 17 743 987 | Island | |
| cg22460123 | 6.15 | 8.0E-10 | 1.0E-07 | 12 | KRT7 | 52 638 294 | Body | N_Shore |
| cg03042633 | −6.09 | 1.1E-09 | 1.4E-07 | 1 | SKI | 2 183 365 | Body | |
| cg24681499 | −6.05 | 1.4E-09 | 1.7E-07 | 1 | FOXJ3 | 42 706 997 | Body | |
| cg00476955 | 6.05 | 1.5E-09 | 2.2E-07 | 11 | TRPC2 | 3 648 013 | Body | |
| cg03193328 | 6.01 | 1.9E-09 | 2.2E-07 | 7 | TPST1 | 65 746 852 | Body | |
| cg14215711 | 6.00 | 2.0E-09 | 2.3E-07 | 10 | PIP4K2A | 22 894 054 | Body | |
| cg27205928 | −5.86 | 4.7E-09 | 4.9E-07 | 7 | C7orf50 | 1 062 652 | Body | Island |
| cg09258479 | 5.84 | 5.2E-09 | 6.5E-07 | 1 | PDZK1IP1 | 47 655 861 | TSS200 | |
| cg26580413 | 5.80 | 6.6E-09 | 6.9E-07 | 16 | FTO | 54 025 348 | Body | |
| cg10104487 | 5.78 | 7.4E-09 | 7.1E-07 | 1 | TRNP1 | 27 329 335 | N_Shelf | |
| cg25936358 | 5.77 | 7.8E-09 | 9.3E-07 | 13 | ATP4B | 114 301 996 | N_Shore | |
| cg06437747 | 5.72 | 1.1E-08 | 1.2E-06 | 1 | ACTRT2 | 2 890 836 | S_Shelf | |
| cg14980020 | −5.65 | 1.6E-08 | 1.4E-06 | 1 | DCST2 | 154 992 262 | Body | S_Shelf |
| cg11442608 | 5.64 | 1.7E-08 | 1.8E-06 | 15 | CFAP161 | 81 456 832 | ||
| cg16335893 | −5.45 | 5.1E-08 | 3.8E-06 | 12 | MPHOSPH9 | 123 634 159 | N_Shore | |
| cg07396746 | 5.43 | 5.6E-08 | 4.1E-06 | 8 | LOXL2 | 23 162 295 | Body | |
| cg10566581 | −5.40 | 6.8E-08 | 4.9E-06 | 20 | TGIF2 | 35 220 415 | 3’UTR | |
| cg20770512 | 5.34 | 9.4E-08 | 6.3E-06 | 6 | GFOD1 | 13 396 094 | Body | |
| cg15626881 | 5.30 | 1.2E-07 | 9.3E-06 | 7 | BMPER | 33 923 464 | ||
| cg05584950 | 5.25 | 1.5E-07 | 9.5E-06 | 2 | ATOH8 | 86 012 847 | Body | |
| cg04586023 | 5.25 | 1.6E-07 | 1.2E-05 | 22 | HDAC10 | 50 690 380 | TSS1500 | S_Shore |
| cg01750375 | 5.21 | 1.9E-07 | 1.5E-05 | 20 | WISP2 | 43 343 365 | TSS1500 | |
| cg00374672 | 5.12 | 3.0E-07 | 1.7E-05 | 7 | SLC12A9 | 100 463 416 | Body | N_Shore |
| cg17220749 | −5.09 | 3.5E-07 | 1.9E-05 | 1 | GALNT2 | 230 249 292 | Body | |
| cg01282174 | 5.07 | 3.9E-07 | 2.1E-05 | 11 | PVRL1 | 119 630 144 | ||
| cg09492074 | 5.23 | 1.7E-07 | 2.2E-05 | 15 | MEGF11 | 66 263 624 | Body | |
| cg22740489 | 5.00 | 5.8E-07 | 3.0E-05 | 2 | LIMS3-LOC440895 | 110 706 159 | Body | S_Shore |
| cg18451156 | −4.99 | 6.2E-07 | 3.1E-05 | 12 | CHFR | 133 424 373 | Body |
*Since these CpGs represent the overlap of association with five events, the lowest P values identified for several outcomes is shown. UCSC: University of California Santa Cruz, Chr: chromosome, FDR: false discovery rate.
Table V.
Fifty CpGs most significantly associated with  years of body hair and facial hair growth, deepening of the voice, skin changes and/or growth spurt in boys.
| CpG | Highest t value among five events | Smallest P value | P value after FDR adjustment | Chr | Gene name | MapInfo | UCSC ref gene group | Relation to UCSC CpG island |
|---|---|---|---|---|---|---|---|---|
| cg16163419 | −5.70 | 1.2E-08 | 2.1E-04 | 3 | ABI3BP | 100 712 326 | 5′UTR; 1stExon |
|
| cg21899500 | 5.13 | 2.9E-07 | 7.9E-04 | 3 | GRM2 | 51 740 850 | TSS1500 | Island |
| cg21213853 | 5.02 | 5.1E-07 | 1.0E-03 | 3 | GRM2 | 51 741 473 | 5′UTR | S_Shore |
| cg07547765 | 5.19 | 2.1E-07 | 1.2E-03 | 17 | HOXB7 | 46 685 448 | Body | Island |
| cg06740227 | −4.95 | 7.3E-07 | 1.2E-03 | 12 | RASSF9 | 86 229 804 | Body | |
| cg25460807 | 5.02 | 5.1E-07 | 1.3E-03 | 8 | FGF17 | 21 908 022 | S_Shelf | |
| cg08220120 | 4.94 | 7.9E-07 | 1.7E-03 | 5 | LOC389333 | 138 727 711 | 1stExon;3′UTR | Island |
| cg13274149 | 4.82 | 1.4E-06 | 1.8E-03 | 9 | C9orf167 | 140 175 393 | 3’UTR | Island |
| cg16867657 | 5.09 | 3.6E-07 | 1.9E-03 | 6 | ELOVL2 | 11 044 877 | TSS1500 | Island |
| cg21878650 | −4.82 | 1.5E-06 | 2.2E-03 | 5 | ADAMTS6 | 64 558 623 | Body | |
| cg07164639 | −4.78 | 1.8E-06 | 2.4E-03 | 6 | DDO | 110 736 958 | TSS1500 | |
| cg11743675 | 4.72 | 2.3E-06 | 2.9E-03 | 12 | CNTN1 | 41 221 855 | 5′UTR | |
| cg06942979 | 4.71 | 2.5E-06 | 3.0E-03 | 22 | SELM | 31 501 382 | Body | N_Shore |
| cg11041817 | 4.67 | 3.1E-06 | 3.4E-03 | 17 | HOXB7 | 46 685 327 | Body | Island |
| cg25711003 | −4.65 | 3.3E-06 | 3.5E-03 | 3 | PHLDB2; PLCXD2 |
111 522 050 | 5′UTR; Body |
|
| cg16980380 | 4.71 | 2.5E-06 | 3.9E-03 | 17 | ENDOV | 78 417 883 | Island | |
| cg18773260 | 4.92 | 8.4E-07 | 4.1E-03 | 17 | HOXB7 | 46 685 292 | Body | Island |
| cg00303541 | 4.49 | 7.1E-06 | 4.5E-03 | 3 | GRM2 | 51 741 280 | 5′UTR | Island |
| cg09809672 | −4.50 | 6.8E-06 | 4.9E-03 | 1 | EDARADD | 236 557 682 | TSS1500;5′UTR; 1stExon |
N_Shore |
| cg21101631 | 4.90 | 9.4E-07 | 5.8E-03 | 5 | PCDHGA4; PCDHGC3; |
140 874 572 | Body | S_Shelf |
| cg25693132 | 4.40 | 1.1E-05 | 7.3E-03 | 3 | GRM2 | 51 740 741 | TSS1500 | Island |
| cg02489552 | 4.36 | 1.3E-05 | 7.4E-03 | 19 | CCDC105 | 15 121 531 | TSS200 | N_Shore |
| cg06783429 | 4.35 | 1.4E-05 | 7.5E-03 | 7 | SND1 | 127 673 038 | Body | S_Shore |
| cg25150953 | −4.34 | 1.4E-05 | 7.6E-03 | 4 | LIMCH1 | 41 540 229 | Body | |
| cg01331772 | 4.33 | 1.5E-05 | 7.9E-03 | 2 | 131 094 827 | |||
| cg21572722 | 4.38 | 1.2E-05 | 8.3E-03 | 6 | ELOVL2 | 11 044 894 | TSS1500 | Island |
| cg15028548 | −4.31 | 1.7E-05 | 8.4E-03 | 3 | ABI3BP | 100 712 322 | 5′UTR; 1stExon |
|
| cg09143195 | −4.30 | 1.7E-05 | 8.5E-03 | 12 | CNTN1 | 41 085 901 | TSS1500 | N_Shore |
| cg03131366 | −4.27 | 2.0E-05 | 9.4E-03 | 12 | 2 041 707 | |||
| cg01883408 | 4.25 | 2.1E-05 | 1.0E-02 | 5 | CCNI2 | 132 083 691 | Body | Island |
| cg00700412 | 4.22 | 2.4E-05 | 1.1E-02 | 12 | 58 011 837 | N_Shore | ||
| cg19270739 | −4.28 | 1.9E-05 | 1.1E-02 | 1 | 1 368 846 | N_Shore | ||
| cg03994651 | 4.15 | 3.3E-05 | 1.2E-02 | 19 | LMTK3 | 49 004 677 | Body | Island |
| cg18055623 | 4.16 | 3.2E-05 | 1.3E-02 | 19 | CACNG8; MIR935 |
54 485 327 | Body; TSS1500 |
Island |
| cg05694021 | −4.15 | 3.4E-05 | 1.3E-02 | 12 | 19 699 504 | |||
| cg05697274 | 4.14 | 3.4E-05 | 1.3E-02 | 1 | GALNT2 | 230 415 377 | 3′UTR | Island |
| cg27033805 | −4.11 | 3.9E-05 | 1.4E-02 | 8 | BOP1 | 145 499 436 | Body | S_Shore |
| cg16387850 | 4.09 | 4.3E-05 | 1.5E-02 | 1 | 46 982 889 | |||
| cg13138089 | 4.05 | 5.2E-05 | 1.7E-02 | 2 | ECEL1P2 | 233 251 770 | TSS200 | Island |
| cg06443034 | 4.38 | 1.2E-05 | 1.8E-02 | 17 | 78 417 973 | Island | ||
| cg01426818 | 4.31 | 1.6E-05 | 2.0E-02 | 17 | 77 806 444 | Island | ||
| cg13392258 | 3.97 | 7.1E-05 | 2.0E-02 | 17 | 77 806 190 | Island | ||
| cg19022697 | 3.92 | 8.9E-05 | 2.0E-02 | 1 | TTC22 | 55 247 140 | Body | Island |
| cg02231404 | 4.15 | 3.3E-05 | 2.1E-02 | 20 | SOX18 | 62 679 635 | Body | Island |
| cg02046143 | −3.95 | 7.9E-05 | 2.2E-02 | 11 | IGSF9B | 133 797 911 | Body | N_Shelf |
| cg15840151 | 3.89 | 1.0E-04 | 2.5E-02 | 10 | C10orf120 | 124 459 681 | TSS1500 | |
| cg21968765 | −3.88 | 1.1E-04 | 2.5E-02 | 3 | ABI3BP | 100 712 345 | TSS200 | |
| cg11766468 | 4.16 | 3.2E-05 | 2.7E-02 | 19 | EVI5L | 7 923 041 | Body | N_Shelf |
| cg22398226 | 3.81 | 1.4E-04 | 3.0E-02 | 4 | 155 662 217 | N_Shore | ||
| cg19344626 | −3.80 | 1.4E-04 | 3.1E-02 | 19 | NWD1 | 16 830 749 | TSS200 |
*Since these CpGs represent the overlap of association with five events, the lowest p-values identified for several outcomes is shown.
In girls, the identified 273 CpGs represent 236 genes (Supplementary Table SI). Inspecting biological processes (European Bioinformatics Institute—https://www.ebi.ac.uk/) related to the revealed genes using as a functional annotation tool the ToppFun server (Chen et al., 2009), showed 11 biological processes (Supplementary Table SIII). The 11 biological processes are related to growth and pubertal changes and can be grouped into five developments: bones (bone development GO:0060348, endochondral bone morphogenesis (GO:0060350), bone morphogenesis (GO:0060349)); related to adhesion (cell adhesion (GO:0007155), and biological adhesion (GO:0022610)); related to neural changes (neurogenesis (GO:0022008), neuron differentiation (GO:0030182), retina layer formation (GO:0010842), and retina development in camera-type eye (GO:0060041)); related to anatomical structure formation involved in morphogenesis (GO:0048646, which describes the initial formation of an anatomical structure from unspecified parts); and responses to progesterone (GO:0032570, which characterizes a change in activity as a result of a progesterone stimulus). The identification of these biological processes in girls provides credibility for the 273 puberty-related CpGs that were also replicated in at least one of the two other studies.
Of the genes in boys replicated by either of the previous studies (Almstrup et al., 2016; Thompson et al., 2018), functional annotation analysis showed no significant biological processes for boys using 68 genes of 67 CpGs (Supplementary Table SII). However, to inspect individual genes, we then focused on genes whose CpGs were related to at least two pubertal events (Supplementary Table SIV) [number of events] (ABI3BP [5], CBX4 [3], CNTN1 [3], DDO [3], ELOVL2 [5], GRM2 [5], HOXB7 [5], KCNAB3 [3], and LIMCH1 [2]).
Discussion
In agreement with recent reports that epigenetic changes are crucial in the development of puberty (Lomniczi and Ojeda, 2016), we identified a large number of DNA methylation changes related to puberty. In 244 girls and 226 boys, we identified more CpGs in girls significantly linked with ages at all five pubertal events (k = 13 487) than in boys (k = 311). Of these, 273 CpGs in girls and 67 CpGs in boys were also identified previously (Almstrup et al., 2016; Thompson et al., 2018). In other words, of the 629 and 425 found in girls and boys, respectively, in prior studies (Fig. 4), we detected 43.4% in girls and 15.8% in boys, as being statistically significantly related to at least one pubertal event. Given that the sample sizes of the two prior studies were smaller (51 participants in Denmark and 55 participants in North America) compared to our cohort of 470 adolescents, a low replication proportion is not unusual. Nevertheless, the much lower proportion of replication in boys may be attributed to less obvious markers of puberty in boys than in girls (age at menarche, etc.). However, an argument against this conclusion is that of the work by Thompson et al. (2018) (30 girls and 25 boys), which is based on clinical measures independent of recall, also identified more significant CpGs in girls (347 CpGs) than in boys (50 CpGs).
Ages at pubertal events are associated with both an increase and decrease in DNAm. In addition, the strength of the identified associations is stronger in girls. The majority of CpGs were associated with age of menarche (k = 55 230) in girls and facial hair growth in boys (k = 2523), and these events are not included in the Tanner stages (Marshall and Tanner, 1969; Marshall and Tanner, 1970). The large difference in the number of CpGs in boys and girls may be related to more pronounced pubertal transition in girls compared to boys (Gunnar et al., 2009) or to differential reporting of ages at puberty. Almstrup et al. (2016) analyzed data from girls (n = 22) and boys (n = 32) separately, but only found significant CpGs in boys, which may be due to the larger sample size in boys. The results of our study agree with the work by Thompson et al. (2018) (30 girls and 25 boys) that identified more significant CpGs in girls (347 CpGs) than in boys (50 CpGs).
Our statistical approach used repeated measurements of DNAm with differences between age of puberty and the respective DNAm measurement at 10 and 18 years (Δyears) as predictors (Fig. 1). The effect of chronological age was removed, and the residuals of the methylation levels (M values) were used. Hence, a positive slope between the time of pubertal events relative to DNAm at ages 10 or 18 years means that the puberty event is related to an increase of DNAm over time. Vice versa, a negative slope described methylation levels that are related to puberty but are higher due to prior experience of puberty and which decrease thereafter. The results show that both processes are related to pubertal markers, a decrease and an increase of methylation over time (Supplementary Figs S1 and S2). The advantage is that a change in methylation was compared to a baseline prior to pubertal events. Our work demonstrates associations between changes in DNAm and various pubertal events; however, we do not claim causal associations since the effects may go in either direction.
Of the 273 replicable CpGs in girls representing 235 genes, three genes (TCF7—transcription factor 7, FTO—alpha-ketoglutarate dependent dioxygenase, UBA7—ubiquitin like modifier-activating enzyme 7) were identified in prior genetic studies and one of the 68 genes representing 67 CpGs was also found in boys (EVI5L—ecotropic viral integration site 5 like) (Young et al., 2012; Cousminer et al., 2014; Hagen et al., 2014; Ojeda and Lomniczi, 2014; Perry et al., 2014; Perry et al., 2015; Livadas and Chrousos, 2016; Avendano et al., 2017). The detection of a large number of differently methylated CpGs on various genes in girls and identification of 11 biological processes in girls but none in boys suggests that pubertal changes in girls may be related to physiologically linked developments. It is possible that pubertal processes in boys represent more isolated developmental changes (without important biological pathways).
In boys, concentrating on genes that were associated with ages of at least two pubertal events may increase their biological significance. Of the nine genes included in Supplementary Table SII, four were also identified in girls related to multiple pubertal events (ABI3BP—ABI family member 3 binding protein [5], DDO—D-aspartate oxidase [5], HOXB7—homeobox B7 [2] and KCNAB3—potassium voltage-gated channel subfamily A regulatory beta subunit 3 [5], Supplementary Table SI). Gene Ontology annotations related to ABI3BP include heparin and glycosaminoglycan binding (https://www.genecards.org/). Heparin-binding proteins (HBPs) originate from secretions of the male accessory glands; seminal plasma contains multiple proteins that bind heparin (Yadav et al., 2013). HBPs content decreased in castrated rats and was restored by testosterone replacement (Nass et al., 1990). Epigenetic regulatory actions of CBX4 (Chromobox 4) seems to be related to feminization of the zebrafish (Ribas et al., 2017). CNTN1 (Contactin 1) encodes the neuronal membrane protein Contactin 1 that functions as a cell adhesion molecule. It was reported that a complex including Contactin is involved in pubertal processes in female rats (Srivastava et al., 2011). DDO (D-aspartate oxidase) encodes a flavoprotein that catalyzes the oxidative deamination of D-aspartate and N-methyl D-aspartate (Setoyama and Miura, 1997). D-aspartate seems to operate differently in female and male gonads of frogs (Raucci and Di Fiore, 2011), and the N-methyl D-aspartate receptor has been suggested to play a role during sexual development of male rats (Hsu et al., 2005). ELOVL2 codes a fatty acid elongase 2; this enzyme plays a role in male fertility of Drosophila (Ng et al., 2015). Glutamate metabotropic receptor 2 encoded by GRM2 plays a role in male sexual performance (Li et al., 2013). HOXB7 encodes a nuclear protein that is involved in cell proliferation and differentiation. In mice, mutations of HOXB7 are related to a delay in urinary tract maturation (Murawski et al., 2007). We did not identify any association with puberty for the KCNAB3 (potassium voltage-gated channel subfamily a regulatory beta subunit 3) and LIMCH1 (LIM and calponin homology domains 1) genes. However, sex hormones have played a role of KCNE (potassium voltage-gated channel subfamily E) potassium channel subunits, which were discovered as hormonally regulated potassium channel components (Duffey and Bett, 2011). Hence, in boys there may be no concerted biological processes. However, a pubertal role for seven of the nine individual genes with replicated CpGs associated with more than one pubertal event cannot be excluded.
A strength of our study is the use of the PDS method to characterize age of pubertal onset. The PDS was developed as a self-report of pubertal growth status. In comparing the self-reported Sexual Maturation Scale (SMS) (developed by Tanner et al.) and the PDS, in other studies more missing data resulted from the SMS (13%) than from the PDS (4%) method (Bond et al., 2006). Given a moderate to high concordance between the PDS and physician ratings (Brooks-Gunn et al., 1987; Carskadon and Acebo, 1993) and difficulties with the acceptance of anatomical drawings in other questionnaires, the PDS was recommended for epidemiological studies (Bond et al., 2006). The PDS approach is also preferable to Tanner SMS methods (Marshall and Tanner, 1969; Marshall and Tanner, 1970) for obtaining retrospective comprehensive information on the entire pubertal period, since in SMS, the stage of puberty is assigned to the child’s current age at the time of data collection. Therefore, if the assessment is not repeated during the whole course of puberty, it only provides a snapshot of pubertal stage at one age. SMS is particularly problematic when assessing age of onset of the growth spurt, because unless serial measurements are taken for a growth curve, it is not possible to ascertain the timing of the growth spurt. As shown in a prior study (Yousefi et al., 2013), all puberty variables had high internal consistency; the overall raw Cronbach’s alpha coefficient was 0.80 in boys and 0.86 in girls. In addition, one advantage of this questionnaire-based study is the replication of epigenetic associations found with clinically assessed data (Almstrup et al., 2016; Thompson et al., 2018), since agreements found between these three approaches indicate that the detected associations do not depend on how the puberty event was measured. This is true in girls, for whom 43.4% of the CpGs identified in our analyses based on questionnaire data were replicated in two studies that used a mixture of laboratory and phenotypic markers of puberty (Almstrup et al., 2016; Thompson et al., 2018). Regarding boys, further research needs to be done to improve the replicability of 15.8%.
A limitation of the repeated measurement model relative to age of pubertal onset is that there is no ‘causal’ timeline, since earlier DNAm may have affected the pubertal age or the pubertal age may have altered later DNAm. Future studies are recommended that use a baseline at an earlier age that is not close to the changes occurring at puberty. A second limitation is the focus on autosomes. We did not inspect 418 CpGs on the X and Y chromosomes. It is possible that DNAm of the sex chromosome is involved in pubertal development, which, requires additional analyses and other replication data. Hence, we are willing to support investigations into the importance of methylation on the sex chromosomes by sharing data. Our aim was to identify CpGs of genes whose methylation changed from age 10 to 18 years as a consequence of the age at which pubertal markers occurred. We did not attempt to identify DNAm changes subsequent to early or late onset of puberty. Using age of onset of different pubertal markers as continuous measures, we identified DNAm changes that continue from early to late puberty and thus represent the integrated overall effect of puberty. Future studies may also investigate whether the affected genes in women play a role in different disease risks later in life. Also, we did not attempt to replicate the DNAm measurements based on the Illumina 450 K array with other methods, such as pyrosequencing, since this array has been shown to be technically reliable in multiple other studies (Dedeurwaerder et al., 2011; Roessler et al., 2012; Glossop et al., 2013; Ronn et al., 2013; Hall et al., 2014; Acevedo et al., 2015; Gabriel et al., 2015; Yang et al., 2015). Finally, the use of nucleated blood cells and not specific tissues is a limitation. However, since there is no ethical way to collect brain or reproductive tissue samples in human, DNA methylation changes in blood cells may provide a window related to pubertal changes in other organs.
Conclusion
In a large birth cohort study with DNA methylation measurement at 10 and 18 years of age, we identified 13 487 CpGs in girls significantly linked with ages of occurrence of all five pubertal events and 311 CpGs in boys. Of these, 273 CpGs in girls and 67 CpGs in boys had been replicated in two other previous investigations. Hence, in girls there are more genes with methylation changes as a consequence of puberty than boys. The affected genes seem to be related to biological processes in bones, adhesion, the neural system, anatomical structure formation and responses to progesterone. Of 303 genes with differential DNA methylation (replicated in other studies) related to puberty in girls and boys, only four genes were known to have genetic polymorphisms associated with puberty. Differential DNAm as a consequence of puberty needs to be investigated in terms of whether these act as mediating factors for adult diseases known to be associated with puberty.
Supplementary Material
Acknowledgements
We acknowledge the work of the staff at The David Hide Asthma and Allergy Research Centre collecting the data and the samples.
Authors’ roles
S.C. conceived the biostatistical design of the study, analyzed and interpreted the data and drafted the manuscript. H.R., N.M., F.S. and Y.J. helped with the data analyses, interpretation and biological pathways. S.C. and Y.J. contributed to funding acquisition. H.A., H.Z. and J.W.H. supervised the data and sample collection and helped drafting the manuscript. S.E. generated the DNAm data, contributed to the interpretation of the data and revising the manuscript. W.K. manage the funding acquisition, contributed to data analyses, interpretation and editing. All authors critically revised the manuscript for important intellectual content. The manuscript has been read and approved by all authors.
Funding
Eunice Kennedy Shriver National Institute of Child Health and Human Development (grant number R03HD092776, Epigenetic characterization of pubertal transitions), and NIH/NIAID (grant number R01AI121226). The 10-year follow-up of this study was funded by National Asthma Campaign, UK (Grant No. 364) and the 18-year follow-up by a grant from the National Heart and Blood Institute (R01HL082925).
Conflict of interest
The authors declare that they have no conflict of interests.
References
- Acevedo N, Reinius LE, Greco D, Gref A, Orsmark-Pietras C, Persson H, Pershagen G, Hedlin G, Melen E, Scheynius A et al. Risk of childhood asthma is associated with CpG-site polymorphisms, regional DNA methylation and mRNA levels at the GSDMB/ORMDL3 locus. Hum Mol Genet 2015;24:875–890. [DOI] [PMC free article] [PubMed] [Google Scholar]
- Almstrup K, Lindhardt Johansen M, Busch AS, Hagen CP, Nielsen JE, Petersen JH, Juul A. Pubertal development in healthy children is mirrored by DNA methylation patterns in peripheral blood. Sci Rep 2016;6:28657. [DOI] [PMC free article] [PubMed] [Google Scholar]
- Arshad SH, Holloway JW, Karmaus W, Zhang H, Ewart S, Mansfield L, Matthews S, Hodgekiss C, Roberts G, Kurukulaaratchy R. Cohort profile: the Isle Of Wight Whole Population Birth Cohort (IOWBC). Int J Epidemiol 2018. [DOI] [PMC free article] [PubMed] [Google Scholar]
- Aryee MJ, Jaffe AE, Corrada-Bravo H, Ladd-Acosta C, Feinberg AP, Hansen KD, Irizarry RA. Minfi: a flexible and comprehensive bioconductor package for the analysis of Infinium DNA methylation microarrays. Bioinformatics 2014;30:1363–1369. [DOI] [PMC free article] [PubMed] [Google Scholar]
- Avendano S, Vazquez MJ, Tena-Sempere M. Disentangling puberty: novel neuroendocrine pathways and mechanisms for the control of mammalian puberty. Hum Reprod Update 2017;23:737–763. [DOI] [PubMed] [Google Scholar]
- Baek TH, Lim NK, Kim MJ, Lee J, Ryu S, Chang Y, Choi Y, Park HY. Age at menarche and its association with dysglycemia in Korean middle-aged women. Menopause 2015;22:542–548. [DOI] [PMC free article] [PubMed] [Google Scholar]
- Benjamini Y, Hochberg Y. Controlling the false discovery rate: a practical and powerful approach to multiple testing. J Roy Stat Soc Ser B Meth 1995;57:289–300. [Google Scholar]
- Bessa DS, Maschietto M, Aylwin CF, Canton APM, Brito VN, Macedo DB, Cunha-Silva M, Palhares HMC, de Resende E, Borges MF et al. Methylome profiling of healthy and central precocious puberty girls. Clin Epigenetics 2018;10:146. [DOI] [PMC free article] [PubMed] [Google Scholar]
- Bibikova M, Fan JB. GoldenGate assay for DNA methylation profiling. Methods Mol Biol 2009;507:149–163. [DOI] [PubMed] [Google Scholar]
- Black DL. Mechanisms of alternative pre-messenger RNA splicing. Annu Rev Biochem 2003;72:291–336. [DOI] [PubMed] [Google Scholar]
- Bond L, Clements J, Bertalli N, Evans-Whipp T, McMorris BJ, Patton GC, Toumbourou JW, Catalano RF. A comparison of self-reported puberty using the Pubertal Development Scale and the Sexual Maturation Scale in a school-based epidemiologic survey. J Adolesc 2006;29:709–720. [DOI] [PubMed] [Google Scholar]
- Brooks-Gunn J, Warren M, Rosso J, Gargiulo J. Validity of self-report measures of girls’ pubertal status. Child Dev 1987;58:829–841. [PubMed] [Google Scholar]
- Carskadon MA, Acebo C. A self-administered rating scale for pubertal development. J Adolesc Health 1993;14:190–195. [DOI] [PubMed] [Google Scholar]
- Chang CJ, Lai MM, Lin CC, Liu CS, Li TC, Li CI, Lin WY. Age at menarche and its association with the metabolic syndrome in Taiwan. Obes Res Clin Pract 2016;10:S26–S34. [DOI] [PubMed] [Google Scholar]
- Chen J, Bardes EE, Aronow BJ, Jegga AG. ToppGene Suite for gene list enrichment analysis and candidate gene prioritization. Nucleic Acids Res 2009;37:W305–W311. [DOI] [PMC free article] [PubMed] [Google Scholar]
- Chen ZX, Riggs AD. DNA methylation and demethylation in mammals. J Biol Chem 2011;286:18347–18353. [DOI] [PMC free article] [PubMed] [Google Scholar]
- Cousminer DL, Stergiakouli E, Berry DJ, Ang W, Groen-Blokhuis MM, Korner A, Siitonen N, Ntalla I, Marinelli M, Perry JRB et al. Genome-wide association study of sexual maturation in males and females highlights a role for body mass and menarche loci in male puberty. Hum Mol Genet 2014;23:4452–4464. [DOI] [PMC free article] [PubMed] [Google Scholar]
- Day FR, Elks CE, Murray A, Ong KK, Perry JRB. Puberty timing associated with diabetes, cardiovascular disease and also diverse health outcomes in men and women: the UK Biobank study. Sci Rep-Uk 2015;5:srep11208. [DOI] [PMC free article] [PubMed] [Google Scholar]
- de Ridder CM, Thijssen JH, Bruning PF, Van den Brande JL, Zonderland ML, Erich WB. Body fat mass, body fat distribution, and pubertal development: a longitudinal study of physical and hormonal sexual maturation of girls. J Clin Endocrinol Metab 1992;75:442–446. [DOI] [PubMed] [Google Scholar]
- Dedeurwaerder S, Defrance M, Calonne E, Denis H, Sotiriou C, Fuks F. Evaluation of the Infinium Methylation 450K technology. Epigenomics 2011;3:771–784. [DOI] [PubMed] [Google Scholar]
- Demetriou CA, Chen J, Polidoro S, Veldhoven K, Cuenin C, Campanella G, Brennan K, Clavel-Chapelon F, Dossus L, Kvaskoff M et al. Methylome analysis and epigenetic changes associated with menarcheal age. PLoS One 2013;8:e79391. [DOI] [PMC free article] [PubMed] [Google Scholar]
- Dorn LD, Biro FM. Puberty and its measurement: a decade in review. J Res Adolescence 2011;21:180–195. [Google Scholar]
- Duffey ME, Bett GC. Sex specific association of potassium channel subunits. J Physiol 2011;589:5345–5346. [DOI] [PMC free article] [PubMed] [Google Scholar]
- Elks CE, Perry JR, Sulem P, Chasman DI, Franceschini N, He C, Lunetta KL, Visser JA, Byrne EM, Cousminer DL et al. Thirty new loci for age at menarche identified by a meta-analysis of genome-wide association studies. Nat Genet 2010;42:1077–1085. [DOI] [PMC free article] [PubMed] [Google Scholar]
- Gabriel AS, Lafta FM, Schwalbe EC, Nakjang S, Cockell SJ, Iliasova A, Enshaei A, Schwab C, Rand V, Clifford SC et al. Epigenetic landscape correlates with genetic subtype but does not predict outcome in childhood acute lymphoblastic leukemia. Epigenetics 2015;10:717–726. [DOI] [PMC free article] [PubMed] [Google Scholar]
- Gemelli IFB, Farias ED, Souza OF . Age at menarche and its association with excess weight and body fat percentage in girls in the southwestern region of the Brazilian Amazon. J Pediatr Adol Gynec 2016;29:482–488. [DOI] [PubMed] [Google Scholar]
- Glossop JR, Nixon NB, Emes RD, Haworth KE, Packham JC, Dawes PT, Fryer AA, Mattey DL, Farrell WE. Epigenome-wide profiling identifies significant differences in DNA methylation between matched-pairs of T- and B-lymphocytes from healthy individuals. Epigenetics 2013;8:1188–1197. [DOI] [PubMed] [Google Scholar]
- Gomes MB, Negrato CA, Calliari LEP, Grp BTDS. Early age at menarche: a risk factor for overweight or obesity in patients with type 1 diabetes living in urban areas? Diabetes Res Clin Pr 2015;107:23–30. [DOI] [PubMed] [Google Scholar]
- Gunnar MR, Wewerka S, Frenn K, Long JD, Griggs C. Developmental changes in hypothalamus-pituitary-adrenal activity over the transition to adolescence: normative changes and associations with puberty. Dev Psychopathol 2009;21:69–85. [DOI] [PMC free article] [PubMed] [Google Scholar]
- Guo SS, Chumlea WC, Roche AF, Siervogel RM. Age- and maturity-related changes in body composition during adolescence into adulthood: the Fels Longitudinal Study. Int J Obes Relat Metab Disord 1997;21:1167–1175. [DOI] [PubMed] [Google Scholar]
- Hagen CP, Sorensen K, Aksglaede L, Mouritsen A, Mieritz MG, Tinggaard J, Wohlfart-Veje C, Petersen JH, Main KM, Rajpert-De Meyts E et al. Pubertal onset in girls is strongly influenced by genetic variation affecting FSH action. Sci Rep 2014;4:6412. [DOI] [PMC free article] [PubMed] [Google Scholar]
- Hall E, Volkov P, Dayeh T, Esguerra JL, Salo S, Eliasson L, Ronn T, Bacos K, Ling C. Sex differences in the genome-wide DNA methylation pattern and impact on gene expression, microRNA levels and insulin secretion in human pancreatic islets. Genome Biol 2014;15:522. [DOI] [PMC free article] [PubMed] [Google Scholar]
- Hardy R, Kuh D, Whincup PH, Wadsworth MEJ. Age at puberty and adult blood pressure and body size in a British birth cohort study. J Hypertens 2006;24:59–66. [DOI] [PubMed] [Google Scholar]
- He F, Guan P, Liu Q, Crabtree D, Peng L, Wang H. The relationship between obesity and body compositions with respect to the timing of puberty in Chongqing adolescents: a cross-sectional study. BMC Public Health 2017;17. [DOI] [PMC free article] [PubMed] [Google Scholar]
- Hinrichs AL, Larkin EK, Suarez BK. Population stratification and patterns of linkage disequilibrium. Genet Epidemiol 2009;33Suppl 1:S88–S92. [DOI] [PMC free article] [PubMed] [Google Scholar]
- Houseman EA, Accomando WP, Koestler DC, Christensen BC, Marsit CJ, Nelson HH, Wiencke JK, Kelsey KT. DNA methylation arrays as surrogate measures of cell mixture distribution. BMC Bioinformatics 2012;13:86. [DOI] [PMC free article] [PubMed] [Google Scholar]
- Hsieh CC, Trichopoulos D, Katsouyanni K, Yuasa S. Age at menarche, age at menopause, height and obesity as risk factors for breast cancer: associations and interactions in an international case-control study. Int J Cancer 1990;46:796–800. [DOI] [PubMed] [Google Scholar]
- Hsu HK, Shao PL, Tsai KL, Shih HC, Lee TY, Hsu C. Gene regulation by NMDA receptor activation in the SDN-POA neurons of male rats during sexual development. J Mol Endocrinol 2005;34:433–445. [DOI] [PubMed] [Google Scholar]
- Jacobsen BK, Heuch I, Kvåle G. Association of low age at menarche with increased all-cause mortality: a 37-year follow-up of 61,319 Norwegian women. Am J Epidemiol 2007;166:1431–1437. [DOI] [PubMed] [Google Scholar]
- Jacobsen BK, Oda K, Knutsen SF, Fraser GE. Age at menarche, total mortality and mortality from ischaemic heart disease and stroke: the Adventist Health Study, 1976–88. Int J Epidemiol 2009;38:245–252. [DOI] [PMC free article] [PubMed] [Google Scholar]
- Jaffe AE, Irizarry RA. Accounting for cellular heterogeneity is critical in epigenome-wide association studies. Genome Biol 2014;15:R31. [DOI] [PMC free article] [PubMed] [Google Scholar]
- James E, Wood CL, Nair H, Williams TC. Preterm birth and the timing of puberty: a systematic review. BMC Pediatr 2018;18:3. [DOI] [PMC free article] [PubMed] [Google Scholar]
- Johnson WE, Li C, Rabinovic A. Adjusting batch effects in microarray expression data using empirical Bayes methods. Biostatistics 2007;8:118–127. [DOI] [PubMed] [Google Scholar]
- Jones PA. Functions of DNA methylation: islands, start sites, gene bodies and beyond. Nat Rev Genet 2012;13:484–492. [DOI] [PubMed] [Google Scholar]
- Lakshman R, Forouhi NG, Sharp SJ, Luben R, Bingham SA, Khaw K-T, Wareham NJ, Ong KK. Early age at menarche associated with cardiovascular disease and mortality. J Clin Endocrinol Metab 2009;94:4953–4960. [DOI] [PubMed] [Google Scholar]
- Lehne B, Drong AW, Loh M, Zhang W, Scott WR, Tan ST, Afzal U, Scott J, Jarvelin MR, Elliott P et al. A coherent approach for analysis of the Illumina HumanMethylation450 BeadChip improves data quality and performance in epigenome-wide association studies. Genome Biol 2015;16:37. [DOI] [PMC free article] [PubMed] [Google Scholar]
- Lev Maor G, Yearim A, Ast G. The alternative role of DNA methylation in splicing regulation. Trends Genet 2015;31:274–280. [DOI] [PubMed] [Google Scholar]
- Li H, Shen L, Song L, Liu B, Zheng X, Xu S, Wang Y. Early age at menarche and gestational diabetes mellitus risk: results from the Healthy Baby Cohort study. Diabetes Metab 2017;43:248–252. [DOI] [PubMed] [Google Scholar]
- Li X, Higley A, Song R, Xi ZX. Effects of metabotropic glutamate receptor ligands on male sexual behavior in rats. Neuropharmacology 2013;66:373–381. [DOI] [PMC free article] [PubMed] [Google Scholar]
- Livadas S, Chrousos GP. Control of the onset of puberty. Curr Opin Pediatr 2016;28:551–558. [DOI] [PubMed] [Google Scholar]
- Lomniczi A, Ojeda SR. The emerging role of epigenetics in the regulation of female puberty. Endocr Dev 2016;29:1–16. [DOI] [PMC free article] [PubMed] [Google Scholar]
- Mahmoud O, Granell R, Tilling K, Minelli C, Garcia-Aymerich J, Holloway JW, Custovic A, Jarvis D, Sterne J, Henderson J. Association of height growth in puberty with lung function a longitudinal study. Am J Resp Crit Care 2018;198:1539–1548. [DOI] [PMC free article] [PubMed] [Google Scholar]
- Marshall WA, Tanner JM. Variations in pattern of pubertal changes in girls. Arch Dis Child 1969;44:291–303. [DOI] [PMC free article] [PubMed] [Google Scholar]
- Marshall WA, Tanner JM. Variations in the pattern of pubertal changes in boys. Arch Dis Child 1970;45:13–23. [DOI] [PMC free article] [PubMed] [Google Scholar]
- Maule M, Malavassi JL, Richiardi L. Age at puberty and risk of testicular cancer: a meta-analysis. Int J Androl 2012;35:828–834. [DOI] [PubMed] [Google Scholar]
- Mendle J, Ferrero J. Detrimental psychological outcomes associated with pubertal timing in adolescent boys. Dev Rev 2012;32:49–66. [DOI] [PMC free article] [PubMed] [Google Scholar]
- Mendle J, Turkheimer E, Emery RE. Detrimental psychological outcomes associated with early pubertal timing in adolescent girls. Dev Rev 2007;27:151–171. [DOI] [PMC free article] [PubMed] [Google Scholar]
- Miller SA, Dykes DD, Polesky HF. A simple salting out procedure for extracting DNA from human nucleated cells. Nucleic Acids Res 1988;16:1215. [DOI] [PMC free article] [PubMed] [Google Scholar]
- Murawski IJ, Myburgh DB, Favor J, Gupta IR. Vesico-ureteric reflux and urinary tract development in the Pax2 1Neu+/− mouse. Am J Physiol Renal Physiol 2007;293:F1736–F1745. [DOI] [PubMed] [Google Scholar]
- Nass SJ, Miller DJ, Winer MA, Ax RL. Male accessory sex glands produce heparin-binding proteins that bind to cauda epididymal spermatozoa and are testosterone dependent. Mol Reprod Dev 1990;25:237–246. [DOI] [PubMed] [Google Scholar]
- Ng WC, Chin JS, Tan KJ, Yew JY. The fatty acid elongase Bond is essential for Drosophila sex pheromone synthesis and male fertility. Nat Commun 2015;6:8263. [DOI] [PMC free article] [PubMed] [Google Scholar]
- Oberdoerffer S. A conserved role for intragenic DNA methylation in alternative pre-mRNA splicing. Transcription 2012;3:106–109. [DOI] [PMC free article] [PubMed] [Google Scholar]
- Ojeda SR, Lomniczi A. Puberty in 2013: unravelling the mystery of puberty. Nat Rev Endocrinol 2014;10:67–69. [DOI] [PubMed] [Google Scholar]
- Ong KK, Bann D, Wills AK, Ward K, Adams JE, Hardy R, Kuh D. Timing of voice breaking in males associated with growth and weight gain across the life course. J Clin Endocrinol Metab 2012;97:2844–2852. [DOI] [PMC free article] [PubMed] [Google Scholar]
- Perry JR, Day F, Elks CE, Sulem P, Thompson DJ, Ferreira T, He C, Chasman DI, Esko T, Thorleifsson G et al. Parent-of-origin-specific allelic associations among 106 genomic loci for age at menarche. Nature 2014;514:92–97. [DOI] [PMC free article] [PubMed] [Google Scholar]
- Perry JRB, Murray A, Day FR, Ong KK. Molecular insights into the aetiology of female reproductive ageing. Nat Rev Endocrinol 2015;11:725–734. [DOI] [PMC free article] [PubMed] [Google Scholar]
- Petersen AC, Crockett L, Richards M, Boxer A. A self-report measure of pubertal status: reliability, validity, and initial norms. J Youth Adolesc 1988;17:117–133. [DOI] [PubMed] [Google Scholar]
- Platt JM, Colich NL, McLaughlin KA, Gary D, Keyes KM. Transdiagnostic psychiatric disorder risk associated with early age of menarche: a latent modeling approach. Compr Psychiatry 2017;79:70–79. [DOI] [PMC free article] [PubMed] [Google Scholar]
- Raucci F, Di Fiore MM. D-Asp: a new player in reproductive endocrinology of the amphibian Rana esculenta. J Chromatogr B, Analyt Technol Biomed Life Sci 2011;879:3268–3276. [DOI] [PubMed] [Google Scholar]
- Reinius LE, Acevedo N, Joerink M, Pershagen G, Dahlen SE, Greco D, Soderhall C, Scheynius A, Kere J. Differential DNA methylation in purified human blood cells: implications for cell lineage and studies on disease susceptibility. PLoS One 2012;7:e41361. [DOI] [PMC free article] [PubMed] [Google Scholar]
- Remsberg KE, Demerath EW, Schubert CM, Chumlea WC, Sun SS, Siervogel RM. Early menarche and the development of cardiovascular disease risk factors in adolescent girls: the Fels Longitudinal Study. J Clin Endocrinol Metab 2005;90:2718–2724. [DOI] [PubMed] [Google Scholar]
- Ribas L, Vanezis K, Imues MA, Piferrer F. Treatment with a DNA methyltransferase inhibitor feminizes zebrafish and induces long-term expression changes in the gonads. Epigenetics Chromatin 2017;10:59. [DOI] [PMC free article] [PubMed] [Google Scholar]
- Roessler J, Ammerpohl O, Gutwein J, Hasemeier B, Anwar SL, Kreipe H, Lehmann U. Quantitative cross-validation and content analysis of the 450k DNA methylation array from Illumina, Inc. BMC Res Notes 2012;5:210. [DOI] [PMC free article] [PubMed] [Google Scholar]
- Ronn T, Volkov P, Davegardh C, Dayeh T, Hall E, Olsson AH, Nilsson E, Tornberg A, Dekker Nitert M, Eriksson KF et al. A six months exercise intervention influences the genome-wide DNA methylation pattern in human adipose tissue. PLoS Genet 2013;9:e1003572. [DOI] [PMC free article] [PubMed] [Google Scholar]
- Ryu S, Chang Y, Choi Y, Kwon MJ, Kim CW, Yun KE, Jung HS, Kim BK, Kim YJ, Ahn J et al. Age at menarche and non-alcoholic fatty liver disease. J Hepatol 2015;62:1164–1170. [DOI] [PubMed] [Google Scholar]
- Setoyama C, Miura R. Structural and functional characterization of the human brain D-aspartate oxidase. J Biochem 1997;121:798–803. [DOI] [PubMed] [Google Scholar]
- Shenker N, Flanagan JM. Intragenic DNA methylation: implications of this epigenetic mechanism for cancer research. Br J Cancer 2012;106:248–253. [DOI] [PMC free article] [PubMed] [Google Scholar]
- Srivastava VK, Hiney JK, Dees WL. Hypothalamic actions and interactions of alcohol and IGF-1 on the expression of glial receptor protein tyrosine phosphatase-beta during female pubertal development. Alcohol Clin Exp Res 2011;35:1812–1821. [DOI] [PMC free article] [PubMed] [Google Scholar]
- Thompson EE, Nicodemus-Johnson J, Kim KW, Gern JE, Jackson DJ, Lemanske RF, Ober C. Global DNA methylation changes spanning puberty are near predicted estrogen-responsive genes and enriched for genes involved in endocrine and immune processes. Clin Epigenetics 2018;10:62. [DOI] [PMC free article] [PubMed] [Google Scholar]
- van Lenthe FJ, Kemper CG, van Mechelen W. Rapid maturation in adolescence results in greater obesity in adulthood: the Amsterdam Growth and Health Study. Am J Clin Nutr 1996;64:18–24. [DOI] [PubMed] [Google Scholar]
- Varraso R, Siroux V, Maccario J, Pin I, Kauffmann F. Epidemiological Study on the G, Environment of A. Asthma severity is associated with body mass index and early menarche in women. Am J Resp Crit Care 2005;171:334–339. [DOI] [PubMed] [Google Scholar]
- Willemsen RH, Dunger DB. Normal variation in pubertal timing: genetic determinants in relation to growth and adiposity. Endocr Dev 2016;29:17–35. [DOI] [PubMed] [Google Scholar]
- Yadav VK, Saraswat M, Chhikara N, Singh S, Yadav S. Heparin and heparin binding proteins: potential relevance to reproductive physiology. Curr Protein Pept Sci 2013;14:61–69. [DOI] [PubMed] [Google Scholar]
- Yang L, Li LM, Millwood IY, Peters SAE, Chen YP, Guo Y, Bian Z, Chen XF, Chen LL, Feng SX et al. Age at menarche and risk of major cardiovascular diseases: evidence of birth cohort effects from a prospective study of 300,000 Chinese women. Int J Cardiol 2017;227:497–502. [DOI] [PMC free article] [PubMed] [Google Scholar]
- Yang Y, Sebra R, Pullman BS, Qiao W, Peter I, Desnick RJ, Geyer CR, DeCoteau JF, Scott SA. Quantitative and multiplexed DNA methylation analysis using long-read single-molecule real-time bisulfite sequencing (SMRT-BS). BMC Genomics 2015;16:350. [DOI] [PMC free article] [PubMed] [Google Scholar]
- Yoo J-H. Effects of early menarche on physical and psychosocial health problems in adolescent girls and adult women. Korean J Pediatr 2016;59:355–361. [DOI] [PMC free article] [PubMed] [Google Scholar]
- Young J, Metay C, Bouligand J, Tou B, Francou B, Maione L, Tosca L, Sarfati J, Brioude F, Esteva B et al. SEMA3A deletion in a family with Kallmann syndrome validates the role of semaphorin 3A in human puberty and olfactory system development. Hum Reprod 2012;27:1460–1465. [DOI] [PubMed] [Google Scholar]
- Yousefi M, Karmaus W, Zhang H, Roberts G, Matthews S, Clayton B, Arshad SH. Relationships between age of puberty onset and height at age 18 years in girls and boys. World J Pediatr 2013;9:230–238. [DOI] [PubMed] [Google Scholar]
Associated Data
This section collects any data citations, data availability statements, or supplementary materials included in this article.