

Abstract
Objectives:
We evaluated the diagnostic performance of a deep learning system for the detection of Sjögren’s syndrome (SjS) in ultrasonography (US) images, and compared it with the performance of inexperienced radiologists.
Methods:
100 patients with a confirmed diagnosis of SjS according to both the Japanese criteria and American-European Consensus Group criteria and 100 non-SjS patients that had a dry mouth and suspected SjS but were definitively diagnosed as non-SjS were enrolled in this study. All the patients underwent US scans of both the parotid glands (PG) and submandibular glands (SMG). The training group consisted of 80 SjS patients and 80 non-SjS patients, whereas the test group consisted of 20 SjS patients and 20 non-SjS patients for deep learning analysis. The performance of the deep learning system for diagnosing SjS from the US images was compared with the diagnoses made by three inexperienced radiologists.
Results:
The accuracy, sensitivity and specificity of the deep learning system for the PG were 89.5, 90.0 and 89.0%, respectively, and those for the inexperienced radiologists were 76.7, 67.0 and 86.3%, respectively. The deep learning system results for the SMG were 84.0, 81.0 and 87.0%, respectively, and those for the inexperienced radiologists were 72.0, 78.0 and 66.0%, respectively. The AUC for the inexperienced radiologists was significantly different from that of the deep learning system.
Conclusions:
The deep learning system had a high diagnostic ability for SjS. This suggests that deep learning could be used for diagnostic support when interpreting US images.
Keywords: deep learning, Sjögren's syndrome, ultrasonography
Introduction
Sjögren’s syndrome (SjS) is an autoimmune disease that has dry eyes and a dry mouth as the main signs. Regarding the dry mouth, the amount of salivary secretion is reduced as result of the occurrence of steatosis in the salivary gland parenchyma.1,2 This condition can be detected using CT or MRI, which is effective for detecting SjS.3–5 In our past study,6 we compared the fat fraction of the salivary glands of normal subjects and SjS patients with the six-point DIXON MRI method, and found that there was a significant difference between normal subjects and SjS patients, and that this could aid diagnostic imaging. However, CT or MRI cannot be used routinely because of the high cost and limited availability of facilities. Additionally, CT exposes patients to radiation, and MRI is contraindicated for patients with claustrophobia, pacemakers and metal prostheses, and examination takes a long time.
By contrast, compared with CT or MRI, ultrasonography (US) is inexpensive, does not require a large space in clinics, has no radiation exposure, and is not contraindicated for any patients. In recent years, many studies of SjS using US have been conducted.7–24 However, the diagnosis of US images is very difficult, and diagnostic accuracy depends on years of experience. Additionally, many past studies include evaluations by only experienced observers and not inexperienced observers.
In recent years, many studies of image diagnosis that apply a deep learning system have been conducted.25–35 A deep learning system is an artificial intelligence machine learning method that allows a computer to learn tasks like humans. It is based on a neural network, which is a system that imitates the neurons in the human brain. Many investigators have reported the high performance of deep learning systems for image diagnosis in various fields, including liver,25 brain28 and lung disease.26,27 We have previously verified that a deep learning system is useful for the CT evaluation of cervical lymph node metastasis in oral cancer patients.33,34 Furthermore, we analysed CT images of the parotid glands (PG) of patients with SjS and normal subjects using a deep learning system, and found that it was equivalent to the diagnostic accuracy of experienced radiologists, whereas it was higher than that of inexperienced radiologists.35 Few studies have been conducted on the diagnosis of US images using deep learning, and none have considered SjS to the best of our knowledge.
Many past studies used a normal control group for CT MRI, or US. However, in clinics especially in dry mouth clinics, it is essential to differentiate patients with true SjS from non-SjS patients with a dry mouth. Therefore, the purpose of this study is to evaluate the diagnostic performance of a deep learning system for the differentiation of SjS from non-SjS with a dry mouth using US images, and to compare the results with those of inexperienced radiologists.
Methods and materials
The study design was approved by the Ethics Committee of Kyushu University, Japan, and written informed consent was obtained from all the patients (IRB serial number: 29–006).
Subjects
A total of 200 patients who complained of a dry mouth and were referred to the Department of Oral and Maxillofacial Radiology, Faculty of Dental Science, Kyushu University, Fukuoka, Japan, to receive US examinations between 2011 and 2018 were enrolled in this study. US images of 100 patients (13 males and 87 females with an average age of 56.6 years) with a confirmed diagnosis of SjS according to the both Japanese criteria36 and American-European Consensus Group (AECG) criteria37 were assessed in this study. Additionally, US scans were obtained from 100 non-SjS patients (21 males and 79 females with an average age of 61.1 years) who had a dry mouth but were definitively diagnosed as non-SjS according to above two criteria. All patients underwent US scans of both the PG and submandibular glands (SMG) (Figure 1). The 200 patients were randomly divided into training and test groups for the deep learning process. The training group consisted of 80 SjS patients and 80 non-SjS patients, whereas the test group consisted of 20 SjS patients and 20 non-SjS patients.
Figure 1.
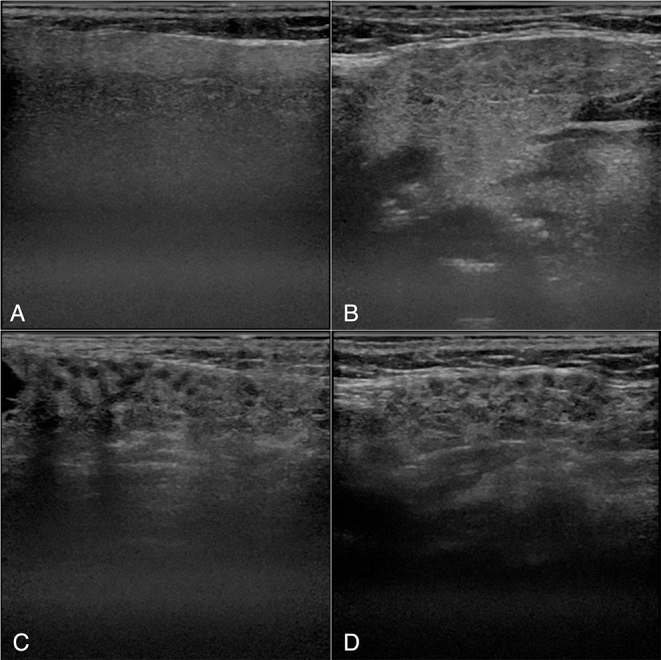
Examples of ultrasonography images. A and B: PG (A) and SMG (B) of a patient with non-SjS. C and D: PG (C) and SMG (D) of a patient with SjS. Inhomogeneous parenchyma characterized by multiple diffuse anechoic regions are observed. SjS, Sjögren’s syndrome.
US protocol
US images were taken using a diagnostic unit (Logiq 7: GE Healthcare, Tokyo, Japan) with a centre frequency of 12 megahertz. We extracted B-mode images of both the PG and SMG.
PG and SMG scans were performed according to our previous reports.22 PG was scanned with a coronal plane parallel to the posterior border of the ramus of the mandible. SMG was scanned with a sagittal plane parallel to the inferior border of the mandible.
Imaging data
The images used for deep learning were selected by an experienced radiologist (M.S) who have more than 20 years experiences of US examination. Selected images were downloaded from the hospital imaging database in DICOM format. Then a single radiologist (Y.K) converted them from DICOM format to PNG format. A five-fold cross-validation procedure was used to train the deep learning model for image classification.33 The data were randomly split into five groups. One group was used as a validation and testing set, and the residual data were used as training samples. We ensured that the training and testing data did not contain samples from the same image or the same patients while maintaining a balanced number of positive and negative samples in each group.
Data augmentation
Data augmentation was then performed on the training data images. Data augmentation is a frequently used technique for deep learning implementations that have a small number of clinical cases, and involves the number of data being synthetically increased by altering the brightness, contrast, rotation and sharpness of the images. The final total of 4000 augmented SjS images and 4000 augmented non-SjS images were included in the analysis.
Diagnostic performance of the deep learning system
The deep learning system was installed on an NVIDIA GeForce GTX GPU workstation (Nvidia Corp., Santa Clara, CA, USA) with 11 GB of memory. The training, validation and testing procedures were performed using VGG16 (https://arxiv.org/abs/1409.1556) architecture that was pretrained using the ImageNet dataset for transfer learning. The VGG16 architecture contained 16 layers, which consisted of 13 convolutional layers and three fully connected layers. The training and validation processes were conducted for 30 epochs until sufficient learning rates were obtained. The optimal parameters for creating the learning model were determined based on these training samples. Then test data were input into the learning model, and whether each image represented SjS or non-SjS was determined with its probability. The probability was automatically calculated by the deep learning machine for each image. After this process, the accuracy, sensitivity and specificity of the deep learning system were estimated. Furthermore, ROC analysis was performed to determine the AUC. Based on the probability of a positive evaluation, the evaluation results were divided into four groups: 0–25, 26–50, 51–75 and 76–100%. For each group, the sensitivity and 1-specificity were calculated and plotted.35
Diagnostic performance of radiologists
Three radiologists independently evaluated all images used in the deep learning analysis process (100 SjS and 100 non-SjS images). They were calibrated using 20 images (10 SjS and 10 non-SjS images) that were not used to create the learning models before they made an assessment. Radiologists who had less than 3-year‘ experience, who received no training, and had no experience in the interpretation of the appearance of SjS in PG and SMG in US images were defined as inexperienced radiologists. Each image was randomly evaluated using Microsoft PowerPoint, and the probability of SjS was classified on a four-point scale: 1, definitely SjS; 2, probably SjS; 3, probably non-SjS; and 4, definitely non-SjS. The evaluation was performed twice with two-month interval. To calculate the sensitivity, specificity, accuracy and observer agreements of diagnosing SjS, scores of 1 or 2 were regarded as SjS and scores of 3 or 4 were regarded as non-SjS. The diagnostic performance of the deep learning system and radiologists was compared using the AUC of ROC analysis. Intraobserver and interobserver agreements were assessed with κ values.
Statistical analysis
The differences between the AUC values were tested using chi-square analysis using the JMP statistical software package (version 13.0.0; SAS Institute, Cary, NC). The significance level was set to p < 0.05. The κ values of <0.20 corresponded to poor agreement, 0.21–0.40 to fair agreement, 0.41–0.60 to moderate agreement, 0.61–0.80 to good agreement and 0.81–1.00 to excellent agreement.
Results
The accuracy, sensitivity and specificity of the deep learning system for PG were 89.5, 90.0 and 89.0%, respectively (Table 1), which are the averages of results from five-fold cross-validation. Those for the inexperienced radiologists were 76.7, 67.0 and 86.3%, respectively, which are the averages of three inexperienced radiologists. The accuracy, sensitivity and specificity of the deep learning system for SMG were 84.0, 81.0 and 87.0%, respectively, and those for the inexperienced radiologists were 72.0, 78.0 and 66.0%, respectively. The AUC of the inexperienced radiologists was significantly different from that of the deep learning system for PG and SMG (p < 0.0001, p = 0.0005) (Table 2 and Figure 2). There was no significant difference between PG and SMG for both the deep learning system and inexperienced radiologists (p = 0.054, p = 0.340). Intraobserver agreement rates were good for both PG and SMG (κ = 0.80, 0.64). Interobserver agreement rates were good for PG (κ = 0.65) and moderate for SMG (κ = 0.51).
Table 1.
Diagnostic performance of deep learning and radiologists
| PG | SMG | |||
|---|---|---|---|---|
| Deep Learning | Inexperienced radiologists | Deep Learning | Inexperienced radiologists | |
| Accuracy (%) | 89.5 ± 4.5 | 76.7 ± 1.89 | 84.0 ± 7.2 | 72.0 ± 4.92 |
| Sensitivity (%) | 90.0 ± 10.6 | 67.0 ± 3.61 | 81.0 ± 10.8 | 78.0 + 7.00 |
| Specificity (%) | 89.0 + 10.8 | 86.3 + 7.02 | 87.0 ± 4.5 | 66.0 ± 8.00 |
Presented as mean ± standard deviation. PG, parotid gland; SMG, submandibular gland.
Table 2.
Comparison of the AUC for the diagnostic performance of deep learning and radiologists
| PG | SMG | |||
|---|---|---|---|---|
| Deep learning | Inexperienced radiologists | Deep learning | Inexperienced radiologists | |
| AUC | 0.948 (0.906–0.972) | 0.810 (0.774–0.841) | 0.894 (0.840–0.931) | 0.786 (0.750–0.819) |
| p < 0.0001* | p < 0.0005* | |||
AUC, area under the curve; PG, parotid gland; SMG, submandibular gland.
The 95% CI is shown in parentheses.
Figure 2.
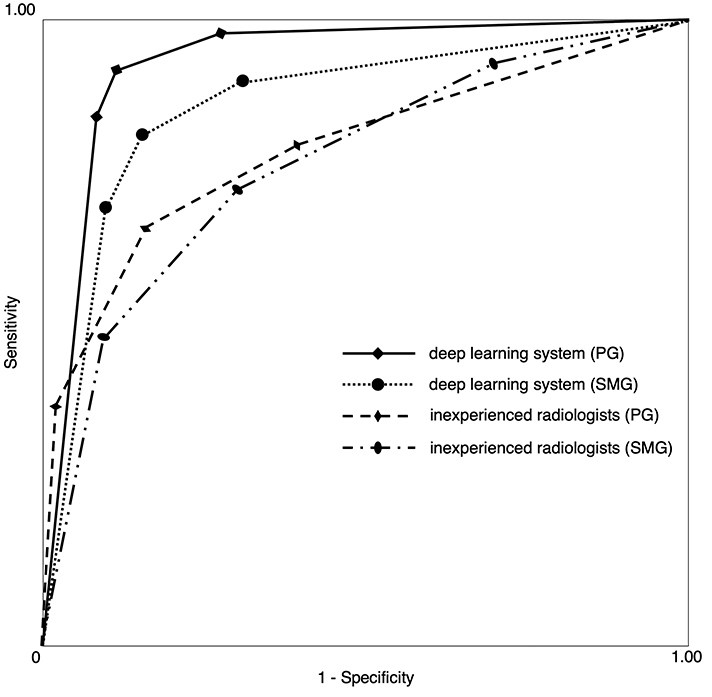
Receiver operating characteristic curves for the deep learning system and radiologists. The AUCs were 0.948, 0.894, 0.810 and 0.786 for the deep learning system (PG), deep learning system (SMG), inexperienced radiologists (PG) and inexperienced radiologists (SMG), respectively.
Discussion
US examination plays an important role in the diagnosis of head and neck diseases, and is particularly effective for the diagnosis of soft tissue lesions. SjS causes the destruction of the lacrimal gland and salivary gland, and the area where the destruction occurs is replaced with fat tissue. Previous studies have reported that this change can be detected by CT or MRI.3–5 However, CT and MRI are expensive and facilities are limited. Additionally, there are the disadvantages that CT exposes patients to radiation, and MRI takes time and cannot be used if the patient has an internal medical device that contains metal. Therefore, in recent years, there have been many studies that have diagnosed SjS using US.
Le et al16 evaluated how salivary gland US might improve the classification of patients. The study, which included US in the American College of Rheumatology (ACR)/European League Against Rheumatism (EULAR) classification criteria, increased sensitivity from 87.4 to 91.1%. However, most studies involve radiologists diagnosing US images. Diagnosing US images requires experience and is difficult for non-specialists.
In recent years, diagnosis using deep learning has been frequently studied in the field of diagnostic imaging, and its accuracy is being established. Stoffel et al32 evaluated the accuracy of deep learning software in the discrimination between phyllodes tumours (PT) and fibroadenomas (FA) in breast US images, and found that deep learning software differentiated between PT and FA with good diagnostic accuracy (AUC = 0.73) and a high negative predictive value (NPV = 100%). Radiologists demonstrated comparable accuracy (AUC 0.60–0.77) at a lower NPV (64–80%). When performing the readout together with the deep learning system recommendation, the radiologists‘ accuracy demonstrated a non-significant tendency to improve (AUC 0.75–0.87, p = 0.07). Additionally, Choi et al30 investigated whether a computer-aided diagnosis (CAD) system based on a deep learning framework (deep learning-based CAD) improved the diagnostic performance of radiologists in differentiating between malignant and benign masses in breast US images, and concluded that deep learning-based CAD improved radiologists’ diagnostic performance by increasing their specificity, accuracy and positive predictive value. We previously applied a deep learning system for the diagnosis of cervical lymph node metastasis on CE-CT scans of patients with oral cancer, and reported that the accuracy, sensitivity and specificity were 78.2, 75.4 and 81.0%, respectively. These values and the area under the ROC curve were the same as those achieved by experienced radiologists.33 Additionally, we compared the diagnostic ability of CT images for SjS patients using the learning system with that of experienced radiologists and inexperienced radiologists, and found that the accuracy, sensitivity and specificity of the deep learning system were 96.0, 100 and 92.0%, respectively; for experienced radiologists, the corresponding values were 98.3, 99.3 and 97.3%, respectively; and those for inexperienced radiologists were 83.5, 77.9 and 89.2%, respectively. The AUC of inexperienced radiologists was significantly different from those of the deep learning system and experienced radiologists. No difference was found between the deep learning system and experienced radiologists but there was a borderline p value (p = 0.058).35 The results of this study also demonstrated that the deep learning system had a high diagnostic ability. These results suggest that the deep learning system contributes to the support of the diagnosis and may improve the accuracy to the same level as a specialist, even if the radiologist is inexperienced.
Regarding the comparison between PG and SMG in the diagnosis of SjS in the US examination, Turnaoglu et al17 found that the sensitivity for PG was 92.0% and the specificity was 92.0%, and the sensitivity for SMG was 84.0% and the specificity was 92.0%. By contrast, Hofauer et al18 found that the sensitivity for PG was 70.2% and the specificity was 83.4%, and the sensitivity for SMG was 78.7% and the specificity was 79.1%. We found that the results for PG tended to be higher than those for SMG. This was presumably because the PG US image did not contain other structures than glandular parenchyma, such as muscle, lymph node and blood vessels, within the image, while the SMG US often contained such structures.
The observer’s assessment was only performed by the inexperienced radiologists and not the experienced radiologists. Differences may exist depending on experience, but we did not investigate this because the purpose of this study was to determine whether the diagnostic accuracy of non-specialist observers improves if they receive deep learning support. Although the education for the inexperienced radiologists should be planned to improve their performance even without a deep learning system, it would take more time in front of the US scanner.
The present study had several limitations. First, the number of patients was too small to finally determine the use of deep learning for US diagnosis of SjS. With increasing the number of patients, the performance would be improved. Second, the images of SjS were compared solely with those of non-SjS patients with dry mouth. Since salivary glands appearances change depending on various conditions and diseases, it is needed to discriminate SjS findings from those of healthy and other diseases, such as sialoadenitis. Third, we used only B-mode images. Since sonoelastography would be effective for SjS diagnosis as reported by Cindil et al,20 its performance by deep learning system should be verified in the future studies together with Doppler mode sonography. In addition, we did not use dynamic US images in this study. Since US examination is usually dynamic images, it may be better to use dynamic images. However, there are limitations on data capacity and computer performance, so it is not common for deep learning. For future research, fully automatic deep learning systems using dynamic US images should be planed.
One of future prospect regarding the diagnosis with deep learning is to create a fully automatic system. This requires a large number of images and collaboration with multiple facilities. Therefore, we propose to build a cooperative system with multiple facilities.
Conclusion
In this study, we demonstrated that a deep learning system has high US diagnostic ability for SjS when the static images were selected by an experienced radiologist. The AUC of the deep learning system was significantly higher than that of inexperienced radiologists. Therefore, this suggests that deep learning is clinically useful.
Footnotes
Acknowledgment: We thank Maxine Garcia, PhD, from Edanz Group (www.edanzediting.com/ac) for editing a draft of this manuscript.
Funding: This work was supported by JSPS KAKENHI Grant Number 18K17184 [Grant-in-Aid for Young Scientists].
Yoshitaka Kise and Mayumi Shimizu contributed equally to this work.
REFERENCES
- 1. Izumi M , Eguchi K , Nakamura H , Nagataki S , Nakamura T . Premature fat deposition in the salivary glands associated with Sjögren syndrome: Mr and CT evidence . AJNR Am J Neuroradiol 1997. ; 18 : 951 – 8 . [PMC free article] [PubMed] [Google Scholar]
- 2. Takagi Y , Sumi M , Sumi T , Ichikawa Y , Nakamura T . Mr microscopy of the parotid glands in patients with Sjogren's syndrome: quantitative Mr diagnostic criteria . AJNR Am J Neuroradiol 2005. ; 26 : 1207 – 14 . [PMC free article] [PubMed] [Google Scholar]
- 3. Sun Z , Zhang Z , Fu K , Zhao Y , Liu D , Ma X . Diagnostic accuracy of parotid CT for identifying Sjögren's syndrome . Eur J Radiol 2012. ; 81 : 2702 – 9 . doi: 10.1016/j.ejrad.2011.12.034 [DOI] [PubMed] [Google Scholar]
- 4. Kojima I , Sakamoto M , Iikubo M , Kumamoto H , Muroi A , Sugawara Y , et al. . Diagnostic performance of MR imaging of three major salivary glands for Sjögren's syndrome . Oral Dis 2017. ; 23 : 84 – 90 . doi: 10.1111/odi.12577 [DOI] [PubMed] [Google Scholar]
- 5. Chu C , Zhang H , Zhou N , Dou X , Li M , Liu S , et al. . Diffusional kurtosis imaging of parotid glands in Sjögren's syndrome: initial findings . J Magn Reson Imaging 2017. ; 46 : 1409 – 17 . doi: 10.1002/jmri.25697 [DOI] [PubMed] [Google Scholar]
- 6. Chikui T , Yamashita Y , Kise Y , Saito T , Okamura K , Yoshiura K . Estimation of proton density fat fraction of the salivary gland . Br J Radiol 2018. ; 18 : 20170671 . doi: 10.1259/bjr.20170671 [DOI] [PMC free article] [PubMed] [Google Scholar]
- 7. Devauchelle-Pensec V , Zabotti A , Carvajal-Alegria G , Filipovic N , Jousse-Joulin S , De Vita S . Salivary gland ultrasonography in primary Sjögren's syndrome: opportunities and challenges . Rheumatology. . [DOI] [PubMed] [Google Scholar]
- 8. Jousse-Joulin S , D'Agostino MA , Nicolas C , Naredo E , Ohrndorf S , Backhaus M , et al. . Video clip assessment of a salivary gland ultrasound scoring system in Sjögren’s syndrome using consensual definitions: an OMERACT ultrasound working group reliability exercise . Ann Rheum Dis 2019. ; 78 : 967 – 73 . doi: 10.1136/annrheumdis-2019-215024 [DOI] [PubMed] [Google Scholar]
- 9. Hammenfors DS , Valim V , Bica B , Pasoto SG , Lilleby V , Nieto-González JC , et al. . Juvenile Sjögren's syndrome: clinical characteristics with focus on salivary gland ultrasonography . Arthritis Care Res. . [DOI] [PMC free article] [PubMed] [Google Scholar]
- 10. Zhou M , Song S , Wu S , Duan T , Chen L , Ye J , et al. . Diagnostic accuracy of salivary gland ultrasonography with different scoring systems in Sjögren’s syndrome: a systematic review and meta-analysis . Sci Rep 2018. ; 8 : 17128 . doi: 10.1038/s41598-018-35288-5 [DOI] [PMC free article] [PubMed] [Google Scholar]
- 11. Luciano N , Ferro F , Bombardieri S , Baldini C . Advances in salivary gland ultrasonography in primary Sjögren's syndrome . Clin Exp Rheumatol 2018. ; 114 : 159 – 64 . [PubMed] [Google Scholar]
- 12. Guissa VR , Martinelli EL , Brandão L , Garcia LD , Provenza JR , Mendonça JA . Sonographic evaluation of salivary glands in juvenile Sjögren's syndrome . Acta Reumatol Port 2018. ; 43 : 61 – 5 . [PubMed] [Google Scholar]
- 13. Lee KA , Lee SH , Kim HR . Diagnostic and predictive evaluation using salivary gland ultrasonography in primary Sjögren's syndrome . Clin Exp Rheumatol 2018. ; 112 : 165 – 72 . [PubMed] [Google Scholar]
- 14. Kim J-W , Lee H , Park S-H , Kim S-K , Choe J-Y , Kim JK . Salivary gland ultrasonography findings are associated with clinical, histological, and serologic features of Sjögren’s syndrome . Scand J Rheumatol 2018. ; 47 : 303 – 10 . doi: 10.1080/03009742.2017.1374451 [DOI] [PubMed] [Google Scholar]
- 15. Mossel E , Delli K , van Nimwegen JF , Stel AJ , Kroese FGM , Spijkervet FKL , et al. . Ultrasonography of major salivary glands compared with parotid and labial gland biopsy and classification criteria in patients with clinically suspected primary Sjögren’s syndrome . Ann Rheum Dis 2017. ; 76 : 1883 – 9 . doi: 10.1136/annrheumdis-2017-211250 [DOI] [PubMed] [Google Scholar]
- 16. Le Goff M , Cornec D , Jousse-Joulin S , Guellec D , Costa S , Marhadour T , et al. . Comparison of 2002 AECG and 2016 ACR/EULAR classification criteria and added value of salivary gland ultrasonography in a patient cohort with suspected primary Sjögren’s syndrome . Arthritis Res Ther 2017. ; 19 : 269 . doi: 10.1186/s13075-017-1475-x [DOI] [PMC free article] [PubMed] [Google Scholar]
- 17. Turnaoglu H , Kural Rahatli F , Pamukcu M , Haberal KM , Uslu N . Diagnostic value of acustic radiation force impulse imaging in the assessment of salivary gland involvement in primary Sjögren’s sydrome . Med Ultrason 2018. ; 20 : 313 – 8 . doi: 10.11152/mu-1397 [DOI] [PubMed] [Google Scholar]
- 18. Hofauer B , Mansour N , Heiser C , Gahleitner C , Thuermel K , Bas M , et al. . Sonoelastographic modalities in the evaluation of salivary gland characteristics in Sjögren's syndrome . Ultrasound Med Biol 2016. ; 42 : 2130 – 9 . doi: 10.1016/j.ultrasmedbio.2016.04.011 [DOI] [PubMed] [Google Scholar]
- 19. Dejaco C , De Zordo T , Heber D , Hartung W , Lipp R , Lutfi A , et al. . Real-Time Sonoelastography of Salivary Glands for Diagnosis and Functional Assessment of Primary Sjögren’s Syndrome . Ultrasound Med Biol 2014. ; 40 : 2759 – 67 . doi: 10.1016/j.ultrasmedbio.2014.06.023 [DOI] [PubMed] [Google Scholar]
- 20. Cindil E , Oktar SO , Akkan K , Sendur HN , Mercan R , Tufan A , et al. . Ultrasound elastography in assessment of salivary glands involvement in primary Sjögren's syndrome . Clin Imaging 2018. ; 50 : 229 – 34 . doi: 10.1016/j.clinimag.2018.04.011 [DOI] [PubMed] [Google Scholar]
- 21. Pia L-J , Juan BM , Frank P , Angela AA , Jose G , Juan de Dios BS . Is sonoelastography a helpful method of evaluation to diagnose Sjögren's syndrome? Int J Rheum Dis 2019. ; 22 : 175 – 81 . doi: 10.1111/1756-185X.13373 [DOI] [PubMed] [Google Scholar]
- 22. Shimizu M , Weerawanich W . Sonographic diagnosis in the head and neck region: from an educational lecture presented at the 56th General assembly and annual scientific Congress of the Japanese Society for oral and maxillofacial radiology . Oral Radiol 2019. ; 35 : 101 – 26 . doi: 10.1007/s11282-018-0353-9 [DOI] [PubMed] [Google Scholar]
- 23. Shimizu M , Okamura K , Yoshiura K , Ohyama Y , Nakamura S , Kinukawa N . Sonographic diagnostic criteria for screening Sjögren’s syndrome . Oral Surgery, Oral Medicine, Oral Pathology, Oral Radiology, and Endodontology 2006. ; 102 : 85 – 93 . doi: 10.1016/j.tripleo.2005.09.012 [DOI] [PubMed] [Google Scholar]
- 24. Shimizu M , Okamura K , Kise Y , Takeshita Y , Furuhashi H , Weerawanich W , et al. . Effectiveness of imaging modalities for screening IgG4-related dacryoadenitis and sialadenitis (Mikulicz’s disease) and for differentiating it from Sjögren’s syndrome (SS), with an emphasis on sonography . Arthritis Res Ther 2015. ; 17 : 223 . doi: 10.1186/s13075-015-0751-x [DOI] [PMC free article] [PubMed] [Google Scholar]
- 25. Choi KJ , Jang JK , Lee SS , Sung YS , Shim WH , Kim HS , et al. . Development and validation of a deep learning system for staging liver fibrosis by using contrast Agent–enhanced CT images in the liver . Radiology 2018. ; 289 : 688 – 97 . doi: 10.1148/radiol.2018180763 [DOI] [PubMed] [Google Scholar]
- 26. Walsh SLF , Calandriello L , Silva M , Sverzellati N . Deep learning for classifying fibrotic lung disease on high-resolution computed tomography: a case-cohort study . The Lancet Respiratory Medicine 2018. ; 6 : 837 – 45 . doi: 10.1016/S2213-2600(18)30286-8 [DOI] [PubMed] [Google Scholar]
- 27. Song Q , Zhao L , Luo X , Dou X . Using deep learning for classification of lung nodules on computed tomography images . J Healthc Eng 2017. ; 2017 : 1 – 7 . doi: 10.1155/2017/8314740 [DOI] [PMC free article] [PubMed] [Google Scholar]
- 28. Gao XW , Hui R , Tian Z . Classification of CT brain images based on deep learning networks . Comput Methods Programs Biomed 2017. ; 138 : 49 – 56 . doi: 10.1016/j.cmpb.2016.10.007 [DOI] [PubMed] [Google Scholar]
- 29. Becker AS , Mueller M , Stoffel E , Marcon M , Ghafoor S , Boss A . Classification of breast cancer in ultrasound imaging using a generic deep learning analysis software: a pilot study . Br J Radiol 2018. ; 91 : 20170576 . [DOI] [PMC free article] [PubMed] [Google Scholar]
- 30. Choi JS , Han BK , Ko ES , Bae JM , Ko EY , Song SH , et al. . Effect of a deep learning framework-based computer-aided diagnosis system on the diagnostic performance of radiologists in differentiating between malignant and benign masses on breast ultrasonography . Korean J Radiol 2019. ; 20 : 749 – 58 . doi: 10.3348/kjr.2018.0530 [DOI] [PMC free article] [PubMed] [Google Scholar]
- 31. Fujioka T , Kubota K , Mori M , Kikuchi Y , Katsuta L , Kasahara M , et al. . Distinction between benign and malignant breast masses at breast ultrasound using deep learning method with convolutional neural network . Jpn J Radiol 2019. ; 37 : 466 – 72 . doi: 10.1007/s11604-019-00831-5 [DOI] [PubMed] [Google Scholar]
- 32. Stoffel E , Becker AS , Wurnig MC , Marcon M , Ghafoor S , Berger N , et al. . Distinction between phyllodes tumor and fibroadenoma in breast ultrasound using deep learning image analysis . European Journal of Radiology Open 2018. ; 5 : 165 – 70 . doi: 10.1016/j.ejro.2018.09.002 [DOI] [PMC free article] [PubMed] [Google Scholar]
- 33. Ariji Y , Fukuda M , Kise Y , Nozawa M , Yanashita Y , Fujita H , et al. . Contrast-Enhanced computed tomography image assessment of cervical lymph node metastasis in patients with oral cancer by using a deep learning system of artificial intelligence . Oral Surg Oral Med Oral Pathol Oral Radiol 2019. ; 127 : 458 – 63 . doi: 10.1016/j.oooo.2018.10.002 [DOI] [PubMed] [Google Scholar]
- 34. Ariji Y , Sugita Y , Nagao T , Nakayama A , Fukuda M , Kise Y , et al. .; in press Ct evaluation of extranodal extension of cervical lymph node metastases in patients with oral squamous cell carcinoma using deep learning classification . Oral Radiol 8 . doi: 10.1007/s11282-019-00391-4 [DOI] [PubMed] [Google Scholar]
- 35. Kise Y , Ikeda H , Fujii T , Fukuda M , Ariji Y , Fujita H , et al. . Preliminary study on the application of deep learning system to diagnosis of Sjögren's syndrome on CT images . Dentomaxillofac Radiol 2019. ; 22 : 20190019 . [DOI] [PMC free article] [PubMed] [Google Scholar]
- 36. Fujibayashi T , Sugai S , Miyasaka N , Hayashi Y , Tsubota K . Revised Japanese criteria for Sjögren’s syndrome (1999): availability and validity . Modern Rheumatology 2004. ; 14 : 425 – 34 . doi: 10.3109/s10165-004-0338-x [DOI] [PubMed] [Google Scholar]
- 37. Vitali C, et al. . Classification criteria for Sjogren's syndrome: a revised version of the European criteria proposed by the American-European consensus group . Ann Rheum Dis 2002. ; 61 : 554 – 8 . doi: 10.1136/ard.61.6.554 [DOI] [PMC free article] [PubMed] [Google Scholar]