

Abstract
Objective:
The aim of this study was to assess chronic inflammatory conditions of major salivary glands by ultrasound elastography.
Methods:
21 patients with chronic inflammatory conditions of major salivary glands and 21 healthy adult volunteers were included in this study. All participants underwent B-mode sonography and ultrasound elastography. The diagnostic performance of strain ratio and shear wave velocity was evaluated by sensitivity and specificity at the optimum cutoff point and the area under the receiver operating characteristic curve.
Results:
Cases showed statistically significant higher median strain ratio of parotid and submandibular gland than control group (p-value = 0.001). Total cases showed statistically significant higher median scores than control group (p-value < 0.001). At cut-off value of (1.13); diagnostic accuracy, sensitivity and specificity were 97.6, 95.2 and 100% respectively with AUROC 0.954 and confidence interval: 0.840–0.995. Cases showed statistically significant higher median shear wave velocity of parotid gland than control group (p-value = 0.022), with no statistically significant difference in submandibular gland in the two groups (p-value = 0.216). Total cases showed statistically significant higher median scores than control group (p-value < 0.001). At cut-off value of (23.5), diagnostic accuracy was 78.6% with a sensitivity of 81% and specificity of 76.2% with 0.819 AUROC and onfidence interval :0.669–0.920.
Conclusion:
Our initial experience suggests that elastography may be potentially useful for diagnosis of chronic inflammatory conditions of the major salivary glands. This conclusion needs to be further validated large sample studies.
Keywords: sialadenitis, ultrasonography, elastography
Introduction
The salivary glands are responsible for the production of saliva, a watery substance that contributes to the process of digestion during mastication, vocalization, buffering taste, and lubrication of mucous membrane. Salivary antibacterial compounds (Immunoglobulin A, lysozyme, and lactoferrin), various enzymes and the glycoproteins contained in saliva serve as one of the first lines of defense against infection. There are three pairs of major salivary glands: the parotid glands, the submandibular glands, and the sublingual glands. Human major salivary glands together they are responsible for 90% of the total saliva.1–4
Salivary gland diseases are ranging from the minor inflammatory conditions to a group of benign and malignant neoplasms. Most of the salivary gland disorders manifest themselves as the enlargement of the gland. Inflammation, which is the most common disease involving salivary glands, can occur as the common end point for a wide variety of conditions. It can be seen in sialolithiasis, sialadenosis and autoimmune salivary gland disorders like Sjogren's syndrome (SS). Depending on the cause, the presentation can be acute or chronic.5
Chronic sialadenitis is a localized condition of the salivary gland characterized by recurrent bouts of acute sialadenitis or incomplete resolution of an acute process (with subsequent glandular destruction). The chronic inflammatory process stimulates alterations in salivary chemistry and enzyme. Recurrent inflammatory reactions result in progressive acinar destruction, accompanied by a lymphocytic infiltrate, with fibrous replacement and sialectasis.6,7
Imaging is often warranted in patients with suspected salivary gland disease to help distinguish inflammatory from neoplastic processes and to help confirm the salivary gland as the origin of the process. To cover wide range of possible salivary glands diseases, it is important to choose the best imaging modality regarding cost, radiation, accuracy, reliability and patient satisfaction.2,8
Ultrasonography has several qualities making it an ideal first-line technique for salivary gland evaluation, including wide availability, low cost, non-invasiveness, easy reproducibility, and real-time assessment.9,10
Elasticity imaging by ultrasound elastography provides complementary information to conventional ultrasonography by adding stiffness as another measurable property to current ultrasonography imaging techniques.11
Ultrasound elastography (USE) is an imaging technology sensitive to tissue stiffness that was first described in the 1990s. It has been further developed and refined in recent years to enable quantitative assessments of tissue stiffness. Elastography methods take advantage of the changed elasticity of soft tissues resulting from specific pathological or physiological processes.12,13
Two basic concepts are currently used for USE: quasistatic, or strain-based (examination of the strain or deformation of a tissue due to a force), and dynamic, or shear wave-based (analysis of the propagation speed of a shear wave) depending on the type of tissue displacement that is tracked in tissues which have been subjected to a deforming force and in the measurement of the subsequent tissue displacement. Quasistatic and dynamic elastography may be complementary because of their different physical properties, artifacts, limitations and the clinical applications for which they are best suited.14–17
The aim of this study was to assess chronic inflammatory conditions of major salivary glands by ultrasound elastography.
Patients and methods
Patients and control participants
The research proposal approved from the Research Ethics Committee of faculty of dentistry, Minia University under approval number 283. Written, informed consent was obtained for all participants. Between June 2018 and July 2019, 21 patients, mean age 47.6 (10.7), with chronic inflammatory conditions were enrolled in this study. We included 2 patients with sialolithiasis, 4 patients with chronic recurrent parotitis and 15 patients suffering from SS. The study population included 47.6% females and 52.4% males. All of them were referred by the clinic of Minia University hospital and hospital of Faculty of Dentistry, Minia University. Inclusion criteria were patients with history of chronic salivary gland disease, and pre-auricular swelling and pain, patients suspected to chronic inflammatory salivary gland lesions irrespective of the age and socioeconomic status, patients complaining from xerostomia, stones and patients with any signs or symptoms of chronic inflammatory salivary gland lesions. Exclusion criteria were acute inflammation of the major salivary gland of interest salivary gland tumors. During the same period of time, 21 healthy adult volunteers (mean age 46.9 (8.6)) were recruited as the control group. All cases and control groups were examined by B-mode ultrasound and ultrasound elastography.
Sonographic procedures
The Toshiba Aplio 500 ultrasound system was used for ultrasonography examination. Parotid and submandibular glands were carefully examined in transverse and longitudinal dimensions with an 8–12 MHz linear array transducer. The conventional sonographic examinations, which comprised grayscale and Color Doppler sonography were performed by a single radiologist (15 years' /experience) on all patients. Patients were scanned in the supine position during free-breathing, with subtle neck hyperextension and tilted to the opposite side of the evaluation.
Sonoelastography examination
Conventional strain elastography
First, strain elastography was performed (The elastographic mode was activated by using the “elast” button). The monitor was divided into three parts as right, left, and bottom parts. The right part showed the routine grayscale image; the left part showed the elastogram, and the bottom part showed the pressure wave (Figure 1). To obtain elastograms and data, the transducer was used by making regular and slight compressions and decompressions that could be followed by the sinusoidal wave at the bottom of the screen. After approximately 10–12 regular waves were obtained, the image was frozen for measurements.
Figure 1.
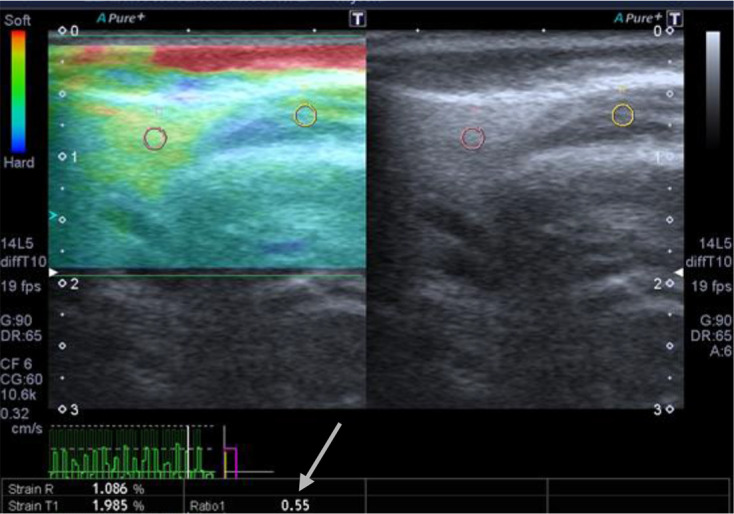
Elastogram. The right part showed routine grayscale image; the left part showed the elastogram, and the bottom part showed the pressure wave. Arrow indicates the resultant strain ratio.
After freezing, the elastogram was color coded (red, green, blue) bar (feedback bar) on the side of the image, the bar displays the tissue deformation in real time, with blue indicating hardness and red indicating softness. We used region of interest (ROI) circles (4 mm in diameter) to measure the strain ratio of the glands. We used two ROIs: a reference ROI, that was fixed to the adjacent soft tissue, avoiding vascular structures and the periphery of the gland where increased stiffness is normally found (fixed to the masseter muscle in case of parotid glands and subcutaneous tissues in case of submandibular glands) and target ROI that was chosen by the experienced sonographer as being most representative of the whole glandular parenchyma. Measurements were done in the decompression phase, which was below the baseline. The elastographic software presented a semiquantitative value as a numeric strain ratio.
Shear wave elastography
After a sonographic examination, the elastographic mode was implemented. Ultrasound elastography of the salivary glands was performed with Toshiba Aplio 500 ultrasound with an 8–12 MHz linear-array transducer, with the patient in supine position.
The tip of the transducer was covered with 5 mm of ultrasound gel and placed on the skin smoothly without compressing the tissue. Shear-wave ultrasound elastography is based on the automatic generation and analysis of transient shear waves. Acoustic radiation force impulse (ARFI) pulses (low-frequency ultrasound pulse which is tailored to optimize the momentum transfer to tissue, can be used to create the displacement of tissue) used to generate shear waves. After the acoustic radiation force impulse pulse is applied, data acquisition occurs for a short period of time. During the data acquisition period, the movement of the shear wave is monitored by B-mode imaging. A single small ROI, which should be positioned in a homogeneous region of tissue, away from structural boundaries, can be placed in the tissue of interest where the stiffness value is desired. The resultant shear wave velocity (SWV) is then calculated and displayed; it usually represents the mean value of the shear wave speeds within the ROI. The detailed elasticity values (in kPa) were collected on elastograms.
The static and dynamic images of the sonogram and elastogram were recorded digitally to be analyzed later (Figures 1–2).
Figure 2.
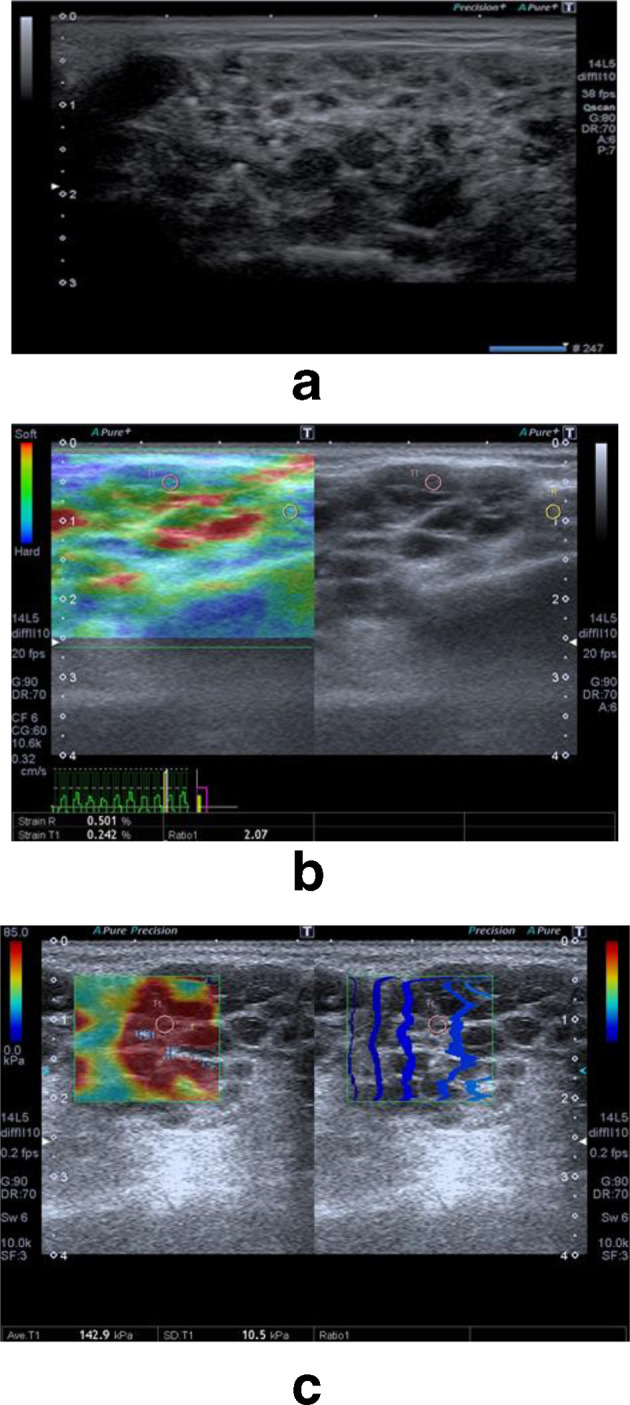
Ultrasound and elastography evaluation in a patient suffering from Sjogren's syndrome. a–b-mode grayscale evaluation revealed mildly enlarged parotid gland with heterogeneous echo-pattern. Its parenchyma is seen studded with multiple hypoechoic cystic areas with hyperechoic foci (arrows). b—Strain elastogram with strain ratio of 2.07. c—Shear wave elastogram with shear wave velocity of 142.9.
Sonogram interpretation
Sonograms were scored independently by three radiologists, who did not participate in the acquisitions of sonographic and elastographic images and were blinded to clinical results. Sonograms were interpreted using simplified semi-quantitative salivary glands' ultrasound scores (SGUS) previously described.18 Ultrasonography scoring system consisted of five parameters; parenchymal echogenicity graded from (0–1), parenchymal inhomogeneity graded from (0–3), presence of hypoechoic areas graded from (0–3), presence of hyperechoic foci graded from (0–3), clearance of salivary gland posterior borders graded from (0–3). Finally, the SGUS were calculated by summation of the grades of the five parameters described above.18
Elastogram interpretation
Absolute values are generated; therefore, no additional scoring was required.
Statistical analysis
Numerical data were explored for normality by checking the data distribution and using Kolmogorov–Smirnov and Shapiro–Wilk tests. All data showed non-normal (non-parametric) distribution except for age data which showed normal (parametric) distribution. Non-parametric data were presented as median and range values while parametric data were presented as mean and standard deviation (SD) values. For non-parametric data; Mann–Whitney U test was used to compare between the two groups. For parametric data; Student’s t-test was used to compare between mean age values in the two groups. Kruskal–Wallis test was used to study the association between causes of inflammation and elastography findings. Qualitative data were presented as frequencies and percentages. χ2 test was used to compare between the two groups. Interobserver reliability was assessed using Cronbach’s α reliability coefficient and intraclass correlation coefficient (ICC). Receiver operating characteristic (ROC) curve was constructed to determine the cut-off values of different modalities for differentiation between the two groups. ROC curve analysis was performed with MedCalc v. 11.3 for Windows (MedCalc Software bvba). The significance level was set at p ≤ 0.05. Statistical analysis was performed with IBM SPSS Statistics for Windows, v. 23.0. Armonk, NY: IBM Corp. Spearman’s correlation coefficient was used to determine the correlation between different variables.
Results
There was no statistically significant difference between mean age values in the two groups. There was also no statistically significant difference between gender distributions in the two groups. Cases showed statistically significantly higher prevalence of examined parotid glands than control group which showed higher prevalence of examined submandibular glands.
Difference of ultrasonography score between patients and healthy controls
Cases showed statistically significantly higher median ultrasonography scores of parotid glands than control group (p-value = 0.019, effect size = 1.119). Cases showed statistically significantly higher median ultrasonography scores of submandibular glands than control group (p-value = 0.017, effect size = 1.177). As regards the total ultrasonography scores; cases showed statistically significantly higher median ultrasonography scores than control group (p-value < 0.001, effect size = 0.962). Ultrasonography showed 81% diagnostic accuracy with a sensitivity of 71.4% and specificity of 90.5% (Table 1). There was very good interobserver agreement regarding ultrasonography with Cronbach’s α value of 0.932. Intraclass correlation was 0.911.
Table 1.
Comparison between SGUS scores in the two groups
| Gland | Case | Control | p-value | Effect size (d) | ||||
|---|---|---|---|---|---|---|---|---|
| Median | Min. | Max. | Median | Min. | Max. | |||
| Parotid | 5 | 2 | 11 | 0 | 0 | 9 | 0.019a | 1.119 |
| Submandibular | 4.5 | 1 | 8 | 3 | 0 | 3 | 0.017a | 1.177 |
| Total SGUS | 5 | 1 | 11 | 2 | 0 | 9 | <0.001a | 0.962 |
SGUS, salivary glands' ultrasound scores.
Significant at p ≤ 0.05
Diagnostic performance of strain ratio for separating patients and healthy controls
Cases showed statistically significantly higher median strain ratio of parotid gland than control group (p-value = 0.001, effect size = 1.874). Cases showed statistically significantly higher median strain ratio of submandibular gland than control group (p-value = 0.001, effect size = 2.449). As regards the total scores; cases showed statistically significantly higher median scores than control group (p-value < 0.001, effect size = 2.463). At cut-off value of 1.13; strain ratio showed 97.6% diagnostic accuracy with a sensitivity of 95.2% and specificity of 100% with area under the curve (AUC) of ROC 0.954 and confidence interval was 0.840–0.995 (Table 2).
Table 2.
Comparison between strain ratios in the two groups
| Gland | Case | Control | p-value | Effect size (d) | ||||
|---|---|---|---|---|---|---|---|---|
| Median | Min. | Max. | Median | Min. | Max. | |||
| Parotid | 1.95 | 0.25 | 3.66 | 0.81 | 0.26 | 1.13 | 0.001a | 1.874 |
| Submandibular | 1.75 | 1.32 | 3.22 | 0.74 | 0.25 | 1.11 | 0.001a | 2.449 |
| Total score | 1.76 | 0.25 | 3.66 | 0.78 | 0.25 | 1.13 | <0.001a | 2.463 |
Significant at p ≤ 0.05
Diagnostic performance of SWV values for separating patients and healthy controls
Cases showed statistically significantly higher median SWV of parotid gland than control group (p-value = 0.022, effect size = 1.119). There was no statistically significant difference between median SWV of submandibular gland in the two groups (p-value = 0.216, effect size = 0.576). After combining results of parotid and submandibular glands; cases showed statistically significantly higher median scores than control group (p-value < 0.001, effect size = 1.301). At cut-off value of 23.5; SWV showed 78.6% diagnostic accuracy with a sensitivity of 81% and specificity of 76.2% with AUC of 0.819 (confidence interval of 0.669–0.920) (Table 3).
Table 3.
Comparison between SWV in the two groups
| Gland | Case | Control | p-value | Effect size (d) | ||||
|---|---|---|---|---|---|---|---|---|
| Median | Min. | Max. | Median | Min. | Max. | |||
| Parotid | 49 | 27 | 173.7 | 18.8 | 9.31 | 63.3 | 0.022a | 1.119 |
| Submandibular | 18.85 | 11.4 | 32.4 | 12.21 | 4.8 | 69.9 | 0.216 | 0.576 |
| Total score | 41.5 | 11.4 | 173.7 | 16 | 4.8 | 69.9 | <0.001a | 1.301 |
SWV, shear wave velocity.
Significant at p ≤ 0.05
There was a statistically significant direct (positive) correlation between SGUS, strain ratio and SWV. An increase in SGUS is associated with an increase in strain ratio and SWV and vice versa (Table 4).
Table 4.
Spearman’s correlation coefficients for the correlation between ultrasonography, strain and shear wave elastography
| Correlation coefficient | p-value | |
|---|---|---|
| SGUS and strain ratio | 0.477 | 0.001a |
| SGUS and SW velocity | 0.479 | 0.001a |
| Strain ratio and SW velocity | 0.526 | <0.001a |
SGUS, salivary glands' ultrasound scores; SW, shear wave.
Significant at p ≤ 0.05
Association between causes of inflammation and elastography findings in cases group
There was no statistically significant difference between median strain ratio values among cases with different causes of inflammation (p-value = 0.178, effect size = 0.075). There was no statistically significant difference between median SW velocity values among cases with different causes of inflammation (p-value = 0.102, effect size = 0.142) (Table 5).
Table 5.
Comparison between strain ratios and SW velocities in cases with different causes of inflammation
| Elastography | Chronic recurrent parotitis | Sjogren’s syndrome | Stone | P-value | Effect size (η Squared) | ||||||
|---|---|---|---|---|---|---|---|---|---|---|---|
| Median | Min. | Max. | Median | Min. | Max. | Median | Min. | Max. | |||
| Strain ratio | 1.23 | 0.25 | 3.66 | 1.75 | 1.21 | 3.21 | 2.96 | 2.7 | 3.22 | 0.178 | 0.075 |
| SW velocity | 49.8 | 27 | 173.7 | 41.6 | 11.4 | 160.6 | 16.9 | 15.7 | 18.1 | 0.102 | 0.142 |
SW, shear wave.
Significant at p ≤ 0.05.
Discussion
Ultrasonographic findings may be non-specific. For example, B-mode images of salivary glands in patients with hepatitis C, human immunodeficiency virus infection, or sarcoidosis may show multiple hypoechoic foci or cystic areas, mimicking the sonographic features of patients with primary SS (pSS).19,20
Ultrasound elastography is a booming field in tissue imaging. The present study points to the possible diagnostic significance of shear wave elastography in the field of chronic inflammatory conditions of the major salivary glands. Ariji et al21 suggested that sonographic elastography can be useful for evaluation the pathological status of the salivary lesions, such as sialolithiasis, sialadenitis, and SS.
In this study, ultrasonography scores for cases group was higher than that of the control group and this agrees with Chen et al 20 who showed that the difference in ultrasonography scores between SS patients and controls were highly significant. Both studies used Hocevar et al18scoring system.
There was very good interobserver agreement regarding ultrasonography Cronbach’s α value of 0.932. Intraclass correlation was 0.911. In a study of Delli et al22 interobserver reliability for ultrasonography scores was good to excellent with ICCs of 0.84.
This study revealed no statistically significant difference in median strain ratio and SWV values among cases with different causes of chronic inflammation. This can be attributed to that whatever the cause of the chronic inflammatory process, it stimulates progressive acinar destruction, accompanied by a lymphocytic infiltrate, with fibrous replacement and sialectasis, leading to increased stiffness and thus higher elasticity values in patients with chronic inflammatory conditions.
In this study, cases group showed statistically significant difference in strain ratio between cases and control group which agrees with a study conducted by Cindil et al23 who concluded that there was statistically significant differences found between the control group and the subjects with pSS for each gland regarding the average strain ratios. Cindil et al 23 clarified that the loss of elasticity (high strain ratio) can be explained by the increase of lymphocyte-rich mononuclear cells, forming focal aggregates and take the place of the normal glandular tissue by the increased viscosity and loss of volume in the gland structure as a result of the function loss the acinar-ductal epithelium due to its destruction.23
On the contrary, Hofauer et al24 and Tatar et al 25 reported non-significant results in a group of SS patients compared with the control group for strain elastography imaging. Hofauer et al 24 suggested that strain elastography can be influenced in two different ways. On the one hand, variation in elastogram generation can influence the reproducibility (various amounts of applied pressure or patient movement during generation of the elastogram); on the other hand, the generated elastogram has to be interpreted, which leaves further room for variation. The scoring system used might also have an effect.
In this study, strain ratio showed sensitivity of 95.2% and specificity of 100% which is higher than that reported in Hofauer et al24 and Dejaco et al 26 studies who used elasticity scores for elastogram interpretation. The study conducted by Cindil et al 23 on subjects with pSS, sensitivity and specificity were 66.7 and 85.7% respectively upon using elasticity scores, but higher sensitivity and specificity achieved with strain ratio. Cindil et al 23 suggested that the measurement of strain ratio significantly increases both the sensitivity and specificity for both glands.
This study showed that there was statistically significant difference in SWV values between cases with different chronic inflammatory conditions and controls this agrees with studies conducted by Wierzbicka et al27 and Kaluzny et al 28 that evaluated glands with chronic inflammatory sialadenitis, and detected higher SWV values in patients when compared with healthy controls. In addition, Chen et al20 and Zengel et al 29 found that the mean SWV values for SS patients and patients with sialolithiasis respectively were statistically higher than that of controls.
This study showed no statistically significant difference between median SWV of submandibular gland in the two groups. This is consistent with the findings of Samier-Guérina et al 30 who showed higher SWV values in pSS group than in healthy control group for only parotid gland with no significantly different SWV values at the submandibular glands. On the other hand, studies conducted by Badea et al,31 Chen et al20 and Zengel et al 29 on diffuse salivary gland alterations reported significantly higher SWV values in cases group of submandibular glands. This may be attributed to our small sample size.
In this study, SWV showed with a sensitivity of 81% and specificity of 76.2%. Knopf et al 32 presented same sensitivity but lower specificity rates respectively 81 and 67% when compared with this study. Chen and colleagues reported sensitivity and specificity (88.2 and 96.0% respectively) higher than this study. In addition, this study revealed cut-off for pathological inflammatory conditions as larger than 23.5 kPa with AUC (0.819) confidence interval: 0.669–0.920) which also similar to Knopf et al 32 in terms of AUC 0.84 but with confidence interval: 0.78–0.90.
The difference in SWV values between the parotid gland (median 49 Kpa) and submandibular gland (median 18.85 kPa) in cases group is worthy of note. This can be explained by Dankof et al 33 who suggested that the lymphocytic infiltration, disappearance of the acini, and the development of fibrosis might be more marked and/or occur earlier in the parotid glands than in the submandibular glands. Therefore, the parotid gland appears to be the preferred salivary gland for SWV evaluation of pSS.
In this study, there was a statistically significant direct (positive) correlation between salivary glands' ultrasound scores, strain ratio and SWV this agrees with Kimura-Hayama et al34 who found a positive correlation between the SWV and the B-mode morphological score (s = 0.53), between parotids (s = 0.58) and submandibular glands (s = 0.50). This may be explained by the increased lymphocytic infiltration which is expressed sonographically by the increased hypoechoic areas and heterogeneity of the chronically inflamed salivary gland with subsequent increase in salivary gland ultrasound score and increased parenchyma stiffness which expressed in increased SWV and strain ratio.
This study has some limitations. The small sample size. Also, each cause of chronic inflammation was not analyzed separately. Further studies with larger sample size are needed to confirm findings of this study. In addition, further investigations will be needed to correlate the elastographic characteristics of chronically inflamed salivary glands with clinical findings such as severity and duration of complaint.
In conclusion, elastography might be a complement to ultrasonography primarily to confirm certain tissue characteristics suggested by ultrasound. The initial experience suggests that strain and shear wave elastography may be potentially useful for assessment of chronic inflammatory conditions of the major salivary glands. Applying both elastographic techniques (strain and shear wave) concomitantly is instructive.
Contributor Information
Yasmein Maher Elbeblawy, Email: yasmm42199@gmail.com.
Maha Eshaq Amer Mohamed, Email: mahaeshaq2@yahoo.com.
REFERENCES
- 1. Carpenter GH . The secretion, components, and properties of saliva . Annu Rev Food Sci Technol 2013. ; 4 : 267 – 76 . doi: 10.1146/annurev-food-030212-182700 [DOI] [PubMed] [Google Scholar]
- 2. Atkinson C , Fuller J , Huang B . Cross-Sectional imaging techniques and normal anatomy of the salivary glands . Neuroimaging Clin N Am 2018. ; 28 : 137 – 58 . doi: 10.1016/j.nic.2018.01.001 [DOI] [PubMed] [Google Scholar]
- 3. Pedersen AM , Bardow A , Jensen SB , Nauntofte B . Saliva and gastrointestinal functions of taste, mastication, swallowing and digestion . Oral Dis 2002. ; 8 : 117 – 29 . doi: 10.1034/j.1601-0825.2002.02851.x [DOI] [PubMed] [Google Scholar]
- 4. Amano O , Mizobe K , Bando Y , Sakiyama K . Anatomy and histology of rodent and human major salivary glands: overview of the Japan salivary gland society-sponsored workshop. Acta Histochem and metaplasia . Virchows Arch 2012. ; 440 : 519 – 26 . [DOI] [PMC free article] [PubMed] [Google Scholar]
- 5. Cvetinović M , Jović N , Mijatović D . Evaluation of ultrasound in the diagnosis of pathologic processes in the parotid gland . Journal of Oral and Maxillofacial Surgery 1991. ; 49 : 147 – 50 . doi: 10.1016/0278-2391(91)90102-R [DOI] [PubMed] [Google Scholar]
- 6. Rogers J , McCaffrey TV . Inflammatory disorders of the salivary glands . : Haughey B. H , Robbins K. T , Cummings otolaryngol, Head Neck Surg . 5th ed . Philadelphia: : Mosby-Elsevier; ; 2010. . . 1151 – 61 . [Google Scholar]
- 7. Walvekar RR , Loehn BC , Wilson MN . Anatomy and physiology of the salivary glands . : Eibling D. E , Newlands S. D , Bailey’s head neck surgery – otolaryngol . 5th ed . Baltimore: : Lippincott Williams & Wilkins; ; 2014. . . 691 – 700 . [Google Scholar]
- 8. Afzelius P , Nielsen M-Y , Ewertsen C , Bloch KP . Imaging of the major salivary glands . Clin Physiol Funct Imaging 2016. ; 36 : 1 – 10 . doi: 10.1111/cpf.12199 [DOI] [PubMed] [Google Scholar]
- 9. Bialek EJ , Jakubowski W , Zajkowski P , Szopinski KT , Osmolski A . Us of the major salivary glands: anatomy and spatial relationships, pathologic conditions, and pitfalls . RadioGraphics 2006. ; 26 : 745 – 63 . doi: 10.1148/rg.263055024 [DOI] [PubMed] [Google Scholar]
- 10. Carotti M , Ciapetti A , Jousse-Joulin S , Salaffi F . Ultrasonography of the salivary glands: the role of grey-scale and colour/power Doppler . Clin Exp Rheumatol 2014. ; 32 : 61 – 70 . [PubMed] [Google Scholar]
- 11. Kamaya A , Machtaler S , Safari Sanjani S , Nikoozadeh A , Graham Sommer F , (Pierre) Khuri-Yakub BT , et al. . New technologies in clinical ultrasound . Semin Roentgenol 2013. ; 48 : 214 – 23 . doi: 10.1053/j.ro.2013.03.009 [DOI] [PubMed] [Google Scholar]
- 12. Gennisson J-L , Deffieux T , Fink M , Tanter M . Ultrasound elastography: principles and techniques . Diagn Interv Imaging 2013. ; 94 : 487 – 95 . doi: 10.1016/j.diii.2013.01.022 [DOI] [PubMed] [Google Scholar]
- 13. Shiina T , Nightingale KR , Palmeri ML , Hall TJ , Bamber JC , Barr RG , et al. . WFUMB guidelines and recommendations for clinical use of ultrasound elastography: Part 1: basic principles and terminology . Ultrasound Med Biol 2015. ; 41 : 1126 – 47 . doi: 10.1016/j.ultrasmedbio.2015.03.009 [DOI] [PubMed] [Google Scholar]
- 14. Bhatia KSS , Lee YYP , Yuen EHY , Ahuja AT . Ultrasound elastography in the head and neck. Part I. basic principles and practical aspects . Cancer Imaging 2013. ; 13 : 253 – 9 . doi: 10.1102/1470-7330.2013.0026 [DOI] [PMC free article] [PubMed] [Google Scholar]
- 15. Garra BS . Elastography: history, principles, and technique comparison . Abdom Imaging 2015. ; 40 : 680 – 97 . doi: 10.1007/s00261-014-0305-8 [DOI] [PubMed] [Google Scholar]
- 16. Dietrich C , Barr R , Farrokh A , Dighe M , Hocke M , Jenssen C , et al. . Strain Elastography - How To Do It? Ultrasound Int Open 2017. ; 03 : E137 – 49 . doi: 10.1055/s-0043-119412 [DOI] [PMC free article] [PubMed] [Google Scholar]
- 17. Ozturk A , Grajo JR , Dhyani M , Anthony BW , Samir AE . Principles of ultrasound elastography . Abdom Radiol 2018. ; 43 : 773 – 85 . doi: 10.1007/s00261-018-1475-6 [DOI] [PMC free article] [PubMed] [Google Scholar]
- 18. Hočevar A , Ambrožič A , Rozman B , Kveder T , Tomšič M , Tomsic M . Ultrasonographic changes of major salivary glands in primary Sjögren's syndrome. diagnostic value of a novel scoring system . Rheumatology 2005. ; 44 : 768 – 72 . doi: 10.1093/rheumatology/keh588 [DOI] [PubMed] [Google Scholar]
- 19. Zengel P , Schrötzlmair F , Reichel C , Paprottka P , Clevert DA . Sonography: the leading diagnostic tool for diseases of the salivary glands . Seminars in Ultrasound, CT and MRI 2013. ; 34 : 196 – 203 . doi: 10.1053/j.sult.2012.11.012 [DOI] [PubMed] [Google Scholar]
- 20. Chen S , Wang Y , Zhang G , Chen S . Combination of salivary gland ultrasonography and virtual touch quantification for diagnosis of Sjögren's syndrome: a preliminary study . Biomed Res Int 2016. ; 2016 : 2793898 . doi: 10.1155/2016/2793898 [DOI] [PMC free article] [PubMed] [Google Scholar]
- 21. Ariji Y , Nakayama M , Nishiyama W , Ariji E . Applications of sonographic elastography to the oral and maxillofacial region . J Radiol Radiat Ther 2014. ; 2 : 1049 . [Google Scholar]
- 22. Delli K , Arends S , van Nimwegen JF , Dijkstra PU , Stel AJ , Spijkervet FKL , et al. . Ultrasound of the major salivary glands is a reliable imaging technique in patients with clinically suspected primary Sjögren's syndrome . Ultraschall Med 2018. ; 39 : 328 – 33 . [DOI] [PubMed] [Google Scholar]
- 23. Cindil E , Oktar SO , Akkan K , Sendur HN , Mercan R , Tufan A , et al. . Ultrasound elastography in assessment of salivary glands involvement in primary Sjögren's syndrome . Clin Imaging 2018. ; 50 : 229 – 34 . doi: 10.1016/j.clinimag.2018.04.011 [DOI] [PubMed] [Google Scholar]
- 24. Hofauer B , Mansour N , Heiser C , Gahleitner C , Thuermel K , Bas M , et al. . Sonoelastographic modalities in the evaluation of salivary gland characteristics in Sjögren's syndrome . Ultrasound Med Biol 2016. ; 42 : 2130 – 9 . doi: 10.1016/j.ultrasmedbio.2016.04.011 [DOI] [PubMed] [Google Scholar]
- 25. Gunes Tatar I , Altunoglu H , Kurt A , Altunoglu A , Ozturk MA , Erten S , et al. . The role of salivary gland elastosonography in Sjögren's syndrome: preliminary results . Int J Rheum Dis 2014. ; 17 : 904 – 9 . doi: 10.1111/1756-185X.12503 [DOI] [PubMed] [Google Scholar]
- 26. Dejaco C , De Zordo T , Heber D , Hartung W , Lipp R , Lutfi A , et al. . Real-Time Sonoelastography of Salivary Glands for Diagnosis and Functional Assessment of Primary Sjögren’s Syndrome . Ultrasound Med Biol 2014. ; 40 : 2759 – 67 . doi: 10.1016/j.ultrasmedbio.2014.06.023 [DOI] [PubMed] [Google Scholar]
- 27. Wierzbicka M , Kaluzny J , Ruchata M , Stajgis M , Kipez T . Szyfter W sonoelastography a useful adjunct for parotid gland ultrasound assessment in patients suffering from chronic inflammation . Med Sci Monit 2014. ; 20 : 2311 – 7 . [DOI] [PMC free article] [PubMed] [Google Scholar]
- 28. Kałużny J , Wierzbicka M , Kopeć T , Szyfter W , Szczepanek-Parulska E , Stangierski A , et al. . The sonoelastography of major salivary glands in chosen pathological conditions . Otolaryngol Pol 2012. ; 66 ( 4 Suppl ): 60 – 6 . [DOI] [PubMed] [Google Scholar]
- 29. Zengel P , Schrötzlmair F , Schwarz F . For evaluation et al. elastography: a new diagnostic tool of obstructive diseases of the salivary glands; primary results . Clin Hemorheol Microcirc 2012. ; 50 : 91 – 9 . [DOI] [PubMed] [Google Scholar]
- 30. Samier-Guérin A , Saraux A , Gestin S , Cornec D , Marhadour T , Devauchelle-Pensec V , et al. . Can ARFI elastometry of the salivary glands contribute to the diagnosis of Sjögren's syndrome? Joint Bone Spine 2016. ; 83 : 301 – 6 . doi: 10.1016/j.jbspin.2015.11.002 [DOI] [PubMed] [Google Scholar]
- 31. Badea AF, et al. . ARFI quantitative elastography of the submandibular glands. normal measurements and the diagnosis value of the method in radiation submaxillitis . Med Ultrason 2013. ; 15 : 173 – 9 . doi: 10.11152/mu.2013.2066.153.afb1ats2 [DOI] [PubMed] [Google Scholar]
- 32. Knopf A , Hofauer B , Thürmel K , Meier R , Stock K , Bas M , et al. . Diagnostic utility of Acoustic Radiation Force Impulse (ARFI) imaging in primary Sjoegren`s syndrome . Eur Radiol 2015. ; 25 : 3027 – 34 . doi: 10.1007/s00330-015-3705-4 [DOI] [PubMed] [Google Scholar]
- 33. Dankof A , Morawietz L , Feist E . Labial salivary gland biopsy in Sjögren’s syndrome . Pathologe 2006. ; 6 : 416 – 21 . [DOI] [PubMed] [Google Scholar]
- 34. Kimura-Hayama E , Criales-Vera S , Azpeitia-Espinosa L , Pacheco-Molina C , Reyes E , Lima G , et al. . Elastographic ultrasound: an additional image tool in Sjögren's syndrome . Int J Rheum Dis 2018. ; 21 : 1293 – 300 . doi: 10.1111/1756-185X.13292 [DOI] [PubMed] [Google Scholar]