

Abstract
Full-grown oocytes are transcriptionally quiescent. Following maturation and fertilization, the early stages of embryonic development occur in the absence (or low levels) of transcription that results in a period of development relying on maternally derived products (e.g., mRNAs and proteins). Two critical steps occur during the transition from maternal to embryo control of development: maternal mRNA clearance and embryonic genome activation with an associated dramatic reprogramming of gene expression required for further development. By combining an RNA polymerase II inhibitor with RNA sequencing, we were able not only to distinguish maternally derived from embryonic transcripts in bovine preimplantation embryos but also to establish that embryonic gene activation is required for clearance of maternal mRNAs as well as to identify putative transcription factors that are likely critical for early bovine development.
Keywords: cow, embryo genome activation, maternal-to-embryo transition, preimplantation embryo, microRNA, gene expression, transcription factor
RNAseq coupled with transcriptional inhibition suggests that gene expression is critical for degradation of maternal mRNAs and that KLF family members regulate expression of ~ 50% of embryonically expressed genes.
Introduction
The oocyte-to-embryo transition (OET) in mammals results in transforming a highly differentiated oocyte into totipotent blastomeres of early cleavage-stage preimplantation embryos [1, 2]. Two diametrically opposed processes drive this transition, sculpting developmental changes in the transcriptome, namely, transcription and mRNA degradation. Full-grown oocytes are transcriptionally quiescent but following maturation and fertilization transcription from the embryonic genome initiates and results in a dramatic reprogramming of gene expression that is essential for continued development. Embryonic gene activation (EGA) occurs in a species-specific timing. In mice, EGA takes place during the 2-cell stage, in pigs during the 4-cell stage, in humans during the 4-to-8-cell stage, and in bovine during the 8-to-16-cell stage [2–6]. EGA occurs progressively with a minor phase proceeding the major phase during which the dramatic reprogramming of gene expression occurs [1, 2]. Degradation of maternal mRNAs temporally overlaps with EGA and is likely critical for OET by eliminating transcripts that confer oocyte identity. In mice, degradation of most maternal mRNAs initiates during oocyte maturation and is essentially complete by the end of the 2-cell stage [7–9], i.e., when major EGA has occurred.
The respective contributions of transcription and mRNA degradation to the transcriptome of early-cleavage stage bovine embryos remain poorly described. In particular, the identity of the initial embryonically expressed transcription factors that further drive reprogramming of gene expression is essentially nonexistent, as is the relationship, if any, between EGA and degradation of maternal mRNAs. Although alpha-amanitin has been used to determine the timing of EGA in bovine embryos [4, 10, 11] and RNAseq to describe the transcriptome of bovine oocytes and early embryos [12, 13], remarkably, the combination of these two approaches has not been previously reported to define the set of embryonically expressed genes. A study using microarrays employed alpha-amanitin to identify embryonically expressed genes, but the data set does not have the coverage afforded by RNAseq [4].
By combining RNAseq with alpha-amanitin treatment, we identified genes that are embryonically expressed during the major phase of EGA in bovine preimplantation embryos. We focused on embryonically expressed transcription factors that could drive reprogramming gene expression during EGA and noted that members of the KLF gene family could be critical for EGA. In addition, we find that embryonic transcription is needed to clear maternal mRNAs during OET.
Materials and methods
Oocyte collection, maturation, in-vitro fertilization, and embryo culture
Bovine ovaries were collected from a local abattoir and cumulus–oocytes complexes (COCs) were aspirated from selected follicles (3–8 mm in diameter). COCs with intact cumulus cells were washed and placed in maturation medium for 24 h after which in-vitro fertilization was performed as previously described [14]. Inseminated eggs were denuded, and presumptive zygotes were cultured in KSOM (ZEBV-100; Zenith Biotech, Blue Bell, PA) supplemented with 4 mg/mL of bovine serum albumin (BSA) under mineral oil at 38.5 °C, 5% CO2, and 5% O2. MII eggs, based on presence of first polar body, were collected 24 h after maturation. Eight-to-16-cell-stage embryos (cultured in the presence or absence of alpha-amanitin) were collected 70–72 h postfertilization. Embryos treated with alpha-amanitin were cultured the same way as the nontreated control embryos except that 50 μg/mL of alpha-amanitin (A2263, Sigma-Aldrich, St. Louis, MO) was present in the KSOM medium throughout the culture period.
RNA extraction and preparation of sequencing libraries
RNAseq from MII eggs and 8-to-16-cell embryos (cultured in the presence or absence of alpha-amanitin) was performed as previously described [15, 16]. Briefly, 3–4 groups of 10 matured oocytes and in-vitro-produced embryos were used for each stage of development that was analyzed. RNA was extracted using the Picopure RNA isolation kit (Applied Biosystems, Carlsbad, CA) and amplified using the Ovation RNASeq V2 kit (NuGen, San Carlos, CA). Libraries were constructed using the TruSeq RNA Sample Prep Kit (Illumina, San Diego, CA).
Sequencing, read mapping, and gene expression analysis
Libraries were submitted to the Vincent J. Coates Genomics Sequencing Laboratory (UC Berkeley, CA) for single 50-base pair read sequencing on an Illumina HiSeq 2000 machine. Raw sequence data is available at https://www.ncbi.nlm.nih.gov/sra/PRJNA587162. Sequence reads were mapped to the bovine UMD3.1 genome assembly and Ensembl 78 genebuild annotation using CLC Genomics Workbench 7.0 (CLCbio, Aarhus, DK). Reads per million mapped reads per kilobase of exon model (RPKM) values were calculated for each transcript and the levels of expression compared among groups using EdgeR with FDR correction for multiple testing. Only transcripts with RPKM > 0.4 were considered expressed and used for further analysis [15, 17].
Gene ontology classification
Gene ontology (GO) analysis was performed using DAVID v6.8 [18, 19].
Transcription factor analysis
Enriched transcription factor binding motifs were obtained by running the program findMotifs.pl provided in the Hypergeometric Optimization of Motif EnRichment (HOMER) platform [20].
RNA extraction, reverse transcription, and quantitative real-time PCR
Groups of 20 eggs/embryos were placed in minimal volume of PBS containing 1 mg/mL of PVA, flash frozen in liquid nitrogen, and stored at −80 °C. RNA was extracted using the Quick-RNA MicroPrep Kit (Zymo Research R1050). Extracted RNA was eluted in 25 μL of DNase/RNase-free water, and stored at −80 °C prior to reverse transcription. For reverse transcription, reactions containing 0.5 μL of random primer, 0.5 μL of Oligo(dT) primer, 1.0 μL of water, and 10 μL of RNA were placed in a prewarmed thermal cycler for 5 min at 65 °C and then on ice for at least 1 min. Then, 4 μL of 5x first-strand buffer, 2 μL of 0.1 M DDT, and 1 μL of RNase OUT were added to the first reaction and placed in a prewarmed thermal cycler for 2 min at 25 °C. One μL of SuperScript II (200 U) (18064014, Invitrogen, Carlsbad, CA) was then added and the mix was placed in a thermal cycler for 10 min at 25 °C, 50 min at 42 °C, and 15 min at 70 °C. Finally, 1 μL (2 U) of Escherichia coli RNase H was added to each reaction, and reactions were incubated for 20 min at 37 °C. Reverse transcription products were diluted 10-fold in water for qPCR and stored at −20 °C.
Quantitative real-time PCR was performed using a 7500 Fast Real Time PCR System (Applied Biosystems, Carlsbad, CA) in an optical 96-well plate with a final reaction volume of 20 μL containing 10 μL of PowerUp SYBR Green Master Mix (A25742, Applied Biosystems, Carlsbad, CA), 0.25 μL of forward primer, 0.25 μL of reverse primer (10 μM stock of each primer; Table S1), 4.5 μL of water, and 5 μL of cDNA sample. Each sample, from at least four biological replicates, was run in duplicate for each gene. Relative transcript abundance was calculated using the comparative CT method (ΔΔCT method) normalized to GAPDH [21], whose expression is unaffected by alpha-amanitin treatment based on RNA-seq results (RPKM mean ± S.D.: MII = 9.8 ± 0.4; 8/16-cell = 8.9 ± 0.3; and 8/16-cell alpha-amanitin = 10.0 ± 0.3). Groups were compared using a one-way paired t-test.
Results
Developmental changes in transcriptome from MII eggs to 8-to-16-cell embryos and identification of embryonically expressed genes
We first defined the transcriptomes of MII eggs and 8-to-16-cell embryos and the effect of inhibiting transcription to identify the set of embryonically expressed genes during the major phase of bovine EGA (Figure 1). An average of 16 250 403 reads per sample were used for expression analysis of MII eggs, 8-to-16-cell, and 8-to-16-cell+alpha-amanitin embryos (Table 1). Principal component analysis indicated a high similarity between replicates. The first principal component explained 37.7% of the biological variation among samples, whereas the second component explained 19.6%. The replicates grouped together and the sample types were clearly separated from each other (Figure 1B). A total of 10 601 protein-coding transcripts were detected in MII eggs and 10 608 in 8-to-16-cell embryos representing about 43% of the total 24 616 annotated genes in the bovine genome. Most transcripts (n = 9,541) were shared between MII eggs and embryos, whereas some transcripts were exclusively expressed in MII eggs (n = 1060, mean RPKM = 0.9) or 8-to-16-cell embryos (n = 1067, mean RPKM = 1.9) (Figure 1C).
Figure 1.

Global transcriptome assessment of MII eggs and 8-to-16-cell embryos. A) Experimental design to identify embryonic genes expressed during early bovine development. RNA sequencing was performed using pools of 10 oocytes/embryos (3–4 replicates per group). B) Principal component analysis was done for all developmental stages with their replicates (MII, n = 4; 8-to-16-cell, n = 3; and 8-to-16-cell+alpha-amanitin, n = 4). Each point represents a replicate. Developmental stages were clearly separated from each other and replicates within stages were grouped together. C) Venn diagram comparing all expressed genes (RPKM > 0.4) between MII eggs and 8-to-16-cell embryos. 10 601 and 10 608 genes were found expressed in MII eggs and 8-to-16-cell embryos, respectively, representing ~ 39% of the total number of known genes. D) Gene ontology analysis of genes expressed in MII eggs and 8-to-16-cell embryos. Transcripts detected only in MII eggs (n = 1,060) or 8-to-16-cell embryos (n = 1,067) were subjected to GO analysis. Bar plot shows the −log10 of the P-value of the selected GO terms for DAVID biological processes.
Table 1.
Number of reads used for expression analysis. Number of uniquely mapped reads per replicate for MII eggs (MII), 8-to-16-cell, and 8-to-16-cell+alpha-amanitin embryo.
| Sample ID | Replicate number | Number of uniquely mapped reads |
|---|---|---|
| MII eggs | 1 | 11 663 472 |
| 2 | 11 210 179 | |
| 3 | 25 044 153 | |
| 4 | 20 489 084 | |
| 8-to-16-cell embryos | 1 | 10 602 231 |
| 2 | 13 513 675 | |
| 3 | 17 653 123 | |
| 8-to-16-cell+alpha | 1 | 10 837 573 |
| -amanitin 1 embryos | 2 | 16 692 348 |
| 3 | 22 501 894 | |
| 4 | 20 874 106 |
Differential gene expression analysis identified 3048 up-regulated and 2169 down-regulated transcripts from MII eggs to 8-to-16-cell embryos (FC > 2, FDR < 0.01). alpha-Amanitin treatment resulted in down-regulation of 3480 transcripts and increased relative abundance for 2291 transcripts when compared to controls. When compared to MII eggs, the abundance of 961 transcripts was increased and that of 1852 transcripts were decreased in alpha-amanitin-treated embryos (Figure 2A). Similar trends in expression of long noncoding RNAs in eggs and embryos, as well as the effects of alpha-amanitin on their expression, were also noted (Figure S1; Table S2).
Figure 2.

Analysis of differentially expressed genes across developmental stages. A) Diagram showing the number of differentially expressed genes (FDR < 0.01, FC > 2) in oocytes and embryos. Up-headed arrows indicate the number of transcripts with increased relative abundance between stages and down-headed arrows show decreased abundance. B) Venn diagram showing the comparison among relative abundance of transcripts that increased from MII to 8–16 cell stage ± alpha-amanitin and those whose relative abundance in 8–16-cell embryos were decreased when alpha-amanitin was included in the culture medium. Some 2459 transcripts were products of transcription from the embryonic genome, whereas 719 transcripts were exclusively of maternal origin. C) Gene ontology analysis of newly transcribed embryonic and maternally derived transcripts. GO analysis was done on the 2459 embryonic genes and 719 maternal genes. Bar plot shows the −log10 of the P-value of the selected GO terms for biological processes using DAVID.
Transcripts whose abundance increased from MII eggs to 8-to-16-cell stage embryos in our study significantly overlapped those that increased from MII eggs to the 16-cell stage embryo reported in Graf et al. [12], with 83% of the transcripts identified in their data also found in our data set (Figure S2A). Moreover, 39% of the alpha-amanitin-sensitive transcripts found in our study were also identified as embryonic transcripts (n = 5,027) based on the three approaches used by Graf et al. (Figure S2B) [12].
GO analysis of transcripts present in MII eggs but not in 8-to-16 cell embryos showed enrichment in terms related to cellular metabolic processes such as secretion (e.g., RAB3A, SYT4, EXOC7), ion transport (e.g., SLC9A9, GABRB3, ATP12A), response to hormone stimuli (e.g., ERBB4, TGFBR2, IGFBP2), protein maturation (e.g., CPE, ADAMTS3, PCSK5), and embryo development (e.g., NODAL, HOXD9, GATA4) (Figure 1D). GO terms for transcripts present in the 8-to-16-cell embryo stage but not in MII eggs (n = 1,067) were mostly related to embryonic development such as embryonic morphogenesis (e.g., HIRA, BMP7, MYC), blastocyst formation (e.g., EOMES, HOPX, NLE1), and chordate embryo development (e.g., HOXB4, OVOL2, GATA6) (Figure 1D and Table S3).
Relative contributions of maternal and embryonic mRNAs to transcriptome during EGA
Treatment of embryos with alpha-amanitin before EGA allows distinguishing between maternal and embryonic transcripts by comparing the pool of maternal transcripts in matured oocytes to that in 8-to-16-cell stage embryos that develop in the presence or absence of alpha-amanitin. Using this approach, we found 2459 transcripts derived from the embryonic genome and 719 transcripts that were of maternal origin (Figure 2B). GO analysis of the embryonic transcripts revealed enrichment in terms containing genes normally associated with embryonic development such as gastrulation, tube morphogenesis, mesoderm formation, and formation of the primary germ layer (Figure 2C). GO terms related to the maternal transcripts revealed terms related to negative regulation of gene expression and positive regulation of apoptosis, and GO terms that were shared between maternal and embryonic transcripts were related to chromatin shaping and epigenetic modifications (Figure 2C, Tables S4&5). Taken together, these results suggest that maternal transcripts shape the epigenome and sculpt the embryo’s transcriptome in preparation for EGA, possibly by allowing the early embryo to express transcripts that are directly related to progression of the early embryo’s developmental program.
Degradation of maternal transcripts requires EGA
In mouse, transcriptome analysis by microarrays suggests that inhibiting EGA with alpha-amanitin results in incomplete degradation of maternal transcripts that are normally degraded during OET [22]. To ascertain whether this linkage between EGA and maternal mRNA degradation is evolutionarily conserved, we assessed the effect of inhibiting EGA on degradation of maternal transcripts. We first compared the 2169 transcripts whose relative abundance decreased from MII to 8-to-16-cell stage with the 2291 transcripts whose relative abundance was increased in alpha-amanitin-treated embryos relative to controls. We found 970 transcripts affected when EGA was inhibited and 1199 transcripts whose reduction was not affected when EGA was inhibited (Figure 3A). We then compared the 2169 transcripts whose relative abundance decreased between the MII egg and 8-to-16-cell embryo stage with the 1852 transcripts whose relative abundance decreased between the MII egg to 8-to-16-cell stage in the presence of alpha-amanitin embryos and found that the decrease in relative abundance of 1404 transcripts required transcription, whereas the decrease in relative abundance of 765 transcripts did not (Figure 3B). By merging the previous two results, we found that the decreased relative abundance of 905 transcripts required transcription (Figure 3C), while the decreased relative abundance of 700 transcripts did not (Figure 3D). Thus, 41.72% (905/2169) of the transcripts whose relative abundance decreased from the MII egg to 8–16-cell embryo stage were affected by transcription. Therefore, the linkage between EGA and maternal mRNA degradation observed in mouse appears conserved in bovine.
Figure 3.
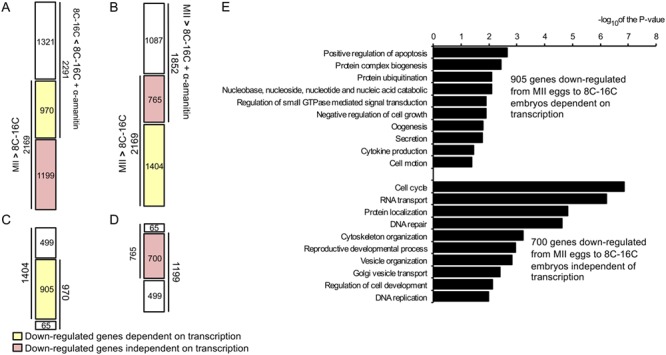
Effect of transcriptional activity on transcript turnover during MET. A) Comparison between the 2169 down-regulated transcripts from MII to 8-to-16-cell stage with the 2291 up-regulated transcripts when the embryos were cultured in the presence of alpha-amanitin. Transcripts whose relative abundance decrease was linked to transcription (n = 970) are denoted in yellow, whereas transcripts whose relative abundance decrease was not linked to transcription are denoted in red (n = 1199). B) Comparison between the 2169 down-regulated transcripts between MII eggs and 8-to-16-cell stage with the 1852 down-regulated transcripts from MII eggs to 8-to-16-cell+alpha-amanitin embryos. Transcripts whose relative abundance was linked to transcription (n = 1404) are denoted in yellow, whereas transcripts whose relative abundance decrease was not linked to transcription are denoted in red (n = 765). C) Comparison between the transcripts found in A and B to be down-regulated only in the presence of transcription from the embryonic genome (970 and 1,404). D) Comparison between the transcripts found in A and B to be down-regulated independent of transcription from the embryonic genome (1,199 and 765). E) Gene ontology analysis of transcripts whose relative abundance decreased from MII to 8-to-16-cell stage was linked or not linked to transcription. GO analysis was performed on the 905 transcripts whose decrease relative abundance from MII to the 8–16-cell stage was linked to transcription and on the 700 transcripts whose decrease relative abundance from MII to the 8–16-cell stage was not linked to transcription. Bar plot shows the −log10 of the P-value of the selected GO terms for biological processes using DAVID.
GO analysis showed that the 905 transcripts whose relative abundance decreased from MII eggs to 8-to-16-cell stage was affected by EGA were enriched in terms related to embryo survival such as apoptosis (e.g., TRAF2, TP63, GCH1, MSX2, BCL10), negative regulation of growth (e.g., MEN1, ACVR1B, SIPA1), as well as oogenesis (e.g., NPM2, NOBOX, GDF9, PDE3A, BMPR1B, TRIP13) (Figure 3E, Table S6A). For transcripts whose relative abundance decreased during this period of development unlinked to EGA, significant GO terms were enriched in more general cellular processes such as cell cycle (e.g., XRCC2, KNTC1, TTK, MEI1), RNA transport (e.g., NUP133, UPF1, NUP160, HHEX), DNA repair (e.g., XRCC5, XRCC4, SHPRH, UPF1) and replication (e.g., UPF1, CINP, CENPF, LIG4), and reproductive developmental process (e.g., RBP4, MEI1, BBS2, SPAG6) (Figure 3E, Table S6B).
Role of transcription factors during EGA
Critical to understanding the molecular basis for reprogramming gene expression that occurs during EGA is identifying transcription factors (TF) involved in this process. Although the identity of such transcription factors is slowly emerging, e.g., the human DUX4 gene and its mouse orthologous DUX playing central roles in the onset of embryonic transcription in those species [23–25], their numbers remain quite limited, e.g., NFYA [26]. As a first step to identify transcription factors involved in EGA in bovine embryos, we analyzed promoter regions of the 2459 alpha-amanitin-sensitive genes and found 29 enriched TF-binding motifs (Table S7). We then checked the presence of TFs, capable of binding these 29 domains in the embryonic (n = 2,459) and maternal gene lists (n = 719) and found 10 TFs capable of binding the 29 enriched motifs (KLF4, KLF5, KLF9, OTX2, YY1, GSC, EHF, ETV2, CREBZF, and SMAD3). Nine of these genes, excluding SMAD3, showed an increase in transcript abundance between MII eggs and 8C-16C embryos (Figure 4A), and four (KLF4, KLF5, GSC, OTX2) were validated by qRT-PCR (Figure 4B). Noteworthy is that these nine embryonic TFs could target 63% of all the genes activated during EGA (1548/2459) and 3 out of 9 were members of the same gene family (KLF4, KLF5, and KLF9). These three members of the KLF gene family could target 47% (1152/2459) of all the genes in the list, with KLF5 being the most significant member targeting 560 genes that the other two members did not target (Figure 4C). Overall, KLF5 is the TF with the most target genes on the gene list, targeting 58% of the genes. In addition, KLF5 and GSC (albeit its expression is quite low) were the only TFs not expressed in MII eggs, suggesting that they are likely the earliest embryonic TFs directing reprogramming of gene expression during EGA in bovine preimplantation embryos.
Figure 4.

Transcription factors with enriched target motifs in the 2459 embryonic gene list. A) Transcription factors that could bind to the 29 enriched motifs were examined in the 719 maternal and 2459 embryonic gene lists. RPKM was used to measure expression levels. Red, nonexpressed. Green, expressed. B) Target gene overlap of three members of the KLF gene family. KLF5, KLF9, and KLF4 transcription factors can target 1141, 503, and 342 genes in the 2459 early embryonic gene list, respectively. C) Quantitative RT-PCR validation of transcription factor expression during bovine EGA. KLF4, KLF5, GSC, and OTX2 were expressed in 8-cell embryos, and their expression was blocked by alpha-amanitin. DGCR8, whose expression is not up-regulated during EGA, was used as a control gene. a,b,c; different letters represent P < 0.05. x,y,z; different letters represent P < 0.1.
Discussion
Our data obtained by combining alpha-amanitin and RNAseq not only correlate well with previously published data—many of the transcripts detected in our study were also detected in other studies [4, 12, 13]—but also complement and extend those findings. We identified 2093 embryonically expressed genes not detected in a previous and extensive study on bovine EGA [12]. A likely explanation for this difference is that we used alpha-amanitin to identify embryonically expressed transcripts, whereas the previous study used three indirect strategies to identify such embryonically expressed transcripts, namely, transcripts first detected after fertilization, expression of paternal SNPs, and detection of introns, i.e., primary transcripts [12].
We also noted that inhibiting EGA and the associated reprogramming of gene expression inhibits degradation of many maternal mRNAs. A similar role for transcription is also observed in mouse [22, 27, 28], suggesting that this linkage is evolutionary conserved. In mouse, degradation of maternal mRNAs initiates with the onset of oocyte maturation [2, 9] and entails recruitment of dormant maternal mRNAs that encode critical components of the RNA degradation machinery, e.g., DCP2, CNOT7 [7, 8]. Remarkably, degradation of many mRNAs is incomplete, e.g., the mRNA is deadenylated [29, 30] but the bulk of the transcript remains, with complete mRNA degradation occurring during the 2-cell stage. Whether a similar situation occurs during oocyte maturation and preimplantation development in bovine is not known and could differ given the dramatic differences in timing of major EGA between mouse and bovine, i.e., 2-cell in mouse and 8–16-cell in bovine.
We observed that degradation of many but not all maternal transcripts requires transcription, which implies some degree of transcript-specific degradation. In nonmammalian animal species such as Danio rerio (Zebrafish) and Drosophila melanogaster (fruit fly), zygotic miRNAs play key roles in degradation of maternal mRNAs during OET [31–33]. In mouse, miRNAs do not target mRNAs for degradation in oocytes [34, 35] but do following genome activation [36]; the molecular basis for this deficiency is not known [37]. Whether miRNAs can target mRNAs for degradation in preimplantation bovine embryos prior to EGA is also unknown. A recent study using small-RNA sequencing identified a significant increase in abundance of a large set of miRNAs in 8-cell embryos when compared to MII eggs [38]. Previous studies on miRNA expression during bovine preimplantation development observed three expression patterns: essentially constant abundance (e.g., miR-10b and miR-424 [39]), a progressive increase in abundance presumably due to zygotic expression (e.g., miR-21, miR-130a [40], miR-125, miR-127, miR-145, miR-208, miR-496 [41], and miR-196a [42]), and a steady decrease abundance likely due to degradation of maternally derived miRNAs (e.g., miR-205, miR-150, miR-122, miR-96, miR-146a, miR-146b-5p [43], and miR-25 [41]). Of potential interest is that on an absolute copy number basis, miRNA-320, a member of the DGCR8/DROSHA-independent class, was one of the highest expressed miRNAs from a subset of 81 miRNAs identified in bovine oocytes and early embryos [44]. Future functional studies, e.g., preventing zygotic miRNA expression or using miRNA antagomirs, will address the role of miRNAs on maternal mRNA degradation during OET.
A number of maternally derived transcription factors critical for EGA in mouse have been identified, e.g., BRG1 [45] and NFYA [26]. Besides double homeobox (Dux in mice, DUX4 in human species) [23–25], little is known about the identity of transcription factors that are the initial products of embryonic transcription, which then regulate expression of other embryonically expressed genes, i.e., so-called pioneer factors [46, 47]. We identified 10 transcription factors (see above), nine of which are expressed during EGA in bovine embryos—SMAD3 is not expressed—and can bind to and potentially regulate 63% of ~ 2500 alpha-amanitin-sensitive transcripts we identified in this study.
The role of the transcription factors identified in this study in bovine preimplantation development is poorly understood and as such they are interesting candidates for future studies. For example, although a role for KLF5 is known in mouse—Klf5−/− mice arrest at the blastocyst stage, knock-down of KLF5 induces ESC differentiation [48–50], and KLF5 regulates expression of Pou5f1 and Nanog pluripotency genes in ICM [49]—little is known about the role of KLF5, which potentially regulates expression of 58% of the embryonically expressed transcripts, in preimplantation bovine development.
The results reported here provide a comprehensive dataset of transcript changes associated with embryonic genome activation, which can be mined to identify specific genes that would be the subject for further studies. Our findings also provide a firm foundation for pursuing studies that address the role of specific transcription factors in the reprogramming of gene expression, in particular members of the KLF family, noting that they were recently implicated in human EGA [51].
Supplementary Material
Acknowledgments
The authors thank all lab members for productive conversations during the course of conducting the studies described in this manuscript.
References
- 1. Abe K, Yamamoto R, Franke V, Cao M, Suzuki Y, Suzuki MG, Vlahovicek K, Svoboda P, Schultz RM, Aoki F. The first murine zygotic transcription is promiscuous and uncoupled from splicing and 3′ processing. EMBO J 2015; 34:1523–1537. [DOI] [PMC free article] [PubMed] [Google Scholar]
- 2. Svoboda P, Franke V, Schultz RM. Sculpting the Transcriptome during the oocyte-to-embryo transition in mouse. Curr Top Dev Biol 2015; 113:305–349. [DOI] [PubMed] [Google Scholar]
- 3. Braude P, Bolton V, Moore S. Human gene expression first occurs between the four- and eight-cell stages of preimplantation development. Nature 1988; 332:459–461. [DOI] [PubMed] [Google Scholar]
- 4. Misirlioglu M, Page GP, Sagirkaya H, Kaya A, Parrish JJ, First NL, Memili E. Dynamics of global transcriptome in bovine matured oocytes and preimplantation embryos. Proc Natl Acad Sci U S A 2006; 103:18905–18910. [DOI] [PMC free article] [PubMed] [Google Scholar]
- 5. Telford NA, Watson AJ, Schultz GA. Transition from maternal to embryonic control in early mammalian development: A comparison of several species. Mol Reprod Dev 1990; 26:90–100. [DOI] [PubMed] [Google Scholar]
- 6. Whitworth K, Springer GK, Forrester LJ, Spollen WG, Ries J, Lamberson WR, Bivens N, Murphy CN, Mathialagan N, Green JA, Prather RS. Developmental expression of 2489 gene clusters during pig embryogenesis: An expressed sequence tag project. Biol Reprod 2004; 71:1230–1243. [DOI] [PubMed] [Google Scholar]
- 7. Ma J, Flemr M, Strnad H, Svoboda P, Schultz RM. Maternally recruited DCP1A and DCP2 contribute to messenger RNA degradation during oocyte maturation and genome activation in mouse. Biol Reprod 2013; 88:11. [DOI] [PMC free article] [PubMed] [Google Scholar]
- 8. Ma J, Fukuda Y, Schultz RM. Mobilization of dormant Cnot7 mRNA promotes Deadenylation of maternal transcripts during mouse oocyte maturation. Biol Reprod 2015; 93:48. [DOI] [PMC free article] [PubMed] [Google Scholar]
- 9. Su YQ, Sugiura K, Woo Y, Wigglesworth K, Kamdar S, Affourtit J, Eppig JJ. Selective degradation of transcripts during meiotic maturation of mouse oocytes. Dev Biol 2007; 302:104–117. [DOI] [PMC free article] [PubMed] [Google Scholar]
- 10. De Sousa PA, Watson AJ, Schultz GA, Bilodeau-Goeseels S. Oogenetic and zygotic gene expression directing early bovine embryogenesis: A review. Mol Reprod Dev 1998; 51:112–121. [DOI] [PubMed] [Google Scholar]
- 11. Frei RE, Schultz GA, Church RB. Qualitative and quantitative changes in protein synthesis occur at the 8-16-cell stage of embryogenesis in the cow. J Reprod Fertil 1989; 86:637–641. [DOI] [PubMed] [Google Scholar]
- 12. Graf A, Krebs S, Zakhartchenko V, Schwalb B, Blum H, Wolf E. Fine mapping of genome activation in bovine embryos by RNA sequencing. Proc Natl Acad Sci U S A 2014; 111:4139–4144. [DOI] [PMC free article] [PubMed] [Google Scholar]
- 13. Jiang Z, Sun J, Dong H, Luo O, Zheng X, Obergfell C, Tang Y, Bi J, O'Neill R, Ruan Y, Chen J, Tian XC. Transcriptional profiles of bovine in vivo pre-implantation development. BMC Genomics 2014; 15:756. [DOI] [PMC free article] [PubMed] [Google Scholar]
- 14. Ross PJ, Rodriguez RM, Iager AE, Beyhan Z, Wang K, Ragina NP, Yoon SY, Fissore RA, Cibelli JB. Activation of bovine somatic cell nuclear transfer embryos by PLCZ cRNA injection. Reproduction 2009; 137:427–437. [DOI] [PubMed] [Google Scholar]
- 15. Chitwood JL, Rincon G, Kaiser GG, Medrano JF, Ross PJ. RNA-seq analysis of single bovine blastocysts. BMC Genomics 2013; 14:350. [DOI] [PMC free article] [PubMed] [Google Scholar]
- 16. Iqbal K, Chitwood JL, Meyers-Brown GA, Roser JF, Ross PJ. RNA-seq transcriptome profiling of equine inner cell mass and trophectoderm. Biol Reprod 2014; 90:61. [DOI] [PMC free article] [PubMed] [Google Scholar]
- 17. Ramskold D, Wang ET, Burge CB, Sandberg R. An abundance of ubiquitously expressed genes revealed by tissue transcriptome sequence data. PLoS Comput Biol 2009; 5:e1000598. [DOI] [PMC free article] [PubMed] [Google Scholar]
- 18. Huang W, Sherman BT, Lempicki RA. Systematic and integrative analysis of large gene lists using DAVID bioinformatics resources. Nat Protoc 2009; 4:44–57. [DOI] [PubMed] [Google Scholar]
- 19. Huang da W, Sherman BT, Lempicki RA. Bioinformatics enrichment tools: Paths toward the comprehensive functional analysis of large gene lists. Nucleic Acids Res 2009; 37:1–13. [DOI] [PMC free article] [PubMed] [Google Scholar]
- 20. Heinz S, Benner C, Spann N, Bertolino E, Lin YC, Laslo P, Cheng JX, Murre C, Singh H, Glass CK. Simple combinations of lineage-determining transcription factors prime cis-regulatory elements required for macrophage and B cell identities. Mol Cell 2010; 38:576–589. [DOI] [PMC free article] [PubMed] [Google Scholar]
- 21. Goossens K, Van Poucke M, Van Soom A, Vandesompele J, Van Zeveren A, Peelman LJ. Selection of reference genes for quantitative real-time PCR in bovine preimplantation embryos. BMC Dev Biol 2005; 5:27. [DOI] [PMC free article] [PubMed] [Google Scholar]
- 22. Zeng F, Schultz RM. RNA transcript profiling during zygotic gene activation in the preimplantation mouse embryo. Dev Biol 2005; 283:40–57. [DOI] [PubMed] [Google Scholar]
- 23. De Iaco A, Planet E, Coluccio A, Verp S, Duc J, Trono D. DUX-family transcription factors regulate zygotic genome activation in placental mammals. Nat Genet 2017; 49:941–945. [DOI] [PMC free article] [PubMed] [Google Scholar]
- 24. Hendrickson PG, Dorais JA, Grow EJ, Whiddon JL, Lim JW, Wike CL, Weaver BD, Pflueger C, Emery BR, Wilcox AL, Nix DA, Peterson CM et al. Conserved roles of mouse DUX and human DUX4 in activating cleavage-stage genes and MERVL/HERVL retrotransposons. Nat Genet 2017; 49:925–934. [DOI] [PMC free article] [PubMed] [Google Scholar]
- 25. Whiddon JL, Langford AT, Wong CJ, Zhong JW, Tapscott SJ. Conservation and innovation in the DUX4-family gene network. Nat Genet 2017; 49:935–940. [DOI] [PMC free article] [PubMed] [Google Scholar]
- 26. Lu F, Liu Y, Inoue A, Suzuki T, Zhao K, Zhang Y. Establishing chromatin regulatory landscape during mouse Preimplantation development. Cell 2016; 165:1375–1388. [DOI] [PMC free article] [PubMed] [Google Scholar]
- 27. Ancelin K, Syx L, Borensztein M, Ranisavljevic N, Vassilev I, Briseno-Roa L, Liu T, Metzger E, Servant N, Barillot E, Chen CJ, Schule R et al. Maternal LSD1/KDM1A is an essential regulator of chromatin and transcription landscapes during zygotic genome activation. Elife 2016; 5: e08851. [DOI] [PMC free article] [PubMed] [Google Scholar]
- 28. Wasson JA, Simon AK, Myrick DA, Wolf G, Driscoll S, Pfaff SL, Macfarlan TS, Katz DJ. Maternally provided LSD1/KDM1A enables the maternal-to-zygotic transition and prevents defects that manifest postnatally. Elife 2016; 5: e08848. [DOI] [PMC free article] [PubMed] [Google Scholar]
- 29. Bachvarova R, De Leon V, Johnson A, Kaplan G, Paynton BV. Changes in total RNA, polyadenylated RNA, and actin mRNA during meiotic maturation of mouse oocytes. Dev Biol 1985; 108:325–331. [DOI] [PubMed] [Google Scholar]
- 30. Paynton BV, Rempel R, Bachvarova R. Changes in state of adenylation and time course of degradation of maternal mRNAs during oocyte maturation and early embryonic development in the mouse. Dev Biol 1988; 129:304–314. [DOI] [PubMed] [Google Scholar]
- 31. Bushati N, Stark A, Brennecke J, Cohen SM. Temporal reciprocity of miRNAs and their targets during the maternal-to-zygotic transition in drosophila. Curr Biol 2008; 18:501–506. [DOI] [PubMed] [Google Scholar]
- 32. Giraldez AJ, Mishima Y, Rihel J, Grocock RJ, Van Dongen S, Inoue K, Enright AJ, Schier AF. Zebrafish MiR-430 promotes deadenylation and clearance of maternal mRNAs. Science 2006; 312:75–79. [DOI] [PubMed] [Google Scholar]
- 33. Lee MT, Bonneau AR, Takacs CM, Bazzini AA, DiVito KR, Fleming ES, Giraldez AJ. Nanog, Pou5f1 and SoxB1 activate zygotic gene expression during the maternal-to-zygotic transition. Nature 2013; 503:360–364. [DOI] [PMC free article] [PubMed] [Google Scholar]
- 34. Ma J, Flemr M, Stein P, Berninger P, Malik R, Zavolan M, Svoboda P, Schultz RM. MicroRNA activity is suppressed in mouse oocytes. Curr Biol 2010; 20:265–270. [DOI] [PMC free article] [PubMed] [Google Scholar]
- 35. Suh N, Baehner L, Moltzahn F, Melton C, Shenoy A, Chen J, Blelloch R. MicroRNA function is globally suppressed in mouse oocytes and early embryos. Curr Biol 2010; 20:271–277. [DOI] [PMC free article] [PubMed] [Google Scholar]
- 36. Yang Q, Lin J, Liu M, Li R, Tian B, Zhang X, Xu B, Liu M, Zhang X, Li Y, Shi H, Wu L. Highly sensitive sequencing reveals dynamic modifications and activities of small RNAs in mouse oocytes and early embryos. Sci Adv 2016; 2:e1501482. [DOI] [PMC free article] [PubMed] [Google Scholar]
- 37. Freimer JW, Krishnakumar R, Cook MS, Blelloch R. Expression of alternative Ago2 isoform associated with loss of microRNA-driven translational repression in mouse oocytes. Curr Biol 2018; 28:296–302e293. [DOI] [PMC free article] [PubMed] [Google Scholar]
- 38. Cuthbert JM, Russell SJ, White KL, Benninghoff AD. The maternal-to-zygotic transition in bovine in vitro-fertilized embryos is associated with marked changes in small non-coding RNAsdagger. Biol Reprod 2019; 100:331–350. [DOI] [PubMed] [Google Scholar]
- 39. Tripurani SK, Xiao C, Salem M, Yao J. Cloning and analysis of fetal ovary microRNAs in cattle. Anim Reprod Sci 2010; 120:16–22. [DOI] [PubMed] [Google Scholar]
- 40. Mondou E, Dufort I, Gohin M, Fournier E, Sirard MA. Analysis of microRNAs and their precursors in bovine early embryonic development. Mol Hum Reprod 2012; 18:425–434. [DOI] [PubMed] [Google Scholar]
- 41. Tesfaye D, Worku D, Rings F, Phatsara C, Tholen E, Schellander K, Hoelker M. Identification and expression profiling of microRNAs during bovine oocyte maturation using heterologous approach. Mol Reprod Dev 2009; 76:665–677. [DOI] [PubMed] [Google Scholar]
- 42. Tripurani SK, Lee KB, Wee G, Smith GW, Yao J. MicroRNA-196a regulates bovine newborn ovary homeobox gene (NOBOX) expression during early embryogenesis. BMC Dev Biol 2011; 11:25. [DOI] [PMC free article] [PubMed] [Google Scholar]
- 43. Abd El Naby WS, Hagos TH, Hossain MM, Salilew-Wondim D, Gad AY, Rings F, Cinar MU, Tholen E, Looft C, Schellander K, Hoelker M, Tesfaye D. Expression analysis of regulatory microRNAs in bovine cumulus oocyte complex and preimplantation embryos. Zygote 2013; 21:31–51. [DOI] [PubMed] [Google Scholar]
- 44. Berg DK, Pfeffer PL. MicroRNA expression in bovine preimplantation embryos. Reprod Fertil Dev 2018; 30:546–554. [DOI] [PubMed] [Google Scholar]
- 45. Bultman SJ, Gebuhr TC, Pan H, Svoboda P, Schultz RM, Magnuson T. Maternal BRG1 regulates zygotic genome activation in the mouse. Genes Dev 2006; 20:1744–1754. [DOI] [PMC free article] [PubMed] [Google Scholar]
- 46. Iwafuchi-Doi M, Zaret KS. Cell fate control by pioneer transcription factors. Development 2016; 143:1833–1837. [DOI] [PMC free article] [PubMed] [Google Scholar]
- 47. Zaret KS, Mango SE. Pioneer transcription factors, chromatin dynamics, and cell fate control. Curr Opin Genet Dev 2016; 37:76–81. [DOI] [PMC free article] [PubMed] [Google Scholar]
- 48. Ema M, Mori D, Niwa H, Hasegawa Y, Yamanaka Y, Hitoshi S, Mimura J, Kawabe Y, Hosoya T, Morita M, Shimosato D, Uchida K et al. Kruppel-like factor 5 is essential for blastocyst development and the normal self-renewal of mouse ESCs. Cell Stem Cell 2008; 3:555–567. [DOI] [PubMed] [Google Scholar]
- 49. Lin SC, Wani MA, Whitsett JA, Wells JM. Klf5 regulates lineage formation in the pre-implantation mouse embryo. Development 2010; 137:3953–3963. [DOI] [PMC free article] [PubMed] [Google Scholar]
- 50. Parisi S, Passaro F, Aloia L, Manabe I, Nagai R, Pastore L, Russo T. Klf5 is involved in self-renewal of mouse embryonic stem cells. J Cell Sci 2008; 121:2629–2634. [DOI] [PubMed] [Google Scholar]
- 51. Pontis J, Planet E, Offner S, Turelli P, Duc J, Coudray A, Theunissen TW, Jaenisch R, Trono D. Hominoid-specific transposable elements and KZFPs facilitate human embryonic genome activation and control transcription in naive human ESCs. Cell Stem Cell 2019; 24:724–735e725. [DOI] [PMC free article] [PubMed] [Google Scholar]
Associated Data
This section collects any data citations, data availability statements, or supplementary materials included in this article.