

Abstract
Objective:
To better understand possible mechanisms involved in the dyregulation of gene expression unique to oral squamous cell carcinoma (OSCC) metastasis, we examined the differential expression of miRNAs in OSCC metastasis and their functional impact on target gene expression.
Study design:
Observational assessment of DNA copy number, miRNA, and RNA expression in primary and metastatic OSCC
Setting:
University of Washington Medical Center and affiliated hospitals.
Subjects:
Tumor samples were taken from patients with primary incident OSCC; cells were laser-capture-microdissected from 17 non-metastatic primary tumors and 20 metastatic lymph nodes.
Methods:
DNA copy number aberrations (CNA) and gene expression profiles were previously determined using Affymetrix 250K Nsp I SNP Arrays and HU133 plus 2.0 expression arrays. miRNAs were interrogated with Exiqon’s Ready-to-use PCR Panels assessing the expression of 368 human miRNAs.
Results:
We found 31 miRNAs differentially expressed between metastatic and non-metastatic samples (False Discovery Rate<0.4; 27 over-expressed and four underexpressed in metastatic samples). Expression of 11 of these miRNAs was significantly associated with their DNA copy numbers, and expression of 8 of these miRNAs were significantly associated with their target genes. Among these unique miRNAs, miR-140-3p, miR-29c and miR-29a were both differentially expressed in metastasis vs. non-metastatic samples and had a strong positive correlation with their DNA copy numbers and a negative correlation with the expression of their target genes.
Conclusion:
Our results suggest that DNA copy number aberration may play a role in the dysregulation of some differentially expressed miRNAs in OSCC metastasis, warranting further investigation.
Keywords: Oral squamous cell carcinoma, OSCC, microRNA, miRNA, head and neck cancer, miRNA-140-3p, miRNA-29a, miRNA-29c, metastases, oral cancer metastases, DNA copy number, miRNA profiling, integrative analysis
Introduction
Oral squamous cell carcinoma (OSCC) is one of the most common cancer types worldwide. Despite considerable advances in surgical techniques, and the use of adjuvant treatment modalities, the overall prognosis for oral squamous cell carcinoma (OSCC) has not improved significantly in the past two decades.1,2 In particular, the presence of lymph node involvement is associated with a 50% decrease in 5-year survival.3 Therefore, it is critical to gain a better understanding of the molecular mechanisms that drive metastasis in OSCC.
The use of high-throughput DNA microarrays to detect genome-wide DNA copy number changes (genomics) and the gene expression levels (transcriptomics) holds much promise in achieving this goal. We previously mapped DNA copy number aberrations in laser-dissected tumor cells from lymph node metastases and showed 1) that there were strong associations of DNA copy number with gene expression; and 2) that the combination of DNA copy number and differential gene expression data was effective at identifying candidate transcripts that appear to have better predictive capacity for prognosis than stage alone.4 However, we still need better understanding of other mechanisms associated with the aberrant gene expression in metastasis in order to identify the dysregulated pathways that might be associated with prognosis, and thus relevant for the development of new therapies. There is now emerging evidence that microRNAs (miRNAs) may play a role in cancer, and that dysregulation of miRNA expression is important in head and neck cancer.5,6 Mature miRNAs have the ability to negatively regulate protein expression at the posttranscriptional level through direct binding to the 3’ UTR of specific messenger RNA (mRNA).7,8 These miRNA negatively impact the translation of the mRNA strand by either blocking target gene expression, or by cleaving the mRNA when the complementarity is perfect or nearly so.9 We hypothesize that these molecular properties of miRNAs can help to better explain, at least in part, aberrant gene expression in metastatic OSCC cells.
By determining miRNA profiles on samples for which we had previously obtained genome-wide DNA copy number and gene expression profiles,4 we set out to explore the differences in miRNA levels between tumor cells from metastases in lymph nodes vs. tumor cells from non-metastatic primary OSCC tumors. We also aimed to determine the impact of dysregulation of miRNAs on the expression of their target genes. Given that our prior results had shown a significant correlation between DNA copy number aberrations and gene expression,4 we also sought to determine whether DNA copy number aberrations could also exert similar influences on miRNA dysregulation.
Materials and Methods
Patient Samples:
Patients with primary incident OSCC were enrolled with Institutional Review Board approval from three collaborating institutions: University of Washington Medical Center, Harborview Medical Center and the Puget Sound Veterans Affairs Health Care System. Blood was collected at time of enrollment. During surgery, we collected primary carcinomas, as well as lymph nodes from patients with known metastatic OSCC. All surgeries were conducted at the University of Washington Medical Center and affiliated hospitals.
Sample preparation:
Tissue samples were flash frozen in the operating room immediately after tumor resection and stored in liquid nitrogen until use. The samples were thawed to −20°C, embedded in OCT, and 8-μm thick frozen sections were cut on RNase-free slides and stained at the Fred Hutchinson Cancer Research Center, Seattle, WA. One in every eight consecutive slides was stained with Hematoxylin and Eosin (H&E) for pathologic analysis. Additionally, a 20-μm thick frozen section was cut to determine the quality of nucleic acids within the embedded tumor. Tumor cells were isolated using laser capture microdissection and the DNA and RNA were extracted as described in Xu et al.10 miRNA was isolated from the total RNA using the RNeasy Micro Kit as per manufacturer’s protocol (Qiagen, Valencia, CA).
Real-time quantification of miRNAs:
miRNA profiles of 20 metastatic OSCC in lymph nodes and 17 non-metastatic primary tumors were evaluated using miRCURY LNA™ Universal RT microRNA Ready-to-Use PCR Panels (Exiqon). As described in the product manual (www.exiqon.com), miRNA samples were first reverse transcribed. The cDNA was then used to conduct real time PCR using the Ready-to-Use panel (comprising 368 LNA-modified probes for human miRNAs in the miRBase microRNA Registry v13.0) on an ABI 7900HT Fast Real-Time PCR System.
Data pre-processing:
Samples with undetectable miRNA expression were given a Ct value of 40. We normalized the plates using an inter-plate calibrator (IPC) that was present on each array in triplicate, per the manufacturer’s instructions (www.exiqon.com). Ct values from samples with miRNA expression that were >36 were assigned a value of 36. Additionally, as outlined in Hui et al11, target miRNAs with a Ct value greater than 36 in 80% of the metastatic lymph node samples or 80% of the non-metastatic primary tumor samples were removed from the analysis. The mean of three controls that were provided on the miRNA array (U6, SNORD38B, and SNORD49A) was used as the endogenous control reference gene.
Statistical Analysis:
MicroRNA Differential Expression Analysis:
We determined the differential expression values using the ΔΔCt method of Pfaffl12 with a PCR amplification efficiency of E = 2. We first calibrated the Ct values using the inter plate calibrator UniSp3 to normalize the Ct values from difference plates. Undetermined values were given a Ct value of 36. We excluded the miRNAs if 80% of the samples had a Ct of 36 in either metastatic or non-metastatic subgroups. The control Ct value was subtracted from each Ct data point on that plate to generate the ΔCt values, which was examined using the Wilcoxon rank sum test, with the Benjamini-Hochberg adjustment for false discovery rate (FDR),13 as outlined by Hui et al.11
DNA copy number estimation and gene expression profiling:
The DNA and RNA of the laser dissected tumor cells for each of the 20 lymph node metastatic samples were hybridized onto Affymetrix Human Mapping 250K Nsp I SNP and Affymetrix Human Genome U133 Plus 2.0 arrays, respectively, as described previously.4 We combined this previous analysis with an analysis of 17 non-metastatic primary tumor samples, which were processed and interrogated similarly.
The association between DNA copy numbers and miRNA levels:
We obtained the genome sequences and chromosomal coordinates of all expressed miRNAs using the miRBase V 14.0 (http://www.mirbase.org)14, 15, 16, 17 (Hosted in the Faculty of Life Sciences, University of Manchester). The DNA copy number of each miRNA was determined by averaging the estimated DNA copy number probes4 on the DNA copy number arrays falling into a neighborhood of 250Kb upstream and downstream of each miRNA location on the genome. We then used linear regression models to assess the association between miRNA transcript levels and their DNA copy number alterations. The p-value was recorded for the predictive significance of DNA copy number in each regression model.
The association between gene expressions, DNA copy number and miRNA:
To investigate the impact of miRNA on gene expression, we considered that each gene expression level could be influenced by both DNA copy number (as detailed in Chang et al4), and by miRNA levels. Thus, when assessing the influence of miRNA on gene expression, we also included terms for the DNA copy number of each particular gene as described in Chang el al. We analyzed the potential target genes of all expressed miRNAs using the TargetScanHuman V. 5.1. A full explanation of the algorithm used to obtain the context score can be found at http://www.targetscan.org/. This analysis yielded all potential gene targets for the expressed miRNAs. For each transcript, we only considered the top three miRNAs receiving the highest complementarity scores from TargetScanHuman. We then fitted linear regression models by treating each transcript level as the response variable, with the DNA copy number at its corresponding location, as well as the abundance levels of the top three matching miRNAs serving as the predictor variables. The coefficients in front of the miRNA abundances together with their p-values were recorded.
Ingenuity Pathways Analysis:
Among the predicted targets of miR-140-3p and miR-29a, we further studied the subset that was associated with DNA copy number aberrations, that showed significant expression difference (p<0.01) in the metastatic samples, and that had a negative impact on their target genes. This subset was analyzed using Ingenuity Pathway Analysis software (IPA, version 8.5, Ingenuity®Systems, http://www.ingenuity.com Core Analysis. The Functions/Pathways/Tox list Analyses were performed with “Ingenuity Knowledge Base (Genes Only)” as reference set and both direct and indirect relationships were considered in the Network Analysis.
Results
Study Population:
Selected characteristics of the study participants are shown in supplementary information, Table S1. Of the 20 OSCC patients with lymph node metastases, eight had cancers arising in the oropharynx, while the remaining carcinomas arose from the oral cavity. The majority of patients had ≥ N2 nodal staging (i.e. multiple metastatic nodes detected). The age range of the patients with metastases was 23-84 (mean 56.8) years. Of the 17 non-metastatic primary OSCC patients, three primary tumors arose in the oropharynx, and the remaining tumors were from the oral cavity. Eight of these patients with non-metastatic primary OSCC had AJCC stage I tumors, and nine had AJCC stage II tumors. The age range of patients without metastases was 47-79 (mean 59.2) years. The follow-up interval for the patients with non-metastatic primaries was 2.7 years (range: 0.5-5.4years).
Differential Expression Analysis:
Of the 368 miRNAs on the assay platform, only 155 were expressed in either 80% of non-metastatic tumor cells or 80% of the metastatic tumor cells. Of these 155 miRNAs, 31 miRNAs were differentially expressed in metastatic compared to non-metastatic tumor cells (FDR≤0.4) (Table 1). Of these, 26 were overexpressed in the lymph node metastases, and five were underexpressed (Table 1).
Table 1.
List of 31 miRNAs differentially expressed between metastatic and non-metastatic OSCC
| miRNA | FDR | Raw p-value | Z-score |
|---|---|---|---|
| Upregulated | |||
| hsa-miR-150 | 0.0016 | <0.0001 | 4.4041 |
| hsa-miR-155 | 0.0054 | 0.0001 | 3.9774 |
| hsa-let-7g | 0.0132 | 0.0003 | 3.5812 |
| hsa-miR-195 | 0.0133 | 0.0003 | 3.6116 |
| hsa-miR-142-3p | 0.0363 | 0.0012 | 3.2459 |
| hsa-miR-342-3p | 0.0901 | 0.0048 | 2.8192 |
| hsa-miR-140-3p | 0.0901 | 0.0040 | 2.8802 |
| hsa-miR-497 | 0.0901 | 0.0058 | 2.7583 |
| hsa-miR-146b-5p | 0.0901 | 0.0058 | 2.7583 |
| hsa-miR-218 | 0.0901 | 0.0058 | 2.7583 |
| hsa-miR-29c | 0.1181 | 0.0084 | 2.6363 |
| hsa-miR-146a | 0.1293 | 0.0100 | 2.5754 |
| hsa-miR-29a | 0.1549 | 0.0130 | 2.4839 |
| hsa-miR-26b | 0.1566 | 0.0142 | 2.4535 |
| hsa-miR-145 | 0.1591 | 0.0154 | 2.4230 |
| hsa-let-7f | 0.3388 | 0.0397 | 2.0573 |
| hsa-miR-34a | 0.3388 | 0.0459 | 1.9963 |
| hsa-miR-148a | 0.3388 | 0.0459 | 1.9963 |
| hsa-miR-100 | 0.3388 | 0.0459 | 1.9963 |
| hsa-miR-10a | 0.3420 | 0.0529 | 1.9353 |
| hsa-miR-29b | 0.3420 | 0.0529 | 1.9353 |
| hsa-miR-15a | 0.3729 | 0.0652 | 1.8439 |
| hsa-miR-125b | 0.3729 | 0.0609 | 1.8744 |
| hsa-miR-192 | 0.3729 | 0.0698 | 1.8134 |
| hsa-miR-199a-3p | 0.3729 | 0.0652 | 1.8439 |
| hsa-miR-26a | 0.3730 | 0.0746 | 1.7830 |
| Downregulated | |||
| hsa-miR-34c-5p | 0.1621 | 0.0167 | −2.3925 |
| hsa-miR-92b | 0.3388 | 0.0427 | −2.0268 |
| hsa-miR-23b | 0.3420 | 0.0529 | −1.9353 |
| hsa-miR-149 | 0.3729 | 0.0698 | −1.8134 |
| hsa-miR-95 | 0.3730 | 0.0746 | −1.7830 |
Legend: FDR – False Discovery Rate, Raw p-value – unadjusted p-value
DNA copy number integration analysis:
To evaluate genomic influences that may drive miRNA expression, we looked at the association of DNA copy number on the expression of our 155 target miRNAs. The results are shown in Figure 1. We found that 11 of our 155 miRNAs showed a significant association with DNA copy number (Table 2). Of these 11, seven miRNAs were differentially expressed: miR-29a, miR-29c, miR-140-3p, miR-34c-5p, miR-10a, miR-149 and miR-192 (Figure 2A).
Figure 1:
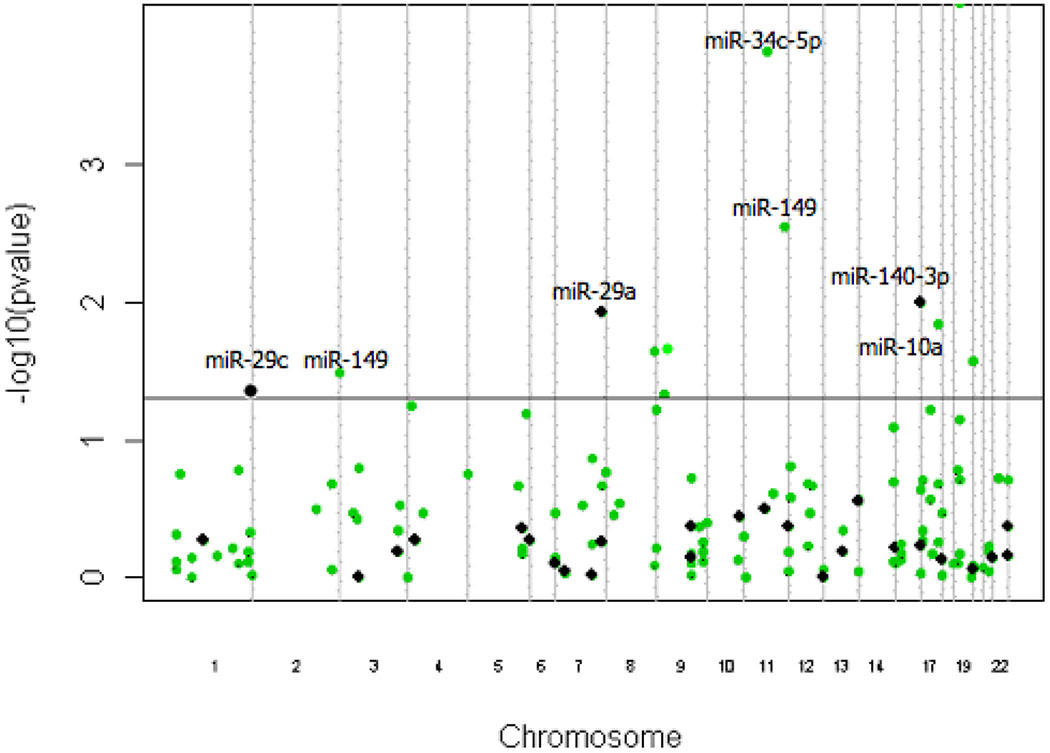
Manhattan plot. Line indicates the Bonferroni p-value cutoff for DNA copy number-associated miRNAs. Black dots indicate differentially expressed miRNAs in OSCC metastasis.
Table 2.
DNA copy number associated miRNAs differentially expressed miRNAs in OSCC metastasis
| DNA copy number associated miRNAs | p-value |
|---|---|
| miR-140-3p | 0.0010 |
| miR-29c | 0.0429 |
| miR-29a | 0.0119 |
| miR-34c-5p | 0.0028 |
| miR-10a | 0.0144 |
| miR-149 | 0.0321 |
| miR-192 | 0.0002 |
Figure 2:
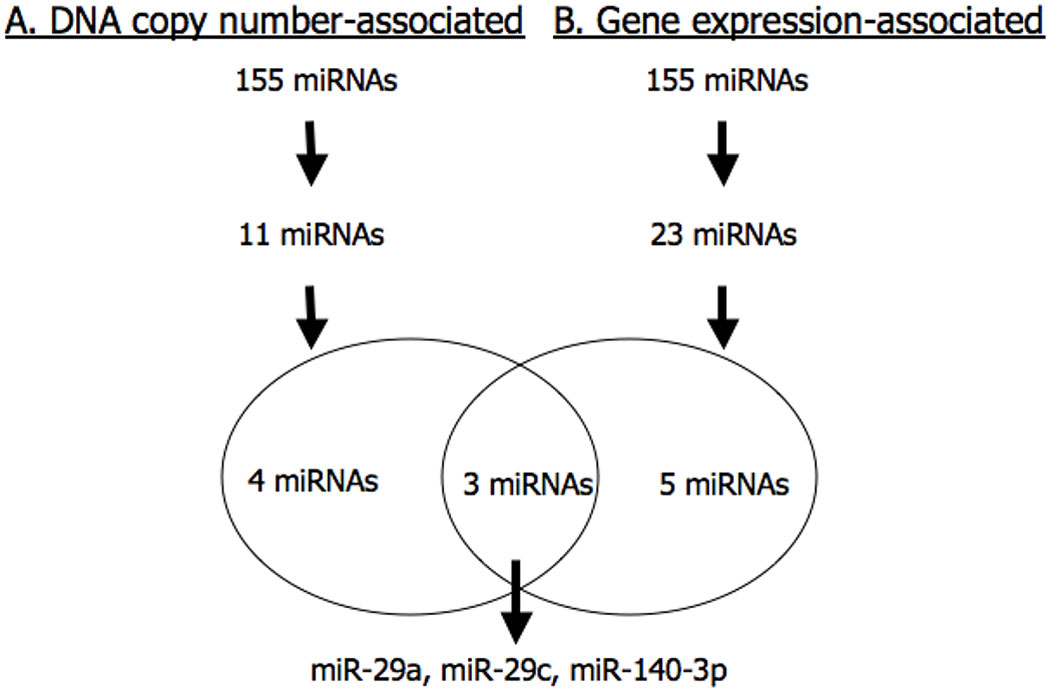
Schematic of study workflow. (A) DNA copy number-associated miRNAs. (B) Gene expression-associated miRNAs. 3 miRNAs are differentially expressed OSCC metastasis, associated with their DNA copy number and have a negative impact on their target gene expression.
Target gene analysis:
Based on our in silico analysis with TargetScanHuman, we found 47,385 potential gene targets corresponding to the genome sequences of the 155 expressed miRNAs. The distribution of the coefficients describing the association between the 155 miRNAs and the expression of their target genes is shown in Supplemental Figure S1. This plot reveals a normal distribution centered around zero, indicating that there was not a general preponderance for negative correlations between miRNAs and their target genes. Given that miRNAs are known to silence gene expression, we chose to focus on miRNAs that had significant negative associations (p<0.01, coefficient<0) with multiple (at least 5) transcripts. There were 23 miRNA satisfying this selection criterion, which are shown in Figure 3. Of these 23 miRNAs, we found that eight miRNAs were also among those found to be differentially expressed in metastatic tumor cells: miR-155, miR-142-3p, miR-29a, miR-29c, miR-140-3p, miR-148a, miR-23b and miR-15a (Figure 2B and Table S2). Lastly, the intersection from the above analyses showed that miR-29a (7q32.2), miR-29c (1q32.2) and miR-140-3p (16q22.1) were not only differentially expressed in metastasis, but that they also had a strong positive correlation with their DNA copy numbers and a negative correlation with their target genes (Figure 2).
Figure 3:
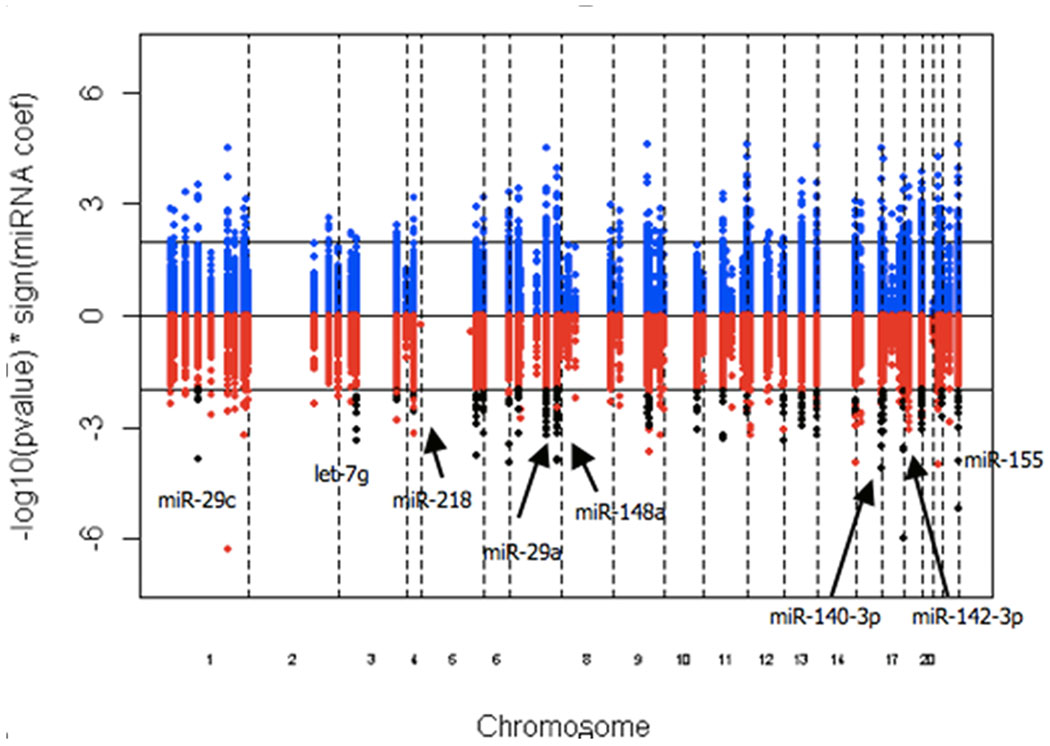
Manhattan plot. Black dots indicate the 23 miRNAs that are negatively associated with gene expression. The eight labeled miRNAs are those that are differentially expressed in OSCC metastasis.
Functional network analysis of miR-29a, miR-29c, and miR-140-3p target genes
To explore the pathways and regulatory elements most likely associated with the changes induced by the miR-29 family and miR-140-3p, we performed Ingenuity Pathway Analysis on the expression of the target genes that were correlated with miRNA expression in metastatic samples (p-value<0.01). The top networks generated by targets of miR-29a/c and miR-140-3p are shown in Supplemental Figures S2 and S3, respectively. For miRNA-29, pathway analysis revealed a network associated with organismal injury, dermatological diseases and conditions. The network identified ITGB1, PI3K, and NF-KB as central regulators. For miRNA-140-3p, this procedure revealed a network associated with cell cycle, connective tissue development, and cellular function and maintenance. The central regulators in this pathway are p53, NF-KB, and HDAC1.The top cellular functions of both miRNA-29 and miRNA 140-3p gene targets identify cellular assembly and organization and cell-to-cell signaling and involve IGF-1. Additional functions identified include cell death, cell growth and proliferation, and cell morphology.
Discussion
miRNA dysregulation has been shown in various types of cancer.18,19,20 Many cellular mechanisms appear to be under the control of miRNA in both normal and cancerous tissue.21 While miRNA studies are increasing for all different types of cancer,22,23,24 we are now starting to learn more about the importance of miRNAs in head and neck cancer.25,26,27 Despite these advances, there is a paucity of published information regarding differential miRNA expression in metastatic OSCC and the functional impact of these differentially expressed miRNAs on their target genes. Our study is unique in several important ways. First, it utilizes integrative genomics in metastatic OSCC to identify miRNA dysregulation that is associated with DNA copy number aberrations and to understand the impact that miRNAs might be having on the expression of their target genes. Secondly, besides considering the association between the DNA copy number of each miRNA and miRNA dysregulation, when assessing the association between miRNA levels and their target genes, we also considered the impact of target gene’s DNA copy number on its expression. This is important because we have shown a strong positive correlation between DNA copy number aberrations and the expression levels of the corresponding encoded genes.4 Thus, we believe this to be essential when determining the true impact of miRNA expression on its gene targets. Thirdly, we focused on metastasis by establishing a comparison between laser dissected tumor cells from non-metastatic primary carcinomas and tumor cells metastatic to lymph nodes, rather than a pair-wise comparison between tumor cells from primary OSCC known to have metastatic behavior and the metastatic tumor cells from lymph nodes. This distinction is important, because there is evidence that prior to metastasis, the carcinoma in the primary site has already developed tumor cells with genetic changes associated with metastatic potential, as we and others have shown.28,29,30 Our study aimed to detect miRNA differences and differences in target gene regulation that could provide additional information relevant to the metastatic tumor phenotype, which might have been lost if our primary tumor samples were from patients with known metastases at the time of collection.
It is challenging to evaluate the overall impact of dysregulated miRNA in metastasis due to the complexity of the miRNA/target gene interaction. Each individual miRNA can bind to many target genes with varying degrees of specificity, and conversely, each gene can be targeted by multiple miRNAs. In fact, of the 155 miRNAs expressed in our samples, we discovered that the overall number of genes possibly under miRNA control reached 47,385. Each of these miRNAs could potentially bind between 20 and 1000 target genes. We only accounted for the top three gene candidates to which a given miRNA could bind in order to keep the multiple comparisons penalties low. This limitation may explain why the genome-wide association between our expressed miRNAs and the expression of their top gene targets did not reveal a general preponderance for miRNAs to have a negative impact on their transcriptome. Other limitations include small sample size, the fact that we combined oral cavity and oropharyngeal cancers, the absence of information regarding the patient’s HPV status in the analysis, and the lack of assessment of protein expression. In addition, although our primary tumor samples were from patients without known metastases, the follow-up interval between our collection dates and our investigation may not be long enough to determine if some of the tumors may have already spread beyond the primary site. This might have diluted the results of our study. However, none of the patients with non-metastatic disease had nodal recurrences during their follow-up period. In addition, the metastatic tumor cells used in our study, comprised carcinoma cells dissected from lymph nodes; our results may not be applicable to squamous carcinoma cells that have metastasized to other sites, such as lung or bone. Further studies with larger samples sizes, tumor cells metastatic to other sites, and longer follow-up intervals are needed to determine the impact of these factors relating to miRNAs in OSCC, and their role in tumor metastasis.
Our integrated results indicate that the expression of hsa-miR-29a, hsa-miR-29c and hsa-miR-140-3p is related to their DNA copy number and is differentially expressed in metastatic vs. non-metastatic OSCC and that their expression has a significant impact on the expression of their target genes. These three miRNAs may play a role in the development of metastatic behavior of tumor cells by directly downregulating expression of their specific target genes. It should also be noted that miR-29a has been used for early detection of colorectal liver metastasis31 and has been associated with metastasis and poor prognosis in clear cell renal cell carcinoma,32 highlighting the importance of this miRNA in metastatic pathways. Overexpression of miR-29c is being studied as a potential biomarker in diffuse large B cell lymphoma33 as well as in non-small cell lung cancer.34 Additionally, miR-140-3p has been shown to be correlated with the occurrence of LOH at 16q22.1-q23.1 in multiple myeloma.35 Our pathway analysis found that these three miRNAs were associated with several relevant cancer related pathways and networks, including cell cycle, cell-to-cell signaling and cell morphology. Together these results suggest that miR-29a/c and miR-140-3p may play a role in OSCC metastasis to lymph nodes, and this observation warrants further investigation, as well as investigation in other sites of metastasis.
Supplementary Material
Supplemental Figure S1: Scatter plot showing the association between the 155 miRNAs and the expression of their 47,385 target genes. The scatter plot reveals a normal distribution centered around coefficient equal to 0.
Supplemental Figure S3: Ingenuity pathway analysis on genes impacted by microRNA-140-3p. Associations were noted with Cell Cycle, Connective Tissue Development, and Cellular Function and Maintenance. The central regulators are p53, NF-KB, and HDAC1.
Supplemental Figure S2: Ingenuity pathway analysis on genes impacted by microRNA-29a/c. Associations were noted with Organismal Injury, Dermatological Diseases and Conditions. The network identified ITGB1, PI3K, and NF-KB as central regulators.
Acknowledgements
This work was supported in part by grants 5KL2RR025015-03 from National Center for Research Resources, National Institutes of Health (NIH); Amos Medical Faculty Development Program Award from The Robert Wood Johnson Foundation; Early Physician-Scientist Career Development Award from the Howard Hughes Medical Institute; 5T32DC000018-27 from the NIH, Department of Health and Human Services Public Health Service Ruth L. Kirschstein National Research Service Award; NIH RO1CA095419; funds from the Fred Hutchinson Cancer Research center; and center funds from the Department of Otolaryngology – Head and Neck Surgery, University of Washington; and by resources from and use of facilities at the VA Puget Sound Health Care System, Fred Hutchinson Cancer Research Center, University of Washington Medical Center and Harborview Medical Center, Seattle, Washington.
Footnotes
Abstract was presented at the 2011 American Academy of Otolaryngology - Head and Neck Surgery Annual Meeting in San Francisco, CA.
References
- 1.Jemal A, Murray T, Ward E, et al. Cancer statistics, 2005. CA Cancer J Clin 2005;55:10–30 [DOI] [PubMed] [Google Scholar]
- 2.Forastiere AA, Trotti A, Pfister DG, Grandis JR. Head and neck cancer: recent advances and new standards of care. J Clin Oncol 2006;24:2603–5. [DOI] [PubMed] [Google Scholar]
- 3.Imre K, Pinar E, Oncel S, Calli C, Tatar B. Predictors of extracapsular spread in lymph node metastasis. Eur Arch Otorhinolaryngol. 2008. pp. 337–339. [DOI] [PubMed] [Google Scholar]
- 4.Xu C, Liu Y, Wang P, Fan W, Rue TC, Upton MP, Houck JR, Lohavanichbutr P, Doody DR, Futran ND, Zhao LP, Schwartz SM, Chen C, Méndez E. Integrative analysis of DNA copy number and gene expression in metastatic oral squamous cell carcinoma identifies genes associated with poor survival. Mol Cancer. 2010. June 11;9:143. [DOI] [PMC free article] [PubMed] [Google Scholar]
- 5.Wong TS, Liu XB, Wong BY, Ng RW, Yuen AP & Wei WI Mature miR-184 as Potential Oncogenic microRNA of Squamous Cell Carcinoma of Tongue. Clin Cancer Res. 142588–142592 (2008). [DOI] [PubMed] [Google Scholar]
- 6.Kozaki K, Imoto I, Mogi S, Omura K & Inazawa J Exploration of tumor-suppressive microRNAs silenced by DNA hypermethylation in oral cancer. Cancer Res. 7, 2094–105 (2008). [DOI] [PubMed] [Google Scholar]
- 7.Tang G Reinhart BJ, Bartel DP, & Zanmore PD, A biochemical framework for RNA silencing in plants. Genes Dev. 17, 49–63 (2003). [DOI] [PMC free article] [PubMed] [Google Scholar]
- 8.Pasquinelli AE, Ruvkun G Control of developmental timing of microRNAs and their targets. Annu. Rev. Cell Dev. Biol 18, 495–513 (2002). [DOI] [PubMed] [Google Scholar]
- 9.Yetka S, Shih IH, & Bartel DP MicroRNA-directed cleavage of HOXB8 mRNA. Science. 304, 594–596 (2004). [DOI] [PubMed] [Google Scholar]
- 10.Xu C, Houck JR , Fan W, Wang P, Chen Y, Upton M, Futran ND, Schwartz SM, Zhao LP, Chen C, Mendez E. Simultaneous isolation of DNA and RNA from the same cell population obtained by laser capture microdissection for genome and transcriptome profiling. J Mol Diagn. 2008. March;10(2):129–34. [DOI] [PMC free article] [PubMed] [Google Scholar]
- 11.Hui AB, Lenarduzzi M, Krushel T, Waldron L, Pintilie M, Shi W, Perez-Ordonez B, Jurisica I, O’Sullivan B, Waldron J, Gullane P, Cummings B, Liu FF. Comprehensive MicroRNA profiling for head and neck squamous cell carcinomas. Clin Cancer Res. 2010. February 15;16(4):1129–39. Epub 2010 Feb 9. [DOI] [PubMed] [Google Scholar]
- 12.Pfaffl M A new mathematical model for relative quantification in realtime RT-PCR. Nucleic Acids Res. 2001;29:e45. [DOI] [PMC free article] [PubMed] [Google Scholar]
- 13.Benjamini Y, Hochberg Y. Controlling the false discovery rate: a practical and powerful approach to multiple testing. J R Stat Soc Ser B. 1995;57:289–300. [Google Scholar]
- 14.Kozomara A, Griffiths-Jones S. miRBase: integrating microRNA annotation and deep-sequencing data. NAR 2011. 39(Database Issue):D152–D157 [DOI] [PMC free article] [PubMed] [Google Scholar]
- 15.Griffiths-Jones S, Saini HK, van Dongen S, Enright AJ. miRBase: tools for microRNA genomics. NAR 2008. 36(Database Issue):D154–D158 [DOI] [PMC free article] [PubMed] [Google Scholar]
- 16.Griffiths-Jones S, Grocock RJ, van Dongen S, Bateman A, Enright AJ. miRBase: microRNA sequences, targets and gene nomenclature. NAR 2006. 34(Database Issue):D140–D144 [DOI] [PMC free article] [PubMed] [Google Scholar]
- 17.Griffiths-Jones S The microRNA Registry. NAR 2004. 32(Database Issue):D109–D111 [DOI] [PMC free article] [PubMed] [Google Scholar]
- 18.Tong AW, Fulgham P, Jay C, Chen P, Khalil I, Liu S, Senzer N, Eklund AC, Han J, Nemunaitis J. MicroRNA profile analysis of human prostate cancers. Cancer Gene Ther. 2008. October 24. [DOI] [PubMed] [Google Scholar]
- 19.Bandrés E, Cubedo E, Agirre X, Malumbres R, Zárate R, Ramirez N, Abajo A, Navarro A, Moreno I, Monzó M, García-Foncillas J. Identification by Real-time PCR of 13 mature microRNAs differentially expressed in colorectal cancer and non-tumoral tissues. Mol Cancer. 2006. July 19;5:29. [DOI] [PMC free article] [PubMed] [Google Scholar]
- 20.Gottardo F, Liu CG, Ferracin M, Calin GA, Fassan M, Bassi P, Sevignani C, Byrne D, Negrini M, Pagano F, Gomella LG, Croce CM, Baffa R. Micro-RNA profiling in kidney and bladder cancers. Urol Oncol. 2007. Sep-Oct;25(5):387–92. [DOI] [PubMed] [Google Scholar]
- 21.Ha TY. MicroRNAs in Human Diseases: From Cancer to Cardiovascular Disease. Immune Netw. 2011. June;11(3):135–54. Epub 2011 Jun 30. [DOI] [PMC free article] [PubMed] [Google Scholar]
- 22.Rask L, Balslev E, Jørgensen S, Eriksen J, Flyger H, Møller S, Høgdall E, Litman T, Nielsen BS. High expression of miR-21 in tumor stroma correlates with increased cancer cell proliferation in human breast cancer. APMIS. 2011. October;119(10):663–73. Epub 2011 Jun 17. [DOI] [PubMed] [Google Scholar]
- 23.Yao T, Lin Z. MiR-21 is involved in cervical squamous cell tumorigenesis and regulates CCL20. Biochim Biophys Acta. 2011. October 7. [DOI] [PubMed] [Google Scholar]
- 24.Yang CH, Yue J, Pfeffer SR, Handorf CR, Pfeffer LM. MicroRNA-21 regulates the metastatic behavior of B16 melanoma cells. J Biol Chem. 2011. September 22. [DOI] [PMC free article] [PubMed] [Google Scholar]
- 25.Chang SS, Jiang WW, Smith I, Poeta LM, Begum S, Glazer C, Shan S, Westra W, Sidransky D, Califano JA. MicroRNA alterations in head and neck squamous cell carcinoma. Int J Cancer. 2008. December 15;123(12):2791–7. [DOI] [PMC free article] [PubMed] [Google Scholar]
- 26.Lajer CB, Nielsen FC, Friis-Hansen L, Norrild B, Borup R, Garnæs E, Rossing M, Specht L, Therkildsen MH, Nauntofte B, Dabelsteen S, von Buchwald C. Different miRNA signatures of oral and pharyngeal squamous cell carcinomas: a prospective translational study. Br J Cancer. 2011. March 1;104(5):830–40. Epub 2011 Feb 15. [DOI] [PMC free article] [PubMed] [Google Scholar]
- 27.Ramdas L, Giri U, Ashorn CL, Coombes KR, El-Naggar A, Ang KK, et al. miRNA expression profiles in head and neck squamous cell carcinoma and adjacent normal tissue. Head Neck. 2009; 31(5):642–654 [DOI] [PMC free article] [PubMed] [Google Scholar]
- 28.Méndez E, Fan W, Choi P, Agoff SN, Whipple M, Farwell DG, Futran ND, Weymuller EA Jr, Zhao LP, Chen C. Tumor-specific genetic expression profile of metastatic oral squamous cell carcinoma. Head Neck. 2007. September;29(9):803–814 [DOI] [PubMed] [Google Scholar]
- 29.van’t Veer LJ, Dai H, van de Vijver MJ, He YD, Hart AA, Mao M, Peterse HL, van der Kooy K, Marton MJ, Witteveen AT, Schreiber GJ, Kerkhoven RM, Roberts C, Linsley PS, Bernards R and Friend SH. Gene expression profiling predicts clinical outcome of breast cancer. Nature. 2002;415:530–6 [DOI] [PubMed] [Google Scholar]
- 30.Kang Y, Siegel PM, Shu W, Drobnjak M, Kakonen SM, Cordon-Cardo C, Guise TA and Massague J. A multigenic program mediating breast cancer metastasis to bone. Cancer Cell. 2003;3:537–49 [DOI] [PubMed] [Google Scholar]
- 31.Wang LG, Gu J. Serum microRNA-29a is a promising novel marker for early detection of colorectal liver metastasis. Cancer Epidemiol. 2012. February;36(1):e61–7. [DOI] [PubMed] [Google Scholar]
- 32.Heinzelmann J, Henning B, Sanjmyatav J, Posorski N, Steiner T, Wunderlich H, Gajda MR, Junker K. Specific miRNA signatures are associated with metastasis and poor prognosis in clear cell renal cell carcinoma. World J Urol. 2011. June;29(3):367–73. [DOI] [PubMed] [Google Scholar]
- 33.Fang C, Zhu DX, Dong HJ, Zhou ZJ, Wang YH, Liu L, Fan L, Miao KR, Liu P, Xu W, Li JY. Serum microRNAs are promising novel biomarkers for diffuse large B cell lymphoma. Ann Hematol. 2011. October 11. [DOI] [PubMed] [Google Scholar]
- 34.Heegaard NH, Schetter AJ, Welsh JA, Yoneda M, Bowman ED, Harris CC. Circulating microRNA expression profiles in early stage non-small cell lung cancer. Int J Cancer. 2011. May 4. doi: 10.1002/ijc.26153. [DOI] [PMC free article] [PubMed] [Google Scholar]
- 35.Lionetti M, Biasiolo M, Agnelli L, Todoerti K, Mosca L, Fabris S, Sales G, Deliliers GL, Bicciato S, Lombardi L, Bortoluzzi S, Neri A. Identification of microRNA expression patterns and definition of a microRNA/mRNA regulatory network in distinct molecular groups of multiple myeloma. Blood. 2009. December 10;114(25):e20–6. [DOI] [PubMed] [Google Scholar]
Associated Data
This section collects any data citations, data availability statements, or supplementary materials included in this article.
Supplementary Materials
Supplemental Figure S1: Scatter plot showing the association between the 155 miRNAs and the expression of their 47,385 target genes. The scatter plot reveals a normal distribution centered around coefficient equal to 0.
Supplemental Figure S3: Ingenuity pathway analysis on genes impacted by microRNA-140-3p. Associations were noted with Cell Cycle, Connective Tissue Development, and Cellular Function and Maintenance. The central regulators are p53, NF-KB, and HDAC1.
Supplemental Figure S2: Ingenuity pathway analysis on genes impacted by microRNA-29a/c. Associations were noted with Organismal Injury, Dermatological Diseases and Conditions. The network identified ITGB1, PI3K, and NF-KB as central regulators.