

Abstract
Background
Sub-optimal maternal lipid levels during pregnancy may be implicated in the pathophysiological mechanisms leading to low birth weight (LBW) and small-for-gestational-age (SGA). We aimed to determine whether maternal lipid levels across pregnancy were associated with birth weight and the risks of LBW and SGA in rural Gambia.
Methods
This secondary analysis of the ENID trial involved 573 pregnant women with term deliveries. Plasma levels of total cholesterol (TC), high-density lipoprotein cholesterol (HDL-c), low-density lipoprotein cholesterol (LDL-c), and triglycerides (TG) were analyzed at enrolment (mean (SD) = 13.9 (3.3) weeks gestation), 20 and 30 weeks gestation as continuous variables and percentile groups. Regression models with adjustment for confounders were used to examine associations between gestational lipid levels and birth weight and the risks of LBW (birth weight < 2500 g) and SGA (<10th percentile INTERGROWTH-21ST for birth weight).
Results
There were 7.9% LBW and 32.5% SGA infants. At enrolment, every unit increase in HDL-c was associated with a 2.7% (P = 0.011) reduction in relative risk of LBW. At 20 weeks gestation, every unit increase in TC levels was associated with a 1.3% reduction in relative risk of LBW (P = 0.002). Low (<10th percentile) HDL-c at enrolment or at 20 weeks gestation was associated with a 2.6 (P = 0.007) and 3.0 (P = 0.003) times greater risk of LBW, respectively, compared with referent (10th─90th) HDL-c. High (>90th percentile) LDL-c at 30 weeks gestation was associated with a 55% lower risk of SGA compared with referent LDL-c (P = 0.017). Increased levels of TC (β = 1.3, P = 0.027) at 20 weeks gestation and of TC (β = 1.2, P = 0.006) and LDL-c (β = 1.5, P = 0.002) at 30 weeks gestation were all associated with higher birth weight.
Conclusions
In rural Gambia, lipid levels during pregnancy were associated with infant birth weight and the risks of LBW and SGA. Associations varied by lipid class and changed across pregnancy, indicating an adaptive process by which maternal lipids may influence fetal growth and birth outcomes.
Trial registration
This trial was registered as ISRCTN49285450 on: 12/11/2009.
Keywords: Maternal lipids, Cholesterol, Triglycerides, Birth weight, Low birth weight, Small-for-gestational-age, Pregnancy, The Gambia
Background
Birth weight is a retrospective indicator of fetal growth and maternal health during pregnancy, but also a subsequent predictor of long-term health outcomes for both the mother and her offspring [1–4]. Low birth weight (LBW) is defined as a birth weight below 2500 g and small-for-gestational-age (SGA) as a birth weight less than the 10th percentile for the gestational age [1, 4–6]. In 2015, 20.5 million infants were born LBW, representing 14.6% of all births [7]. Most (91%) LBW infants were born in low- and middle-income countries (LMICs) with almost three-quarters in Asia and sub-Saharan Africa [7]. It has been estimated that in 2012, one in five infants from LMICs were born SGA, representing 23.3 million births in that year [8]. Both LBW and SGA are important indicators used to identify infants at greater risks of morbidity and mortality [4]. LBW infants are about 20 times more likely to die within the neonatal period compared to those born with a normal birth weight (NBW; ≥2500 g) and as a result, LBW is implicated in 60 to 80% of all neonatal deaths [4, 9]. In a study conducted in Mozambique (n = 5542), infants born SGA were found to have five times higher rates of mortality compared to adequate-for-gestational-age (AGA) infants [6].
Accumulating evidence indicates that imbalanced lipid levels during pregnancy may alter fetal lipid metabolism, thereby impacting fetal growth and birth weight, and the metabolism of both the mother and her offspring [10–12]. During pregnancy, pronounced changes in lipid metabolism occur characterized by an elevation of maternal lipids to support the physiological adaptation to gestation and the nutritional and hormonal needs of the gestating mother and the growing fetus [13]. Maternal malnutrition, inflammation or infection during pregnancy may lead to an inadequate response to pregnancy-induced changes in lipid metabolism, abnormal maternal and fetal lipid levels and adverse birth outcomes.
Previous investigations examining potential associations between maternal lipid levels and birth weight have mostly focused on the second trimester of pregnancy and have often used lipid measurements from a single gestational time-point. When compared to mid-range values, low total cholesterol levels (TC) have been associated with lower birth weight [12, 14] and greater risk of LBW [15], and high TC [12, 16] or high triglycerides (TG) levels with higher birth weight [12, 15–19]. In a case-control study conducted in Canada, higher mean levels of high-density lipoprotein (HDL) particles in the second trimester were found in women with term-born SGA infants compared to women with AGA infants [20]. In a population-based study from China, high TG in the third trimester was found associated with reduced risk of SGA [10].
Although LMICs carry the highest burden of LBW and SGA cases, there is a paucity of data on the influence of maternal gestational lipids on birth weight-related outcomes in these settings which may hamper the development of appropriate preventive, screening and prophylactic interventions. The current study aimed to examine associations between maternal lipid levels across pregnancy with birth weight and the risk of LBW and SGA in a cohort from a food-insecure region of rural Gambia, in sub-Saharan Africa.
Methods
Study population
This study is a secondary analysis of the Early Nutrition and Immune Development (ENID) trial; ISRCTN49285450]), a randomized, partially blinded trial investigating the impact of prenatal and infancy nutritional supplementation on infant development in the West Kiang region of The Gambia. The published ENID trial protocol provides complete details of the trial [21] while an overview of relevant information to the current secondary analysis is included here (participant selection outlined in Fig. 1). All non-pregnant women aged 18 to 45 years registered in the West Kiang Demographic Surveillance System (DSS) were invited to participate in the trial [22]. After written consent, all women were visited monthly. Between January 2010 and June 2013, 2798 women were recruited for monthly surveillance of pregnancy. Women who missed their last menses and had a positive urine pregnancy test were invited to the Medical Research Council (MRC) Keneba clinic for an ultrasound examination of pregnancy status and stage. Of the 1195 women with a positive pregnancy test, those confirmed as pregnant but with a gestational age ≥ 20 weeks or a multiple pregnancy or those confirmed as HIV positive or with severe anemia (hemoglobin (Hb) < 7 g/dL) were excluded from the study. A total of 875 pregnant women who met the inclusion criteria were randomized into the antenatal supplementation phase of the trial, yielding 800 live births. For the current analysis, 227 infants were excluded due to missing birth visit (n = 105) or birth weight (n = 41) or not born at term with gestational age at delivery below 37 weeks or over 42 weeks (n = 81), resulting in 573 mother-newborn pairs (Fig. 1). Of note, preterm infants were not included in this analysis due the low numbers of preterm births within the ENID cohort (n = 14).
Fig. 1.
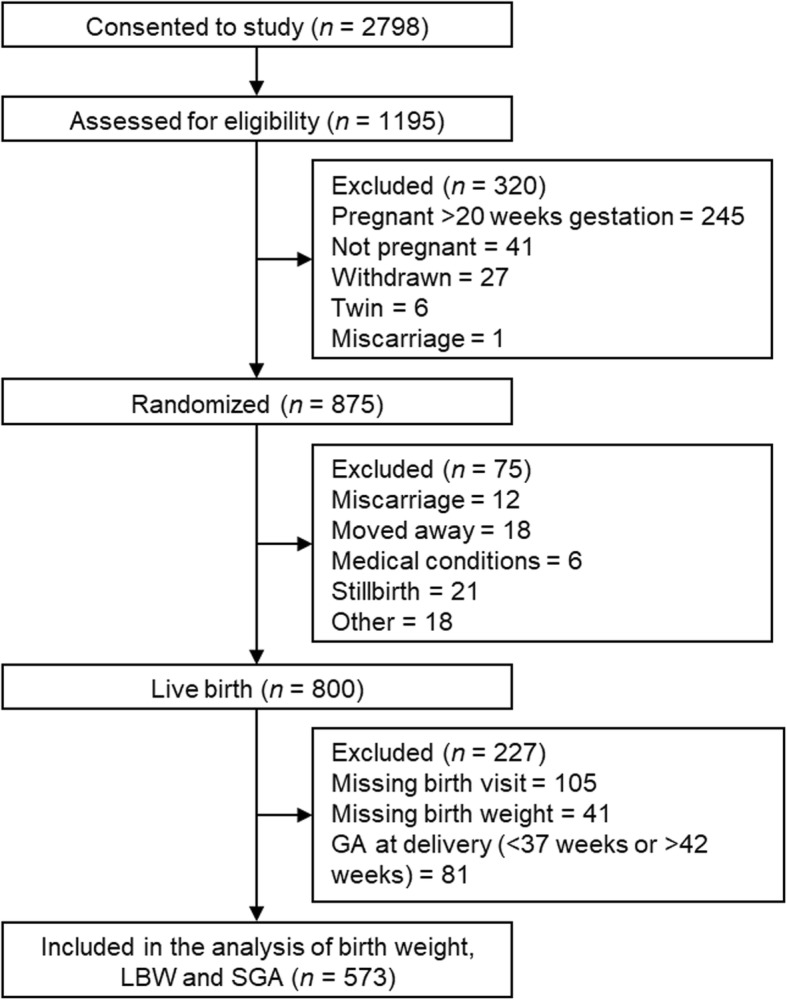
Flow chart of trial participants included in the analysis Abbreviations: LBW; low birth weight and SGA; small-for-gestational-age
Intervention and procedures
The randomization procedure allocated eligible pregnant women to one of four prenatal nutritional supplements; (i) iron folic-acid (FeFol) tablets, the standard of care as per Gambian Government guidelines; (ii) multiple micronutrients (MMN) tablets, a combination of 22 micronutrients designed for use during pregnancy by UNICEF/WHO/UNU [23]; (iii) protein-energy and iron-folate (PE + FeFol), a lipid-based nutritional supplement (LNS); and (iv) protein-energy and multiple micronutrients (PE + MMN). Supplement composition is described in Additional Table A1. Field staff visited enrolled women weekly for supplement provision. During weekly visits, compliance to supplement was evaluated by an assessment of the quantity of supplements not used, and a record of maternal morbidity was also collected.
At enrolment (mean gestational (SD) = 13.9 (3.3) weeks gestation), gestational age was assessed using a Siemens ACUSON Antares Ultrasound Imaging System (Siemens Medical Solutions USA, Inc., California, USA) with a CH6–2 (5.71 MHz) transducer). Further clinic visits were conducted at 20 and 30 weeks gestation. At all visits, data were collected on maternal anthropometry, Hb, blood pressure, and a urinary analysis was performed. A sample of venous blood (10 mL) was also collected following an overnight fast and plasma samples were stored on ice until processing within 1 h of collection. Standardized and validated equipment and standard operating protocols were used and applied for all measurements. A study midwife visited women and their newborns within 72 h of delivery for a standard maternal and newborn health check. Infant weight and length were measured using digital infant scales (Seca mobile digital baby-scale 334; UK) with 10 g precision and a portable infant roll meter (Rollameter 100; Harlow Healthcare, UK) to the nearest 0.1 cm, respectively.
Laboratory analysis of maternal lipids
All maternal plasma samples were collected after an overnight fast and analyzed in the MRC Keneba laboratory for TC, HDL-c, low-density lipoprotein cholesterol (LDL-c), and TG levels using enzymatic colorimetric assays with Roche/Hitachi reagents and COBAS INTEGRA® 400 plus analyzer (Roche Diagnostics, Indianapolis, IN). The few samples that were physiologically aberrant, such as samples with detectable HDL-c and LDL-c levels but with a TC level near zero, were excluded from the analysis.
Outcomes and cofactors
Low birth weight (LBW) was characterized as a birth weight below 2500 g and compared to normal birth weight (NBW) (≥2500 g) [9]. Small-for-gestational-age (SGA) was defined as a birth weight-for-gestational-age below the 10th percentile of the INTERGROWTH-21ST standards for birth weight in comparison to adequate-for-gestational (AGA) (≥10th percentile of the INTERGROWTH-21ST standards for birth weight) [24]. The West Kiang DSS was used to verify mother's birth date and age at enrolment [22]. A questionnaire collected at enrolment was used to determine maternal parity (i.e. numbers of stillbirths and live births). School attendance was defined as a binary variable (yes/no) based on whether enrolled women reported 1 year or more of English or Arabic school and not as the number of school years attended due to the low attendance mean (SD) (0.31 (0.62) years). Maternal BMI was calculated as weight (kg)/height (m)2 at each measurement time point in gestation. Maternal gestational weight gain was calculated by subtracting maternal weight between; enrolment and 20 weeks gestation, 20 and 30 weeks’ gestation, and enrolment and 30 weeks gestation, and by dividing each subtraction by the number of weeks between weight measurements and expressed in kg/week. Maternal morbidity was determined based on the number of self-reports of morbidity episodes (e.g. fever, nausea/vomiting, dysuria, bleeding and abdominal pain) assessed by questionnaire and divided by the number of weeks enrolled in the trial (n/week). Compliance to supplementation from enrolment to delivery (%) was computed by dividing the number of jars of LNS products (PE and PE + MMN) (empty, half-empty, and full) or count of tablets (MMN and FeFol) the women consumed by the number received and multiplying by 100. Birth season of the infant was defined as dry (November to May) or rainy (June to October).
Statistical analyses
Maternal and infant variables were compared between LBW and NBW infants, and between SGA and AGA infants by Student’s t-test with Welch correction for unequal sample sizes. Unadjusted mean TC, HDL-c, LDL-c, and TG levels at enrolment and 20 and 30 weeks’ gestation were calculated with 95% confidence intervals (95% CI) and compared by Student’s t-test. Changes in maternal lipid levels across gestation were examined using a Wilcoxon rank-sum test for ordered groups and a paired sample t-test. Maternal lipid levels were analyzed as continuous variables and grouped into low (<10th), referent (10th–90th), and high (>90th) percentiles. Binary regression models were used to measure the relative risks (RR) of LBW and SGA associated with maternal lipid levels included as continuous or categorical variables (by percentile groups). Reduction in relative risk (RRR) expressed as a percentage was calculated as RRR% = (1-RR) × 100. The RR values for the analyses of the risks of LBW and SGA are presented in Additional Tables A2 and A3, respectively. Linear regression models were used to investigate associations between maternal lipids and birth weight (g) as an outcome. Models were adjusted for confounding factors selected based on previous research and on whether they significantly impacted on the models. For LBW and birth weight outcomes these included enrolment maternal age, parity, supplement groups (FeFol, MMN, PE or PE + MMN), gestational age, BMI, Hb level at lipid measurements, and compliance to supplement during pregnancy and infant birth sex and birth season. For SGA, the same confounding factors were used, but excluding gestational age. A previous analysis of the ENID dataset has shown a complex relationship between season and gestational weight gain on birth outcomes [25]. Given the potential relevance of changes in maternal BMI over pregnancy on gestational lipid levels, we also fitted BMI and changes in BMI within the models presented here. Statistical analyses were conducted with Stata version 15 (StataCorp LP Texas, USA).
Results
Cohort characteristics
A total of 573 pregnant women with singleton term infants were included in this study. There were 45 (7.9%) cases of LBW and 186 (32.5%) cases of SGA. At enrolment, 20.6% of women were underweight (BMI < 18.5 kg/m2), 68.2% were normal weight (BMI 18.5─24.9), 9.1% were overweight (BMI 25─29.9) and 2.1% were obese (BMI ≥ 30 kg/m2). Underweight women were significantly more likely to have a LBW (12.7% vs 6.4%, P = 0.023) or SGA (41.5% vs 29.7%, P = 0.014) infant compared to women with a BMI > 18.5 kg/m2. Table 1 compares the descriptive characteristics of the participants, split according to LBW versus (vs) NBW and SGA vs AGA. Women with LBW infants were enrolled later in the trial, were more likely to be nulliparous, had lower gestational age at delivery, a lower BMI at all time points of gestation and a lower gestational weight gain between enrolment (mean gestational (SD) = 13.9 (3.3) weeks gestation) and 20 weeks gestation compared with women with NBW infants (all, P < 0.05). LBW infants were all born SGA and were more likely to be female (P = 0.012). Women with SGA infants also had a lower BMI at all gestational time points (all, P < 0.01), a lower gestational weight gain between enrolment and 30 weeks gestation (P = 0.028) and higher gestational age at delivery (P = 0.012) compared with women with AGA infants. SGA infants were more likely to be born with a normal birth weight than with a LBW (75.8% vs 24.2%, P < 0.001). There were no significant differences in risk of LBW or SGA by maternal nutritional supplement group.
Table 1.
Comparison of participants characteristics (n = 573) by LBW and SGA infant statusa
| Variablesb | LBW (n = 45) | NBW (n = 528) | p-valuec | SGA (n = 186) | AGA (n = 387) | p-valuec |
|---|---|---|---|---|---|---|
| Mean (SD) | Mean (SD) | Mean (SD) | Mean (SD) | |||
| Maternal variables | ||||||
| Enrolmentd | ||||||
| Gestational age (weeks) | 14.9 (3.4) | 13.8 (3.29) | 0.034 | 14.1 (2.9) | 13.8 (3.5) | 0.249 |
| Age (years) | 29.2 (7.3) | 30.4 (6.5) | 0.274 | 30.3 (6.7) | 30.3 (6.5) | 0.888 |
| Parity (n) | 3.5 (2.7) | 4.3 (2.6) | 0.072 | 4.1 (2.7) | 4.3 (2.5) | 0.504 |
| Nulliparous, n (%) | 9 (20.0) | 40 (7.7) | 0.005 | 39 (8.1) | 10 (12.1) | 0.242 |
| Educated, n (%) | 7 (15.9) | 114 (22.0) | 0.348 | 38 (20.8) | 83 (21.8) | 0.711 |
| Hb (g/L) | 11.4 (1.5) | 11.3 (1.4) | 0.823 | 11.3 (1.5) | 11.4 (1.3) | 0.619 |
| Supplement group, n (%) | 0.916e | 0.323e | ||||
| FeFol | 10 (22.2) | 123 (23.3) | 48 (25.8) | 85 (22.0) | ||
| MMN | 13 (28.9) | 143 (27.1) | 49 (26.3) | 107 (27.7) | ||
| PE | 10 (22.2) | 129 (24.4) | 46 (24.7) | 93 (24.0) | ||
| PE + MMN | 12 (26.7) | 133 (25.2) | 43 (23.1) | 102 (26.4) | ||
| BMI (kg/m2) | 19.7 (3.1) | 21.1 (3.4) | 0.008 | 20.3 (3.0) | 21.3 (3.5) | 0.001 |
| BMI group), n (%) | 0.032e | 0.012e | ||||
| Underweight (< 18.5 kg/m2) | 15 (34.1) | 103 (19.6) | 49 (26.8) | 69 (17.9) | ||
| Normal weight (18.5─24.9 kg/m2) | 26 (59.1) | 365 (69.5) | 119 (65.0) | 272 (70.5) | ||
| Overweight (≥25 kg/m2) | 3 (6.8) | 57 (10.9) | 15 (8.2) | 45 (11.7) | ||
| Weight gain (enrolment to 20 weeks) (kg/week) | 0.28 (0.30) | 0.38 (0.35) | 0.048 | 0.34 (0.31) | 0.39 (0.37) | 0.062 |
| 20 weeks gestation | ||||||
| Hb (g/dL) | 10.7 (1.3) | 10.9 (1.15) | 0.435 | 10.8 (1.2) | 10.9 (1.1) | 0.382 |
| BMI (kg/m2) | 20.8 (3.0) | 22.0 (3.2) | 0.010 | 21.1 (2.8) | 22.3 (3.3) | < 0.001 |
| Weight gain (20 to 30 weeks) (kg/week) | 0.30 (0.16) | 0.30 (0.21) | 0.986 | 0.29 (0.18) | 0.31 (0.22) | 0.256 |
| 30 weeks gestation | ||||||
| Hb (g/dL) | 10.7 (1.4) | 10.6 (1.3) | 0.501 | 10.7 (1.4) | 10.6 (1.3) | 0.320 |
| BMI (kg/m2) | 21.9 (3.0) | 23.1 (3.1) | 0.014 | 22.2 (2.7) | 23.4 (3.2) | < 0.001 |
| Weight gain (enrolment to 30 weeks) (kg/week) | 0.30 (0.13) | 0.33 (0.18) | 0.260 | 0.30 (0.15) | 0.34 (0.19) | 0.028 |
| Across pregnancy | ||||||
| Morbidity episodes (n/week) | 0.18 (0.25) | 0.20 (0.24) | 0.694 | 0.17 (0.19) | 0.20 (0.26) | 0.117 |
| Compliance to nutritional supplement (%)f | 87.6 (9.8) | 87.3 (14.4) | 0.839 | 88.0 (12.6) | 87.0 (14.7) | 0.393 |
| Gestational age at delivery (weeks) | 39.5 (1.1) | 40.2 (0.97) | < 0.001 | 40.3 (1.0) | 40.1 (0.97) | 0.012 |
| Infant variables | ||||||
| Sex, n (%): Female | 31 (68.9) | 261 (49.4) | 0.012 | 92 (49.5) | 200 (51.7) | 0.619 |
| Birth season, n (%): dry (Nov-May) | 33 (73.3) | 322 (61.0) | 0.101 | 122 (65.6) | 233 (60.2) | 0.214 |
aThe total sample comprised 573 mother-infant pairs and was compared according to LBW (< 2.5 kg) versus NBW (≥2.5 kg) and SGA (<10th percentile INTERGROWTH-21ST for birth weight) vs AGA (≥10th percentile INTERGROWTH-21ST for birth weight) and each comparison included the total sample (n = 573)
bValues are means with standard deviation (SD) unless otherwise specified
cP-values were calculated from Student’s t-test with Welch correction for unequal sample sizes by comparing LBW to NBW groups and SGA to AGA groups
dMean (SD) gestational age at enrolment was 13.9 (3.3) weeks gestation
eP-values were calculated by ANOVA
fCompliance to supplement was calculated by dividing the number of jars or tablets the women consumed by the number she received and multiplying by 100
Abbreviations: AGA adequate-for-gestational-age, BMI body mass index, FeFol iron and folic acid, Hb hemoglobin, LBW low birth weight, MMN multiple micronutrient, NBW normal birth weight, PE protein energy, SGA small-for-gestational-age
Changes in maternal lipid levels across pregnancy
Mean levels of TC, LDL-c and TG increased from enrolment to 30 weeks gestation (all, P < 0.001) while mean HDL-c levels increased slightly from enrolment to 20 weeks gestation (51.4 vs 53.1 mg/dL, P = 0.003) before decreasing back, by 30 weeks gestation, to similar levels observed at enrolment (53.1 vs 51.2 mg/dL, P < 0.001). Longitudinal changes in maternal lipid levels were compared by LBW vs NBW and SGA vs AGA (Fig. 2). Women with LBW infants had lower mean TC levels at 20 weeks gestation compared to those with NBW infants (133.6 vs 149.6 mg/dL, P = 0.048) (Fig. 2a). Women with SGA infants had lower mean LDL-c (99.5 vs 105.9 mg/dL, P = 0.033), and TG (94.2 vs 99.4 mg/dL, P = 0.048) levels at 30 weeks gestation compared to women with AGA infants (Fig. 2b).
Fig. 2.

Mean maternal plasma lipids at enrolment, 20 and 30 weeks gestation by LBW and SGA status. Mean maternal lipids were compared by Student’s t-test with Welch correction for unequal sample size between low birth weight (LBW) (< 2.5 kg) and normal birth weight infant (NBW) (≥2.5 kg) and between small-for-gestational-age (SGA) (<10th percentile INTERGROWTH-21ST for birth weight) and adequate-for-gestational-age (AGA) (≥10th percentile INTERGROWTH-21ST for birth weight) infants. Mean total cholesterol (TC) levels were significantly lower at 20 weeks gestation in women with LBW infants compared to women with NBW infants (P = 0.048). Women with SGA infants had at 30 weeks gestation lower mean low-density lipoprotein cholesterol (LDL-c) (P = 0.033) and triglycerides (TG) (P = 0.048) levels compared to women with AGA infants. Mean (SD) gestational age at enrolment was 13.9 (3.3) weeks gestation
Links between maternal lipid levels during pregnancy and the risk of delivering a LBW infant were investigated using regression models (Table 2 and Table 3). In the adjusted analyses, every unit increase in HDL-c at enrolment was associated with a 2.7% (P = 0.011) reduction in the relative risk of LBW and every unit increase in TC levels at 20 weeks gestation were associated with a 1.3% reduction in the relative risk of LBW (P = 0.002) (Table 2). Women with low (<10th percentile) HDL-c at enrolment or at 20 weeks gestation had a 2.6 (P = 0.007) and 3.0 (P = 0.003) higher risk of delivering a LBW infant compared to women with referent (10th─90th percentile) HDL-c level, respectively (Table 3).
Table 2.
Relative risk reduction (RRR) (%) (95% CI) of LBW in association with maternal total, HDL and LDL cholesterol and triglycerides levels at enrolment, 20 and 30 weeks gestationa
| Gestation week | RRR (%) (95% CI) | p-value | aRRR (95% CI)b | p-value |
|---|---|---|---|---|
| Total cholesterol | ||||
| Enrolmentc | 0.02 (−0.66, 0.70) | 0.944 | 0.51 (−0.27, 1.3) | 0.196 |
| 20 weeks | 1.1 (0.02, 2.2) | 0.045 | 1.3 (0.49, 2.2) | 0.002 |
| 30 weeks | 0.31 (− 0.28, 0.89) | 0.302 | 0.30 (− 0.39, 0.98) | 0.399 |
| HDL cholesterol | ||||
| Enrolmentc | 1.9 (−0.10, 3.9) | 0.063 | 2.7 (0.64, 4.8) | 0.011 |
| 20 weeks | 2.4 (−0.57, 5.3) | 0.112 | 2.7 (−0.59, 6.0) | 0.106 |
| 30 weeks | 1.1 (−0.95, 3.0) | 0.300 | 0.27 (−1.5, 2.0) | 0.763 |
| LDL cholesterol | ||||
| Enrolmentc | −0.23 (−1.1, 0.59) | 0.581 | −0.01 (− 0.96, 0.92) | 0.977 |
| 20 weeks | 0.66 (− 0.33, 1.6) | 0.190 | 1.0 (− 0.04, 2.1) | 0.060 |
| 30 weeks | 0.23 (−0.41, 0.86) | 0.486 | 0.33 (−0.39, 1.1) | 0.370 |
| Triglycerides | ||||
| Enrolmentc | −0.52 (−1.5, 0.49) | 0.316 | 0.02 (−1.2, 1.2) | 0.977 |
| 20 weeks | −0.19 (−1.6, 1.2) | 0.792 | −0.45 (−2.0, 1.1) | 0.560 |
| 30 weeks | 0.41 (−0.40, 1.2) | 0.320 | 0.33 (−0.50, 1.2) | 0.436 |
aRelative risk reduction was calculated as % = (1 - RR) × 100. The RR values are presented in additional Table A2
bBinary regression models were adjusted with enrolment maternal age, parity, gestational age, hemoglobin concentration, BMI, supplement group, and compliance to supplement during pregnancy, and infant birth sex and birth season
cMean (SD) gestational age at enrolment was 13.9 (3.3) weeks gestation
Abbreviations: HDL high-density lipoprotein, LDL low-density lipoprotein, (a)RRR adjusted relative risk reduction
Table 3.
Relative risk (RR) (95% CI) of LBW by maternal total, HDL and LDL cholesterol and triglycerides levels divided in percentile groups, at enrolment, 20 and 30 weeks gestationa
| Gestation week | mg/dL | LBW, n (%) | Unadjusted | Adjustedb | ||
|---|---|---|---|---|---|---|
| RR (95%CI) | p-value | aRR (95%CI) | p-value | |||
| Total cholesterol | ||||||
| Enrolmentc | ||||||
| Low (<10th) | < 88.6 | 2 (4.1) | 0.42 (0.10, 1.7) | 0.221 | 0.54 (0.14, 2.2) | 0.384 |
| Ref (10th─90th) | 88.6─170.5 | 38 (9.7) | Ref | Ref | ||
| High (>90th) | > 170.5 | 1 (2.0) | 0.21 (0.03, 1.5) | 0.119 | 0.17 (0.02, 1.2) | 0.070 |
| 20 weeks | ||||||
| Low (<10th) | < 112.9 | 3 (7.1) | 0.90 (0.29, 2.9) | 0.865 | 1.2 (0.78, 1.8) | 0.451 |
| Ref (10th─90th) | 112.9─185.6 | 27 (7.9) | Ref | Ref | ||
| High (>90th) | > 185.6 | 0 (0.0) | – | – | – | – |
| 30 weeks | ||||||
| Low (<10th) | < 123.6 | 2 (4.1) | 0.41 (0.10, 1.6) | 0.195 | 0.38 (0.09, 1.6) | 0.197 |
| Ref (10th─90th) | 123.6─214.2 | 40 (10.2) | Ref | Ref | ||
| High (>90th) | > 214.2 | 1 (2.0) | 0.20 (0.03, 1.4) | 0.103 | 0.20 (0.03, 1.6) | 0.139 |
| HDL cholesterol | ||||||
| Enrolmentc | ||||||
| Low (<10th) | < 33.6 | 7 (13) | 1.6 (0.74, 3.4) | 0.229 | 2.6 (1.3, 5.3) | 0.007 |
| Ref (10th─90th) | 33.6─68.4 | 34 (8.1) | Ref | Ref | ||
| High (>90th) | > 68.4 | 2 (3.8) | 0.47 (0.11, 1.9) | 0.283 | 0.50 (0.12, 2.1) | 0.337 |
| 20 weeks | ||||||
| Low (<10th) | < 36.3 | 6 (12.8) | 2.0 (0.85, 4.6) | 0.115 | 3.0 (1.5, 6.4) | 0.003 |
| Ref (10th─90th) | 36.3─70 | 24 (6.5) | Ref | Ref | ||
| High (>90th) | > 70 | 1 (2.1) | 0.30 (0.05, 2.4) | 0.270 | 0.40 (0.07, 2.6) | 0.341 |
| 30 weeks | ||||||
| Low (<10th) | < 33.3 | 6 (11.5) | 1.3 (0.58, 3.0) | 0.507 | 0.90 (0.37, 2.2) | 0.813 |
| Ref (10th─90th) | 33.3─ 68.4 | 35 (8.8) | Ref | Ref | ||
| High (>90th) | > 68.4 | 4 (7.3) | 0.80 (0.31, 2.3) | 0.716 | 0.90 (0.41, 1.9) | 0.753 |
| LDL cholesterol | ||||||
| Enrolmentc | ||||||
| Low (<10th) | < 43.3 | 3 (5.1) | 0.58 (0.19, 1.8) | 0.357 | 0.63 (0.21, 1.8) | 0.390 |
| Ref (10th─90th) | 43.3─106 | 36 (8.7) | Ref | Ref | ||
| High (>90th) | > 106 | 4 (7.4) | 0.85 (0.31, 2.3) | 0.748 | 0.68 (0.24, 1.9) | 0.467 |
| 20 weeks | ||||||
| Low (<10th) | < 53.4 | 1 (2.2) | 0.28 (0.04, 2.0) | 0.203 | 0.44 (0.10, 2.0) | 0.280 |
| Ref (10th─90th) | 53.4─122.6 | 29 (7.8) | Ref | Ref | ||
| High (>90th) | > 122.6 | 1 (2.1) | 0.30 (0.04, 2.0) | 0.196 | 0.30 (0.04, 2.2) | 0.229 |
| 30 weeks | ||||||
| Low (<10th) | < 62.3 | 2 (3.9) | 0.37 (0.09, 1.5) | 0.159 | 0.42 (0.10, 1.7) | 0.229 |
| Ref (10th─90th) | 62.3─146.6 | 43 (10.6) | Ref | Ref | ||
| High (>90th) | > 146.6 | 0 (0.0) | – | – | – | – |
| Triglycerides | ||||||
| Enrolmentc | ||||||
| Low (<10th) | < 35.4 | 1 (2) | 0.23 (0.03, 1.7) | 0.147 | 0.26 (0.03, 2.0) | 0.193 |
| Ref (10th─90th) | 35.4─88.6 | 37 (8.7) | Ref | Ref | ||
| High (>90th) | > 88.6 | 5 (9.3) | 1.1 (0.44, 2.6) | 0.896 | 0.97 (0.42, 2.2) | 0.937 |
| 20 weeks | ||||||
| Low (<10th) | < 53.1 | 3 (5.3) | 0.70 (0.22, 2.2) | 0.553 | 0.94 (0.28, 3.2) | 0.926 |
| Ref (10th─90th) | 53.1─112.5 | 27 (7.5) | Ref | Ref | ||
| High (>90th) | > 112.5 | 2 (4.3) | 0.60 (0.10, 2.3) | 0.432 | 0.60 (0.20, 2.7) | 0.539 |
| 30 weeks | ||||||
| Low (<10th) | < 65.5 | 2 (4.2) | 0.41 (0.10, 1.6) | 0.203 | 0.44 (0.11, 1.7) | 0.233 |
| Ref (10th─90th) | 65.5─134.6 | 42 (10.3) | Ref | Ref | ||
| High (>90th) | > 134.6 | 1 (2.0) | 0.20 (0.03, 1.4) | 0.098 | 0.20 (0.02, 1.5) | 0.116 |
aBinary regression models between the risk of LBW and maternal lipid levels divided by percentile groups; <10th percentile (low), 10th─90th (reference, Ref), >90th percentile (high)
bAdjusted relative risk (aRR) with enrolment maternal age, parity, gestational age, hemoglobin concentration, BMI, supplement group, and compliance to supplement during pregnancy, and infant birth sex and birth season
cMean (SD) gestational age at enrolment was 13.9 (3.3) weeks gestation
Abbreviations: HDL high-density lipoprotein, LDL low-density lipoprotein, LBW low birth weight, (a)RR adjusted relative risk
Tables 4 and 5 present associations between maternal lipid levels and risk of SGA. In the unadjusted analyses, an association between increased LDL-c levels at 30 weeks gestation and a reduced risk of SGA was detected (RRR = 0.38%, P = 0.048) (Table 4) but no other associations were observed. In both the unadjusted and adjusted analyses, women with high (>90th percentile) LDL-c at 30 weeks gestation had a 55% (P = 0.017) lower risk of delivering an SGA infant compared to women with referent (10th─90th percentile) LDL-c levels (Table 5). In the unadjusted analyses, women with high (>90th percentile) TG at 30 weeks gestation had a 48% (P = 0.035) lower risk of delivering an SGA infant compared to women with referent (10th─90th percentile) TG, however, this association was lost following adjustment for confounding factors (Table 5).
Table 4.
Relative risk reduction (RRR) (%) (95%CI) of SGA in association with maternal total, HDL and LDL cholesterol and triglycerides levels at enrolment, 20 and 30 weeks gestationa
| Gestation week | RRR (%) (95% CI) | p-value | aRRR (95% CI)b | p-value |
|---|---|---|---|---|
| Total cholesterol | ||||
| Enrolmentc | 0.13 (−0.24, 0.51) | 0.489 | 0.11 (−0.28, 0.5) | 0.576 |
| 20 weeks | 0.18 (−0.30, 0.65) | 0.463 | −0.01 (− 0.49, 0.47) | 0.975 |
| 30 weeks | 0.29 (− 0.06, 0.63) | 0.101 | 0.16 (− 0.21, 0.52) | 0.395 |
| HDL cholesterol | ||||
| Enrolmentc | 0.05 (−0.83, 0.92) | 0.919 | 0.32 (−0.63, 1.3) | 0.507 |
| 20 weeks | −0.04 (−1.2, 1.1) | 0.947 | 0.15 (−1.1, 1.3) | 0.808 |
| 30 weeks | 0.02 (−0.93, 0.96) | 0.968 | −0.08 (−1.01, 0.85) | 0.873 |
| LDL cholesterol | ||||
| Enrolmentc | 0.12 (−0.33, 0.57) | 0.604 | 0.00 (−0.45, 0.45) | 0.991 |
| 20 weeks | 0.09 (−0.42, 0.61) | 0.723 | −0.07 (− 0.60, 0.45) | 0.785 |
| 30 weeks | 0.38 (0.00, 0.76) | 0.048 | 0.26 (−0.13, 0.65) | 0.193 |
| Triglycerides | ||||
| Enrolmentc | 0.13 (−0.43, 0.69) | 0.640 | 0.11 (−0.49, 0.69) | 0.725 |
| 20 weeks | 0.33 (−0.25, 0.91) | 0.261 | 0.19 (−0.38, 0.75) | 0.514 |
| 30 weeks | 0.42 (−0.03, 0.87) | 0.068 | 0.32 (−0.14, 0.77) | 0.168 |
aRelative risk reduction was calculated as % = (1 - RR) × 100. The RR values are presented in additional Table A3
bBinary regression models were adjusted with enrolment maternal age, parity, hemoglobin concentration, BMI, supplement group, and compliance to supplement during pregnancy, and infant birth sex and birth season
cMean (SD) gestational age at enrolment was 13.9 (3.3) weeks gestation
Abbreviations: HDL high-density lipoprotein, LDL low-density lipoprotein, (a)RRR adjusted relative risk reduction, SGA small-for-gestational-age
Table 5.
Relative risk (RR) (95% CI) of SGA by maternal total, HDL and LDL cholesterol and triglycerides levels divided in percentile groups, at enrolment, 20 and 30 weeks gestationa
| Gestation week | mg/dL | SGA,n(%) | Unadjusted | Adjustedb | ||
|---|---|---|---|---|---|---|
| RR (95%CI) | p-value | aRR (95%CI) | p-value | |||
| Total cholesterol | ||||||
| Enrolmentc | ||||||
| Low (<10th) | < 88.6 | 13 (26.5) | 0.78 (0.48, 1.3) | 0.312 | 0.82 (0.51, 1.3) | 0.422 |
| Ref (10th─90th) | 88.6─170.5 | 133 (34.1) | Ref | Ref | ||
| High (>90th) | > 170.5 | 11 (22.5) | 0.66 (0.38, 1.1) | 0.128 | 0.73 (0.42, 1.2) | 0.246 |
| 20 weeks | ||||||
| Low (<10th) | < 112.9 | 16 (38.1) | 1.2 (0.79, 1.8) | 0.401 | 1.1 (0.69, 1.8) | 0.672 |
| Ref (10th─90th) | 112.9─185.6 | 109 (31.9) | Ref | Ref | ||
| High (>90th) | > 185.6 | 11 (25.6) | 0.80 (0.47, 1.4) | 0.419 | 0.86 (0.51, 1.5) | 0.576 |
| 30 weeks | ||||||
| Low (<10th) | < 123.6 | 15 (30.6) | 0.93 (0.59, 1.4) | 0.742 | 0.82 (0.51, 1.3) | 0.427 |
| Ref (10th─90th) | 123.6─214.2 | 129 (33) | Ref | Ref | ||
| High (>90th) | > 214.2 | 10 (20) | 0.61 (0.34, 1.1) | 0.087 | 0.65 (0.36, 1.2) | 0.142 |
| HDL cholesterol | ||||||
| Enrolmentc | ||||||
| Low (<10th) | < 33.6 | 18 (33.3) | 1.0 (0.67, 1.5) | 0.981 | 1.2 (0.82, 1.7) | 0.352 |
| Ref (10th─90th) | 33.6─68.4 | 139 (33.2) | Ref | Ref | ||
| High (>90th) | > 68.4 | 15 (28.3) | 0.85 (0.54, 1.3) | 0.489 | 0.82 (0.50, 1.4) | 0.443 |
| 20 weeks | ||||||
| Low (<10th) | < 36.3 | 19 (40.4) | 1.4 (0.95, 2.0) | 0.095 | 1.7 (1.3, 2.3) | 0.052 |
| Ref (10th─90th) | 36.3─70 | 108 (29.2) | Ref | Ref | ||
| High (>90th) | > 70 | 16 (34) | 1.2 (0.76, 1.8) | 0.482 | 1.2 (0.81, 1.9) | 0.312 |
| 30 weeks | ||||||
| Low (<10th) | < 33.3 | 15 (28.9) | 0.88 (0.56, 1.4) | 0.580 | 0.80 (0.51, 1.3) | 0.337 |
| Ref (10th─90th) | 33.3─ 68.4 | 131 (32.8) | Ref | Ref | ||
| High (>90th) | > 68.4 | 17 (30.9) | 0.94 (0.62, 1.4) | 0.787 | 0.88 (0.57, 1.3) | 0.543 |
| LDL cholesterol | ||||||
| Enrolmentc | ||||||
| Low (<10th) | < 43.3 | 18 (30.5) | 0.92 (0.61, 1.4) | 0.688 | 0.89 (0.59, 1.4) | 0.601 |
| Ref (10th─90th) | 43.3─106 | 137 (33.2) | Ref | Ref | ||
| High (>90th) | > 106 | 17 (31.5) | 0.95 (0.63, 1.4) | 0.806 | 1.0 (0.66, 1.5) | 0.991 |
| 20 weeks | ||||||
| Low (<10th) | < 53.4 | 15 (32.6) | 1.1 (0.69, 1.7) | 0.733 | 1.05 (0.65, 1.7) | 0.851 |
| Ref (10th─90th) | 53.4─122.6 | 112 (30.2) | Ref | Ref | ||
| High (>90th) | > 122.6 | 16 (34) | 1.1 (0.74, 1.7) | 0.582 | 1.3 (0.84, 1.9) | 0.265 |
| 30 weeks | ||||||
| Low (<10th) | < 62.3 | 18 (35.3) | 1.0 (0.70, 1.5) | 0.843 | 0.86 (0.54, 1.4) | 0.543 |
| Ref (10th─90th) | 62.3─146.6 | 137 (33.9) | Ref | Ref | ||
| High (>90th) | > 146.6 | 8 (15.4) | 0.45 (0.24, 0.90) | 0.018 | 0.45 (0.23, 0.90) | 0.017 |
| Triglycerides | ||||||
| Enrolmentc | ||||||
| Low (<10th) | < 35.4 | 12 (24.5) | 0.73 (0.44, 1.2) | 0.229 | 0.70 (0.42, 1.2) | 0.181 |
| Ref (10th─90th) | 35.4─88.6 | 142 (33.5) | Ref | Ref | ||
| High (>90th) | > 88.6 | 18 (33.3) | 1.0 (0.67, 1.5) | 0.982 | 0.95 (0.62, 1.5) | 0.798 |
| 20 weeks | ||||||
| Low (<10th) | < 53.1 | 20 (35.1) | 1.1 (0.74, 1.6) | 0.653 | 1.1 (0.75, 1.6) | 0.649 |
| Ref (10th─90th) | 53.1─112.5 | 116 (32.1) | Ref | Ref | ||
| High (>90th) | > 112.5 | 9 (19.2) | 0.60 (0.30, 1.1) | 0.095 | 0.70 (0.40, 1.2) | 0.195 |
| 30 weeks | ||||||
| Low (<10th) | < 65.5 | 15 (31.3) | 0.92 (0.59, 1.4) | 0.709 | 0.83 (0.53, 1.3) | 0.444 |
| Ref (10th─90th) | 65.5─134.6 | 139 (34) | Ref | Ref | ||
| High (>90th) | > 134.6 | 9 (17.7) | 0.52 (0.28, 0.99) | 0.035 | 0.54 (0.29, 1.0) | 0.068 |
aBinary regression models between the risk of SGA and maternal lipid levels divided by percentile groups; <10th percentile (low), 10th─90th (reference, Ref), >90th percentile (high)
bAdjusted relative risk were adjusted with enrolment maternal age, parity, hemoglobin concentration, BMI, supplement group, and compliance to supplement during pregnancy, and infant birth sex and birth season
cMean (SD) gestational age at enrolment was 13.9 (3.3) weeks gestation
Abbreviations: HDL high-density lipoprotein, LDL low-density lipoprotein, (a)RRR adjusted relative risk reduction, SGA small-for-gestational-age
Linear regression models were used to examine associations between maternal lipid levels during pregnancy and birth weight (Table 6 and Table 7). In the unadjusted analyses, increased levels of TC and LDL-c at 20 and 30 weeks gestation and of TG at 30 weeks gestation were all associated with a higher infant birth weight (all, P < 0.05) (Table 6). After adjustment with confounding factors, only increased levels of TC at 20 weeks gestation (β = 1.3, P = 0.027) and of TC (β = 1.2, P = 0.006) and LDLc (β = 1.5, P = 0.002) at 30 weeks gestation remained associated with a higher birth weight (Table 6). In both the unadjusted and adjusted analyses, women with high (>90th percentile) levels of TC, LDL-c or TG at 30 weeks gestation had infants with higher birth weights compared with women with referent (10th─90th percentile) levels (P < 0.05) (Table 7).
Table 6.
Beta coefficients (95% CI) for maternal total, HDL and LDL cholesterol and triglycerides levels, at enrolment, 20 and 30 weeks gestation, in association with birth weight in grams
| Gestation week | Unadjusted | Adjusteda | ||||
|---|---|---|---|---|---|---|
| R2 | β (95% CI) | p-value | R2 | β (95% CI) | p-value | |
| Total cholesterol | ||||||
| Enrolmentb | 0.012 | 0.90 (−0.01, 1.9) | 0.052 | 0.152 | 1.1 (− 0.01, 2.2) | 0.053 |
| 20 weeks | 0.010 | 1.3 (0.20, 2.4) | 0.026 | 0.130 | 1.3 (0.20, 2.5) | 0.027 |
| 30 weeks | 0.012 | 1.1 (0.30, 1.9) | 0.006 | 0.098 | 1.2 (0.30, 2.0) | 0.006 |
| HDL cholesterol | ||||||
| Enrolmentb | 0.002 | 0.10 (−2.2, 2.4) | 0.933 | 0.140 | 0.66 (−2.0, 3.3) | 0.621 |
| 20 weeks | 0.001 | 1.0 (−1.5, 3.6) | 0.427 | 0.113 | 1.5 (−1.3, 4.2) | 0.295 |
| 30 weeks | 0.001 | 0.80 (− 1.5, 3.0) | 0.500 | 0.086 | 0.90 (−1.5, 3.3) | 0.457 |
| LDL cholesterol | ||||||
| Enrolmentb | 0.009 | 1.0 (−0.10, 2.2) | 0.080 | 0.142 | 0.80 (− 0.40, 2.1) | 0.206 |
| 20 weeks | 0.009 | 1.3 (0.10, 2.5) | 0.033 | 0.119 | 1.1 (−0.10, 2.4) | 0.082 |
| 30 weeks | 0.018 | 1.5 (0.60, 2.4) | 0.001 | 0.104 | 1.5 (0.50, 2.4) | 0.002 |
| Triglycerides | ||||||
| Enrolmentb | 0.003 | 0.40 (−1.1, 2.0) | 0.589 | 0.139 | 0.80 (− 1.0, 2.7) | 0.385 |
| 20 weeks | 0.002 | 0.70 (−0.60, 2.1) | 0.292 | 0.119 | 0.50 (−1.0, 2.0) | 0.511 |
| 30 weeks | 0.007 | 1.1 (0.10, 2.1) | 0.039 | 0.093 | 1.0 (−0.10, 2.1) | 0.068 |
aLinear regression models were adjusted with maternal age, parity, gestational age, hemoglobin concentration, BMI, supplement group, and compliance to supplement during pregnancy, and infant birth sex and birth season
bMean (SD) gestational age at enrolment was 13.9 (3.3) weeks gestation
Abbreviations: HDL high-density lipoprotein, LDL low-density lipoprotein
Table 7.
Mean differences in birth weight by percentile groups of maternal total, HDL and LDL cholesterol and triglycerides levels, at enrolment, 20 and 30 weeks gestationa
| Gestation week | mg/dL | N | Unadjusted | Adjustedb | ||
|---|---|---|---|---|---|---|
| Mean difference (95% CI) in birth weight (g) | p-value | Mean difference (95% CI) in birth weight (g) | p-value | |||
| Total cholesterol | ||||||
| Enrolmentc | ||||||
| Low (<10th) | < 88.6 | 49 | 3.2 (− 108.4, 114.8) | 0.955 | 4.1 (− 109.3, 117.4) | 0.944 |
| Ref (10th─90th) | 88.6─170.5 | 390 | Ref | Ref | ||
| High (>90th) | > 170.5 | 49 | 62.6 (−45.7, 170.9) | 0.257 | 33.0 (−80.8, 146.9) | 0.569 |
| 20 weeks | ||||||
| Low (<10th) | < 112.9 | 42 | −21.0 (− 131.2, 89.2) | 0.708 | −31.3 (− 142.3, 79.7) | 0.580 |
| Ref (10th─90th) | 112.9─185.6 | 342 | Ref | Ref | ||
| High (>90th) | > 185.6 | 43 | 109.8 (−1.2, 220.8) | 0.052 | 110.1 (−9.1, 229.3) | 0.070 |
| 30 weeks | ||||||
| Low (<10th) | < 123.6 | 49 | −51.2 (−130.1, 27.7) | 0.203 | −45.3 (− 126.0, 35.4) | 0.270 |
| Ref (10th─90th) | 123.6─214.2 | 391 | Ref | Ref | ||
| High (>90th) | > 214.2 | 50 | 108.9 (11.7, 206.1) | 0.028 | 111.2 (9.0, 213.3) | 0.033 |
| HDL cholesterol | ||||||
| Enrolmentc | ||||||
| Low (<10th) | < 33.6 | 54 | −11.9 (−130.9, 107.2) | 0.845 | −42.1 (− 164.2, 79.9) | 0.498 |
| Ref (10th─90th) | 33.6─68.4 | 419 | Ref | Ref | ||
| High (>90th) | > 68.4 | 53 | 37.1 (−66.9, 141.2) | 0.484 | 37.8 (−73.4, 149.1) | 0.504 |
| 20 weeks | ||||||
| Low (<10th) | < 36.3 | 47 | −55.0 (− 171.5, 61.5) | 0.354 | −100.5 (−214.3, 13.4) | 0.084 |
| Ref (10th─90th) | 36.3─70 | 370 | Ref | Ref | ||
| High (>90th) | > 70 | 47 | −2.5 (− 100.4, 95.5) | 0.961 | −6.4 (−116.8, 104.0) | 0.909 |
| 30 weeks | ||||||
| Low (<10th) | < 33.3 | 52 | −31.5 (−133.5, 70.5) | 0.544 | −14.8 (− 121.2, 91.5) | 0.784 |
| Ref (10th─90th) | 33.3─ 68.4 | 400 | Ref | Ref | ||
| High (>90th) | > 68.4 | 55 | −9.0 (− 118.2, 100.1) | 0.871 | 5.7 (−103.1, 114.5) | 0.918 |
| LDL cholesterol | ||||||
| Enrolmentc | ||||||
| Low (<10th) | < 43.3 | 59 | 2.7 (−101.3, 106.7) | 0.959 | 5.2 (−95.1, 105.4) | 0.919 |
| Ref (10th─90th) | 43.3─106 | 413 | Ref | Ref | ||
| High (>90th) | > 106 | 54 | −6.6 (−114.6, 101.5) | 0.905 | −27.7 (−139.1, 83.7) | 0.626 |
| 20 weeks | ||||||
| Low (<10th) | < 53.4 | 46 | −15.4 (− 123.8, 93.0) | 0.780 | −9.3 (− 119.9, 101.3) | 0.868 |
| Ref (10th─90th) | 53.4─122.6 | 371 | Ref | Ref | ||
| High (>90th) | > 122.6 | 47 | 42.1 (−67.3, 151.4) | 0.450 | 24.2 (−93.8, 142.3) | 0.687 |
| 30 weeks | Ref | |||||
| Low (<10th) | < 62.3 | 51 | −51.9 (−141.1, 37.3) | 0.254 | −54.3 (− 153.1, 44.6) | 0.281 |
| Ref (10th─90th) | 62.3─146.6 | 404 | Ref | Ref | ||
| High (>90th) | > 146.6 | 52 | 122.1 (30.8, 213.4) | 0.009 | 125.3 (29.7, 220.8) | 0.010 |
| Triglycerides | ||||||
| Enrolmentc | ||||||
| Low (<10th) | < 35.4 | 49 | 87.4 (−27.6, 202.5) | 0.136 | 92.6 (−22.3, 207.5) | 0.114 |
| Ref (10th─90th) | 35.4─88.6 | 424 | Ref | Ref | ||
| High (>90th) | > 88.6 | 54 | 41.7 (−77.8, 161.2) | 0.493 | 34.9 (−96.6, 166.3) | 0.602 |
| 20 weeks | Ref | |||||
| Low (<10th) | < 53.1 | 57 | 28.5 (−72.3, 129.3) | 0.578 | 26.5 (−79.6, 132.5) | 0.624 |
| Ref (10th─90th) | 53.1─112.5 | 361 | Ref | Ref | ||
| High (>90th) | > 112.5 | 47 | 89.6 (−21.5, 200.6) | 0.114 | 59.6 (−54.3, 173.5) | 0.304 |
| 30 weeks | ||||||
| Low (<10th) | < 65.5 | 48 | 28.5 (−70.3, 127.3) | 0.571 | 21.0 (−89.5, 131.5) | 0.709 |
| Ref (10th─90th) | 65.5─134.6 | 409 | Ref | Ref | ||
| High (>90th) | > 134.6 | 51 | 126.5 (25.0, 227.9) | 0.015 | 121.8 (5.2, 238.4) | 0.041 |
aMaternal lipid levels were divided by percentile groups; <10th percentile (low), 10th─90th (reference, Ref), >90th percentile (high)
bAdjusted mean birth weight with maternal age, parity, gestational age, hemoglobin concentration, BMI, supplement group, and compliance to supplement during pregnancy, and infant birth sex and birth season
cMean (SD) gestational age at enrolment was 13.9 (3.3) weeks gestation
Abbreviations: HDL high-density lipoprotein, LDL low-density lipoprotein
In a sub-analysis, we explored potential interactions between maternal nutritional supplement groups, BMI, lipid levels and infant birth weight outcomes (Additional Tables A4 to A8). Associations were observed between maternal nutritional supplement groups and maternal lipid levels during pregnancy (Table A4). Compared to FeFol (referent/control group), supplementation with PE + MMN was associated with lower HDLc levels at 20 (β = − 3.7, P = 0.028) and 30 (β = − 4.3, P = 0.013) weeks gestation, and supplementation with PE was associated with higher LDL-c levels (β = 9.3, P = 0.034) at 30 weeks gestation (Table A4). We also detected associations between maternal lipid levels and BMI during pregnancy (Table A5). At enrolment, a lower BMI was associated with increased HDL-c levels (β = − 0.025, P = 0.021) whereas a higher BMI was associated with increased LDL-c levels (β = 0.012, P = 0.034). At 20 and 30 weeks gestation, higher BMIs were linked to increased TG levels (β = 0.011, P = 0.018 and β = 0.009, P = 0.048, respectively) (Table A5). However, there were no associations between maternal nutritional supplement groups and maternal BMI at any timepoint across pregnancy (Table A6). Additionally, maternal supplement groups were not associated with the risks of LBW or SGA (Table A7) or birth weight (Table A8).
Discussion
In this cohort of pregnant women from rural Gambia, plasma lipid levels were lower compared to those reported in studies from high-income countries [26–29] or urban areas in LMICs [30], likely reflecting the typical diet in rural Gambia which is low in animal-source foods and consists mainly of carbohydrate-rich staple foods. Low HDL-c levels in the first half of pregnancy were associated with three times the risk of LBW. Increased TC levels from mid-pregnancy were associated with higher birth weight and high LDL-c at 30 weeks gestation was associated with half the risk of SGA. These findings suggest that dietary interventions to improve diet and increase cholesterol levels during pregnancy may promote fetal growth and reduce adverse birth weight-related outcomes.
Consistent with previous studies, we observed an increase in plasma TC, LDL-c and TG levels across pregnancy [10, 16, 17, 26, 27], which is known to be part of a normal physiological response to gestation [28]. However, unlike in studies from higher-income countries [10, 27, 28], our data show a decrease in HDL-c levels from 20 to 30 weeks gestation, following an initial rise across the first half of pregnancy. Similarly, a study conducted in rural India (n = 631) reported a decrease in maternal HDL-c levels between 18 and 28 weeks gestation [16]. These observations indicate that dietary intake may influence changes in HDL-c level across pregnancy and specifically the ability to maintain HDL-c levels in the latter part of gestation.
In line with previous research from a range of settings, relationships between maternal TC, HDL-c, LDL-c, and TG levels during pregnancy and size at birth were observed in our study. An association between increased TC levels at 20 weeks gestation and a reduced risk of LBW was detected and increased TC levels at both 20 and 30 weeks’ gestation were associated with higher birth weight. In a study conducted in Nigeria (n = 261), women with low TC in early pregnancy had a 2-fold increased risk of delivering an LBW infant compared to women with TC levels within the mid-range [15]. Likewise, in a study conducted in rural India, TC levels at both 18 and 28 weeks gestation were associated with higher infant birth weight [16]. These findings are consistent with the high demand for cholesterol during pregnancy to meet both maternal and fetal needs [10]. Although the primary source of cholesterol for the fetus may be derived from fetal biosynthesis, recent studies demonstrated that placental trophoblast and endothelial cells can effectively transfer maternal cholesterol to the fetus throughout pregnancy, thus impacting on fetal growth and infant birth weight [29–31].
Similar to our findings of an association between low HDL-c in the second trimester and greater risk of LBW, a study conducted in the US (n = 1207) reported that low HDL-c measured at 16–27 weeks gestation was associated with a lower birth weight [12]. Low HDL-c levels in non-pregnant populations have been associated with atherogenic lipid profiles and higher risks of cardiovascular disease and mortality [32–34]. During pregnancy, low HDL-c levels have been linked to greater risks of adverse pregnancy outcomes [35], including preterm birth [36], a shorter pregnancy length [27] and pre-eclampsia [35, 37]. One of the main functions of HDL is to promote reverse cholesterol transport from peripheral tissues to the liver for excretion in bile acids. Since HDL presents anti-atherogenic and anti-inflammatory properties, a low level of HDL-c during pregnancy may increase the risk of endothelial damage in uteroplacental and fetal tissues caused by inflammation resulting in placental dysfunction, inadequate supply of oxygen and nutrients to the fetus and intrauterine growth restriction (IUGR) [38, 39].
Additionally, at 30 weeks gestation, we detected associations between high LDL-c and reduced risk of SGA and between increased LDL-c levels and higher infant birth weight. This corroborates the findings of a study conducted in Scotland (n = 66) which reported an association between low LDL-c in the first trimester and IUGR [40]. Studies in both animal models and human subjects suggest that fetal growth is supported by the uptake of maternal cholesterol from the circulation by the placenta via various receptors including VLDL and LDL receptors [31, 41, 42]. Therefore, increased maternal LDL-c levels during pregnancy may promote fetal growth and higher infant birth weight.
In accord with previous research, our data show that at 30 weeks gestation women with high TG delivered infants who were on average 122 g heavier than those born to women with referent TG values. And, women with SGA infants had lower mean TG levels compared to those with AGA infants. Notably, Kulkarni et al. reported that a one SD higher TG level at 28 weeks gestation was associated with a 36 g higher birth weight [16] and Jin et al. reported that increased TG levels in the third trimester were associated with a reduced risk of SGA [10]. However, contrary to studies conducted in populations with greater rates of overweight and obesity [12, 17, 19, 43], our data suggests a limited impact of TG on birth weight-related outcomes, which may be linked to the lower levels of TG detected in this cohort and may reflect poor dietary intake of TG [36, 44–46]. Maternal TG and their derived non-esterified fatty acids (NEFA) are mainly obtained through maternal diet and their levels during pregnancy have been shown to directly correlate with fetal lipid levels and fetal growth, thereby impacting birth weight [47].
Although all LBW infants were also born SGA in our study, the results show differences in the relationships between maternal lipids during pregnancy and the risks of LBW and SGA. While increased HDL-c or TC levels in the first half of pregnancy were linked to a reduced risk of LBW, high LDL-c or TG at 30 weeks gestation were related to a reduced risk of SGA. This suggests that the pathophysiological mechanisms linking gestational lipid levels to the risk of LBW may arise early in gestation, during the anabolic phase of pregnancy characterized by an accumulation of fat in maternal adipose tissue [48]. Inadequate levels of anti-atherogenic and anti-inflammatory molecules (i.e. HDL) during this phase may cause lipid obstruction of vascular tissues and inflammation resulting in a cascade of events leading to LBW. Maternal inflammation during pregnancy has been associated with IUGR in a study conducted in rural Nepal (n = 653) [49] and with lower birth weight in a cohort (n = 144) from Tanzania [50]. In contrast, the pathophysiological mechanisms associated with the risk of SGA may appear later in pregnancy; during the catabolic phase where insulin resistance and placental hormones induce the release of free fatty acids from maternal adipose tissue to meet the heightened fetal energy demands. Low pregnancy weight gain may cause insufficient storage of energy in adipose tissue and supply of cholesterol or TG to the fetus during the catabolic phase of pregnancy. This may reduce fetal growth and result in an infant born SGA. Inadequate weight gain during the third trimester has been linked to IUGR and SGA in a study conducted in rural Bangladesh (n = 1463) [51]. Altered adipose tissue and reduced body fat mass have been reported in infants born SGA compared to those born AGA or LGA [52, 53].
Maternal undernutrition during pregnancy causes metabolic stresses which may adversely impact on fetal growth and birth outcomes. In this study and others, underweight women were found more likely to have an LBW or SGA infant compared to women with a normal weight [48–51]. Furthermore, our results show that although maternal nutritional supplementation with a lipid-based supplement (PE or PE + MMN) during pregnancy was associated with altered lipid levels, no direct associations were observed between maternal supplement groups and birth weight outcomes. This may indicate a limited effect of supplementation during pregnancy and a greater role of maternal weight on infant birth weight outcomes in this cohort [54].
The major strengths of this study include the use of a large cohort from a population in rural sub-Saharan Africa, bringing new perspectives into the relationships between maternal lipids and infant birth outcomes in populations where the burden of LBW and SGA is the highest and where research findings are limited. The measurements of maternal plasma TC, HDL-c, LDL-c, and TG levels at three-time points across pregnancy allow a greater understanding of the adaptive process through which maternal lipids impact on fetal growth. The assessment of potential associations using maternal lipid levels as continuous variables and percentile groups with or without adjustment with confounding factors allowed a robust and thorough analysis of the links between gestational lipids and birth weight-related outcomes.
Limitations of this study should be noted, and caution should be taken in the interpretation of the results. This study is a secondary analysis of a clinical trial of nutritional supplementation which by its observational design precludes any conclusion on causal links between maternal lipid levels and infant’s size at birth. Pregnant women in our study were healthy, had a singleton infant and received supplementation and comprehensive antenatal care throughout pregnancy, and therefore may not be representative of all eligible Gambian women. A further limitation of the trial design was the lack of data or samples from late pregnancy to allow lipid measurements after 30 weeks gestation. Such data may have contributed to the understanding of the relationships between gestational lipids and birth outcomes.
Conclusions
In conclusion, our data from rural sub-Saharan Africa indicate that maternal plasma lipid levels during pregnancy may influence fetal growth, thereby impacting on birth weight and the risks of LBW and SGA. Importantly, our findings suggest that distinct pathophysiological pathways may be involved in the relationships between maternal lipid levels during pregnancy and LBW and SGA outcomes, with differential effects according to the lipid component and the stage of gestation. Additionally, in this cohort of primarily subsistence farming women, underweight women were found at greater risk of having an LBW or SGA infant, highlighting the critical role of maternal nutritional status on birth weight outcomes. Thus, our study supports interventions that monitor and optimize maternal lipid levels across pregnancy while promoting an adequate gestational weight gain.
Supplementary information
Additional file 1 Table A1. Nutritional composition of the allocated daily intake of pregnancy supplements. Table A2. Relative risk of LBW (95%CI) associated with maternal total, HDL and LDL cholesterol and triglycerides levels at enrolment, 20 and 30 weeks gestation. Table A3. Relative risk of SGA (95%CI) associated with maternal total, HDL and LDL cholesterol and triglycerides levels at enrolment, 20 and 30 weeks’ gestation. Table A4. Associations between maternal nutritional supplement groups and maternal total, HDL and LDL cholesterol and triglycerides levels at enrolment, 20 and 30 weeks gestation. Table A5. Beta coefficients (95% confidence intervals) of associations between maternal total, HDL, LDL cholesterol and triglycerides levels and BMI at enrolment, 20 and 30 weeks gestation. Table A6. Associations between maternal nutritional supplement groups and maternal BMI at enrolment, 20 and 30 weeks gestation. Table A7. Relative risk of LBW and SGA by maternal nutritional supplementation groups. Table A8. Beta coefficient of the associations between maternal nutritional supplement groups during pregnancy and birth weight.
Acknowledgments
We thank the women and their infants of West Kiang who patiently participated in the study. We acknowledge the enthusiastic work of the ENID study team, especially the fieldworkers, village assistants, midwives, clinical staff and laboratory technicians who tirelessly collected the data and samples. We acknowledge the support of Mr. Bakary Sonko and colleagues in the Keneba data office for the development and management of the ENID database.
Abbreviations
- AGA
Adequate-for-gestational-age
- BMI
Body mass index
- CI
Confidence intervals
- DSS
Demographic surveillance system
- ENID
Early nutrition and immune development
- Hb
Hemoglobin
- HDL-c
High-density lipoprotein cholesterol
- IUGR
Intrauterine growth restriction
- LBW
Low birth weight
- LDL-c
Low-density lipoprotein cholesterol
- LGA
Large-for-gestational-age
- LMIC
Low- and middle-income country
- MRC
Medical Research Council;
- NEFA
Non-esterified fatty acids
- SD
Standard deviation
- SGA
Small-for-gestational-age
- TC
Total cholesterol
- TG
Triglycerides
- UNICEF
United Nations Children’s Fund
- UNU
United Nations University
- WHO
World Health Organization
Authors’ contributions
SEM and AMP conceived the ENID trial. SEM, EAS and FS conducted the fieldwork and sample collection. EAS conducted sample analysis. SEM, AMP & LAW conceived this add-on study to the ENID trial. SGO conducted the statistical analysis and wrote the first draft of the manuscript and SEM and LAW provided inputs. All authors contributed to the final version of the manuscript.
Funding
The ENID trial was jointly funded by the Medical Research Council (UK) & the Department for International Development (DFID) under the MRC/DFID Concordat agreement (MC-A760-5QX00). The current research was supported by a Bill & Melinda Gates Foundation Grand Challenges Explorations Award (OPP1110668) (LAW). The funding bodies had no role in the study design, or in the collection, analysis and interpretation of data and in writing the manuscript.
Availability of data and materials
The dataset analyzed in this paper is available from the corresponding author on reasonable request, and with appropriate additional ethical approvals, where necessary.
Ethics approval and consent to participate
The ENID trial and this sub-study obtained ethical approval from the Joint Gambian Government/Medical Research Council (MRC) Unit The Gambia ethics committee. Written informed consent was obtained from all women prior to enrolment into the study. The trial followed Good Clinical Practice Standards and the current version of the Helsinki Declaration. Approval for this sub-study was additionally obtained from the Institutional Review Board at the University of Cincinnati.
Consent for publication
Not applicable.
Competing interests
The authors declare that they have no competing interests.
Footnotes
Publisher’s Note
Springer Nature remains neutral with regard to jurisdictional claims in published maps and institutional affiliations.
Laura A. Woollett and Sophie E. Moore are Co-senior authors.
Supplementary information
Supplementary information accompanies this paper at 10.1186/s12884-020-2834-1.
References
- 1.Risnes KR, Vatten LJ, Baker JL, Jameson K, Sovio U, Kajantie E, et al. Birthweight and mortality in adulthood: a systematic review and meta-analysis. Int J Epidemiol. 2011;40(3):647–661. doi: 10.1093/ije/dyq267. [DOI] [PubMed] [Google Scholar]
- 2.Catov JM, Dodge R, Yamal JM, Roberts JM, Piller LB, Ness RB. Prior preterm or small-for-gestational-age birth related to maternal metabolic syndrome. Obstet Gynecol. 2011;117(2 Pt 1):225–232. doi: 10.1097/AOG.0b013e3182075626. [DOI] [PMC free article] [PubMed] [Google Scholar]
- 3.Bonamy AK, Parikh NI, Cnattingius S, Ludvigsson JF, Ingelsson E. Birth characteristics and subsequent risks of maternal cardiovascular disease: effects of gestational age and fetal growth. Circulation. 2011;124(25):2839–2846. doi: 10.1161/CIRCULATIONAHA.111.034884. [DOI] [PubMed] [Google Scholar]
- 4.UNICEF and WHO. Low Birthweight: country, Regional and Global Estimates. UNICEF; 2004. p. 27. ISBN:92-806-3832-7. https://www.unicef.org/publications/index_24840.html.
- 5.Saigal S, Doyle LW. An overview of mortality and sequelae of preterm birth from infancy to adulthood. Lancet. 2008;371(9608):261–269. doi: 10.1016/S0140-6736(08)60136-1. [DOI] [PubMed] [Google Scholar]
- 6.Garcia-Basteiro AL, Quinto L, Macete E, Bardaji A, Gonzalez R, Nhacolo A, et al. Infant mortality and morbidity associated with preterm and small-for-gestational-age births in southern Mozambique: a retrospective cohort study. PLoS One. 2017;12(2):e0172533. doi: 10.1371/journal.pone.0172533. [DOI] [PMC free article] [PubMed] [Google Scholar]
- 7.Blencowe H, Cousens S, Jassir FB, Say L, Chou D, Mathers C, et al. National, regional, and worldwide estimates of stillbirth rates in 2015, with trends from 2000: a systematic analysis. Lancet Glob Health. 2016;4(2):e98–e108. [DOI] [PubMed]
- 8.Lee AC, Kozuki N, Cousens S, Stevens GA, Blencowe H, Silveira MF, et al. Estimates of burden and consequences of infants born small for gestational age in low and middle income countries with INTERGROWTH-21(st) standard: analysis of CHERG datasets. Bmj. 2017;358:j3677. doi: 10.1136/bmj.j3677. [DOI] [PMC free article] [PubMed] [Google Scholar]
- 9.Kramer MS. Determinants of low birth weight: methodological assessment and meta-analysis. Bull World Health Organ. 1987;65(5):663–737. [PMC free article] [PubMed] [Google Scholar]
- 10.Jin WY, Lin SL, Hou RL, Chen XY, Han T, Jin Y, et al. Associations between maternal lipid profile and pregnancy complications and perinatal outcomes: a population-based study from China. BMC Pregnancy Childbirth. 2016;16:60. doi: 10.1186/s12884-016-0852-9. [DOI] [PMC free article] [PubMed] [Google Scholar]
- 11.Wild R, Weedin EA, Wilson D. Dyslipidemia in pregnancy. Cardiol Clin. 2015;33(2):209–215. doi: 10.1016/j.ccl.2015.01.002. [DOI] [PubMed] [Google Scholar]
- 12.Mudd LM, Holzman CB, Evans RW. Maternal mid-pregnancy lipids and birthweight. Acta Obstet Gynecol Scand. 2015;94(8):852–860. doi: 10.1111/aogs.12665. [DOI] [PMC free article] [PubMed] [Google Scholar]
- 13.Grimes SB, Wild R. Effect of pregnancy on lipid metabolism and lipoprotein levels. 2018. [PubMed] [Google Scholar]
- 14.Edison RJ, Berg K, Remaley A, Kelley R, Rotimi C, Stevenson RE, et al. Adverse birth outcome among mothers with low serum cholesterol. Pediatrics. 2007;120(4):723–733. doi: 10.1542/peds.2006-1939. [DOI] [PubMed] [Google Scholar]
- 15.Okunade KSOA. Predictive significance of low maternal serum cholesterol concentrations in early pregnancy on low birth weight in term neonates. Afr J Med Health Sci. 2017;16:94–98. doi: 10.4103/ajmhs.ajmhs_50_17. [DOI] [Google Scholar]
- 16.Kulkarni SR, Kumaran K, Rao SR, Chougule SD, Deokar TM, Bhalerao AJ, et al. Maternal lipids are as important as glucose for fetal growth: findings from the Pune maternal nutrition study. Diabetes Care. 2013;36(9):2706–2713. doi: 10.2337/dc12-2445. [DOI] [PMC free article] [PubMed] [Google Scholar]
- 17.Geraghty AA, Alberdi G, O'Sullivan EJ, O'Brien EC, Crosbie B, Twomey PJ, et al. Maternal and fetal blood lipid concentrations during pregnancy differ by maternal body mass index: findings from the ROLO study. BMC Pregnancy Childbirth. 2017;17(1):360. doi: 10.1186/s12884-017-1543-x. [DOI] [PMC free article] [PubMed] [Google Scholar]
- 18.Vrijkotte TG, Algera SJ, Brouwer IA, van Eijsden M, Twickler MB. Maternal triglyceride levels during early pregnancy are associated with birth weight and postnatal growth. J Pediatr. 2011;159(5):736–42.e1. doi: 10.1016/j.jpeds.2011.05.001. [DOI] [PubMed] [Google Scholar]
- 19.Di Cianni G, Miccoli R, Volpe L, Lencioni C, Ghio A, Giovannitti MG, et al. Maternal triglyceride levels and newborn weight in pregnant women with normal glucose tolerance. Diabet Med. 2005;22(1):21–25. doi: 10.1111/j.1464-5491.2004.01336.x. [DOI] [PubMed] [Google Scholar]
- 20.Kramer MS, Kahn SR, Dahhou M, Otvos J, Genest J, Platt RW, et al. Maternal lipids and small for gestational age birth at term. J Pediatr. 2013;163(4):983–988. doi: 10.1016/j.jpeds.2013.05.014. [DOI] [PubMed] [Google Scholar]
- 21.Moore SE, Fulford AJ, Darboe MK, Jobarteh ML, Jarjou LM, Prentice AM. A randomized trial to investigate the effects of pre-natal and infant nutritional supplementation on infant immune development in rural Gambia: the ENID trial: early nutrition and immune development. BMC Pregnancy Childbirth. 2012;12:107. doi: 10.1186/1471-2393-12-107. [DOI] [PMC free article] [PubMed] [Google Scholar]
- 22.Hennig BJ, Unger SA, Dondeh BL, Hassan J, Hawkesworth S, Jarjou L, et al. Cohort profile: the kiang west longitudinal population study (KWLPS)-a platform for integrated research and health care provision in rural Gambia. Int J Epidemiol. 2017;46(2):e13. doi: 10.1093/ije/dyv206. [DOI] [PMC free article] [PubMed] [Google Scholar]
- 23.UNICEF, Organization WH, University UN . Composition of a multi-micronutrient supplement to be used in pilot programmes among pregnant women in developing countries: report of a United Nations Children's Fund (UNICEF), World Health Organization (WHO) and United Nations University workshop. 1999. [Google Scholar]
- 24.Villar J, Altman DG, Purwar M, Noble JA, Knight HE, Ruyan P, et al. The objectives, design and implementation of the INTERGROWTH-21st Project. Bjog. 2013;120(Suppl 2):9–26. doi: 10.1111/1471-0528.12047. [DOI] [PubMed] [Google Scholar]
- 25.Johnson W, Elmrayed SA, Sosseh F, Prentice AM, Moore SE. Preconceptional and gestational weight trajectories and risk of delivering a small-for-gestational-age baby in rural Gambia12. Am J Clin Nutr. 2017;105(6):1474–1482. doi: 10.3945/ajcn.116.144196. [DOI] [PMC free article] [PubMed] [Google Scholar]
- 26.Pusukuru R, Shenoi AS, Kyada PK, Ghodke B, Mehta V, Bhuta K, et al. Evaluation of lipid profile in second and third trimester of pregnancy. J Clin Diagn Res. 2016;10(3):QC12–QC16. doi: 10.7860/JCDR/2016/17598.7436. [DOI] [PMC free article] [PubMed] [Google Scholar]
- 27.Oaks BM, Stewart CP, Laugero KD, et al. Maternal plasma cholesterol and duration of pregnancy: a prospective cohort study in Ghana. Matern Child Nutr. 2017;13. https://www.ncbi.nlm.nih.gov/pubmed/28025862. [DOI] [PMC free article] [PubMed]
- 28.Wiznitzer A, Mayer A, Novack V, Sheiner E, Gilutz H, Malhotra A, et al. Association of lipid levels during gestation with preeclampsia and gestational diabetes mellitus: a population-based study. Am J Obstet Gynecol. 2009;201(5):482.e1–482.e8. doi: 10.1016/j.ajog.2009.05.032. [DOI] [PMC free article] [PubMed] [Google Scholar]
- 29.Stefulj J, Panzenboeck U, Becker T, Hirschmugl B, Schweinzer C, Lang I, et al. Human endothelial cells of the placental barrier efficiently deliver cholesterol to the fetal circulation via ABCA1 and ABCG1. Circ Res. 2009;104(5):600–608. doi: 10.1161/CIRCRESAHA.108.185066. [DOI] [PubMed] [Google Scholar]
- 30.Rebholz SL, Burke KT, Yang Q, Tso P, Woollett LA. Dietary fat impacts fetal growth and metabolism: uptake of chylomicron remnant core lipids by the placenta. Am J Physiol Endocrinol Metab. 2011;301(2):E416–E425. doi: 10.1152/ajpendo.00619.2010. [DOI] [PMC free article] [PubMed] [Google Scholar]
- 31.Baardman ME, Erwich JJ, Berger RM, Hofstra RM, Kerstjens-Frederikse WS, Lutjohann D, et al. The origin of fetal sterols in second-trimester amniotic fluid: endogenous synthesis or maternal-fetal transport? Am J Obstet Gynecol. 2012;207(3):202.e19–202.e25. doi: 10.1016/j.ajog.2012.06.003. [DOI] [PubMed] [Google Scholar]
- 32.Siddiqi HK, Kiss D, Rader D. HDL-cholesterol and cardiovascular disease: rethinking our approach. Curr Opin Cardiol. 2015;30(5):536–542. doi: 10.1097/HCO.0000000000000211. [DOI] [PubMed] [Google Scholar]
- 33.Barter P, Gotto AM, LaRosa JC, Maroni J, Szarek M, Grundy SM, et al. HDL cholesterol, very low levels of LDL cholesterol, and cardiovascular events. N Engl J Med. 2007;357(13):1301–1310. doi: 10.1056/NEJMoa064278. [DOI] [PubMed] [Google Scholar]
- 34.Curb JD, Abbott RD, Rodriguez BL, Masaki K, Chen R, Sharp DS, et al. A prospective study of HDL-C and cholesteryl ester transfer protein gene mutations and the risk of coronary heart disease in the elderly. J Lipid Res. 2004;45(5):948–953. doi: 10.1194/jlr.M300520-JLR200. [DOI] [PubMed] [Google Scholar]
- 35.Boghossian NS, Mendola P, Liu A, Robledo C, Yeung EH. Maternal serum markers of lipid metabolism in relation to neonatal anthropometry. J Perinatol. 2017;37(6):629–635. doi: 10.1038/jp.2017.22. [DOI] [PMC free article] [PubMed] [Google Scholar]
- 36.Mudd LM, Holzman CB, Catov JM, Senagore PK, Evans RW. Maternal lipids at mid-pregnancy and the risk of preterm delivery. Acta Obstet Gynecol Scand. 2012;91(6):726–735. doi: 10.1111/j.1600-0412.2012.01391.x. [DOI] [PMC free article] [PubMed] [Google Scholar]
- 37.Barrett HL, Dekker Nitert M, McIntyre HD, Callaway LK. Maternal lipids in pre-eclampsia: innocent bystander or culprit? Hypertens Pregnancy. 2014;33(4):508–523. doi: 10.3109/10641955.2014.946614. [DOI] [PubMed] [Google Scholar]
- 38.Rebholz SL, Melchior JT, Davidson WS, Jones HN, Welge JA, Prentice AM, et al. Studies in genetically modified mice implicate maternal HDL as a mediator of fetal growth. FASEB J. 2018;32(2):717–727. doi: 10.1096/fj.201700528R. [DOI] [PMC free article] [PubMed] [Google Scholar]
- 39.Sulaiman WN, Caslake MJ, Delles C, Karlsson H, Mulder MT, Graham D, et al. Does high-density lipoprotein protect vascular function in healthy pregnancy? Clin Sci (Lond) 2016;130(7):491–497. doi: 10.1042/CS20150475. [DOI] [PubMed] [Google Scholar]
- 40.Ramsay JE, Ferrell WR, Crawford L, Wallace AM, Greer IA, Sattar N. Divergent metabolic and vascular phenotypes in pre-eclampsia and intrauterine growth restriction: relevance of adiposity. J Hypertens. 2004;22(11):2177–2183. doi: 10.1097/00004872-200411000-00021. [DOI] [PubMed] [Google Scholar]
- 41.Wyne KL, Woollett LA. Transport of maternal LDL and HDL to the fetal membranes and placenta of the Golden Syrian hamster is mediated by receptor-dependent and receptor-independent processes. J Lipid Res. 1998;39(3):518–530. [PubMed] [Google Scholar]
- 42.Schmid KE, Davidson WS, Myatt L, Woollett LA. Transport of cholesterol across a BeWo cell monolayer: implications for net transport of sterol from maternal to fetal circulation. J Lipid Res. 2003;44(10):1909–1918. doi: 10.1194/jlr.M300126-JLR200. [DOI] [PubMed] [Google Scholar]
- 43.Misra VK, Trudeau S, Perni U. Maternal serum lipids during pregnancy and infant birth weight: the influence of prepregnancy BMI. Obesity (Silver Spring) 2011;19(7):1476–1481. doi: 10.1038/oby.2011.43. [DOI] [PubMed] [Google Scholar]
- 44.Enquobahrie DA, Williams MA, Butler CL, Frederick IO, Miller RS, Luthy DA. Maternal plasma lipid concentrations in early pregnancy and risk of preeclampsia. Am J Hypertens. 2004;17(7):574–581. doi: 10.1016/j.amjhyper.2004.03.666. [DOI] [PubMed] [Google Scholar]
- 45.Dempsey JC, Williams MA, Leisenring WM, Shy K, Luthy DA. Maternal birth weight in relation to plasma lipid concentrations in early pregnancy. Am J Obstet Gynecol. 2004;190(5):1359–1368. doi: 10.1016/j.ajog.2003.10.710. [DOI] [PubMed] [Google Scholar]
- 46.Laughon SK, McLain AC, Sundaram R, Catov JM, Louis GMB. Maternal lipid change in relation to length of gestation: a prospective cohort study with preconception enrollment of women. Gynecol Obstet Investig. 2014;77(1):6–13. doi: 10.1159/000355100. [DOI] [PMC free article] [PubMed] [Google Scholar]
- 47.Schaefer-Graf UM, Graf K, Kulbacka I, Kjos SL, Dudenhausen J, Vetter K, et al. Maternal lipids as strong determinants of fetal environment and growth in pregnancies with gestational diabetes mellitus. Diabetes Care. 2008;31(9):1858–1863. doi: 10.2337/dc08-0039. [DOI] [PMC free article] [PubMed] [Google Scholar]
- 48.Herrera E. Lipid metabolism in pregnancy and its consequences in the fetus and newborn. Endocrine. 2002;19(1):43–55. doi: 10.1385/ENDO:19:1:43. [DOI] [PubMed] [Google Scholar]
- 49.Sauder M, Lee S, Schulze K, Christian P, Wu L, Khatry S, West K. Inflammation throughout pregnancy and fetal growth restriction in rural Nepal. Epidemiol Infect. 2019;147:E258. 10.1017/S0950268819001493. [DOI] [PMC free article] [PubMed]
- 50.Wilkinson AL, Pedersen SH, Urassa M, Michael D, Andreasen A, Todd J, et al. Maternal systemic or cord blood inflammation is associated with birth anthropometry in a Tanzanian prospective cohort. Trop Med Int Health. 2017;22(1):52–62. doi: 10.1111/tmi.12799. [DOI] [PubMed] [Google Scholar]
- 51.Hasan SMT, Khan MA, Ahmed T. Inadequate maternal weight gain in the third trimester increases the risk of intrauterine growth restriction in rural Bangladesh. PloS one. 2019;14(2):e0212116-e. doi: 10.1371/journal.pone.0212116. [DOI] [PMC free article] [PubMed] [Google Scholar]
- 52.Verkauskiene R, Beltrand J, Claris O, Chevenne D, Deghmoun S, Dorgeret S, et al. Impact of fetal growth restriction on body composition and hormonal status at birth in infants of small and appropriate weight for gestational age. Eur J Endocrinol. 2007;157(5):605–612. doi: 10.1530/EJE-07-0286. [DOI] [PubMed] [Google Scholar]
- 53.Larsson A, Ottosson P, Törnqvist C, Olhager E. Body composition and growth in full-term small for gestational age and large for gestational age Swedish infants assessed with air displacement plethysmography at birth and at 3-4 months of age. PLoS One. 2019;14(5):e0207978. 10.1371/journal.pone.0207978. [DOI] [PMC free article] [PubMed]
- 54.Das JK, Hoodbhoy Z, Salam RA, et al. Lipid-based nutrient supplements for maternal, birth, and infant developmental outcomes. Cochrane Database Syst Rev. 2018;8(8):CD012610. 10.1002/14651858.CD012610.pub2. [DOI] [PMC free article] [PubMed]
Associated Data
This section collects any data citations, data availability statements, or supplementary materials included in this article.
Supplementary Materials
Additional file 1 Table A1. Nutritional composition of the allocated daily intake of pregnancy supplements. Table A2. Relative risk of LBW (95%CI) associated with maternal total, HDL and LDL cholesterol and triglycerides levels at enrolment, 20 and 30 weeks gestation. Table A3. Relative risk of SGA (95%CI) associated with maternal total, HDL and LDL cholesterol and triglycerides levels at enrolment, 20 and 30 weeks’ gestation. Table A4. Associations between maternal nutritional supplement groups and maternal total, HDL and LDL cholesterol and triglycerides levels at enrolment, 20 and 30 weeks gestation. Table A5. Beta coefficients (95% confidence intervals) of associations between maternal total, HDL, LDL cholesterol and triglycerides levels and BMI at enrolment, 20 and 30 weeks gestation. Table A6. Associations between maternal nutritional supplement groups and maternal BMI at enrolment, 20 and 30 weeks gestation. Table A7. Relative risk of LBW and SGA by maternal nutritional supplementation groups. Table A8. Beta coefficient of the associations between maternal nutritional supplement groups during pregnancy and birth weight.
Data Availability Statement
The dataset analyzed in this paper is available from the corresponding author on reasonable request, and with appropriate additional ethical approvals, where necessary.