

Abstract
Background
Gut microbiota play an important role in human health. However, the application of gut microbiome in regular clinical practice is limited by interindividual variations and complexity of test results.
Hypothesis
It is possible to address interindividual variation by using large data-based exploratory-pattern analysis.
Methods
The current study was conducted using a large data set (n = 173,221) of nonselective incoming patients’ test results from a stool test. The data set included assays for the detection of 24 selected commensal microorganisms and multiple biomarkers in feces. Patients were grouped based on their levels of inflammation biomarkers such as calprotectin, eosinophil protein X, and IgA. Group mean values of biomarkers and commensal microbes were used in an exploratory-pattern analysis for association from which an index score for intestinal inflammation-associated dysbiosis (IAD) was developed. The IAD score was evaluated in one questionnaire-based study (n = 7263) and one prospective case series study (n = 122) with patients of inflammatory bowel disease (IBD), irritable bowel syndrome (IBS), and celiac disease.
Results
We identified a microbial profile strongly associated with fecal inflammation biomarkers. Developed on the pattern of the microbial profile, the IAD score demonstrated a strong association with fecal inflammation biomarkers and was significantly different between patients with IBD and those with IBS or celiac disease.
Conclusion
Using real-world data, we have developed a method to predict gut dysbiosis associated with different GI disease conditions. It may help clinicians simplify the process of interpreting gut microbial status and provide gut health assessment and treatment evaluation.
Electronic supplementary material
The online version of this article (10.1007/s10620-019-05828-8) contains supplementary material, which is available to authorized users.
Keywords: Microbiome, Fecal, Clinical laboratory test, Inflammation, Dysbiosis, Pattern analysis
Introduction
The human gastrointestinal tract has a complex microbial ecosystem, and its composition is believed to be highly associated with human health [1]. Recent research has established the critical role of the gut microbiome in both healthy and disease states due to its involvement in human metabolism, nutrition, physiology, and immune function [2–4]. Because gut microbiota imbalance (dysbiosis) has been linked with many abnormal conditions such as inflammatory bowel disease (IBD) [5], irritable bowel syndrome (IBS) [6], obesity and diabetes [7], and cardiovascular diseases [8], regulating the gut microbiome has become a potential therapeutic approach for many chronic diseases that place a significant burden on our healthcare system [9–12]. However, there are some clear obstacles to clinical implementation of this new concept. For example, significant investment will be needed to identify proper and efficacious microbiome-based treatments for different disease states [13–15]. In addition, identifying the appropriate patients for treatment through reliable and accurate clinical diagnosis is a considerable challenge.
The clinical utility of gut microbiome information is dependent on several factors including the clinical and analytical validity of the assay, interpretation of the result by clinicians, and translation of the test results into effective treatment options. Culture-independent methods have provided high-throughput approaches for microbial identification and profiling in a systematic manner [16]. Meanwhile, factors such as the volume of data generated from microbiome tests, large interindividual variation, and lack of disease (condition)-specific profiles have limited the application of microbiome tests in regular clinical practice.
Here we report a fecal microbiome test that uses a selected group of commensal microbiota and the development of a microbiome profile index score associated with intestinal inflammation. The purpose of the current approach is to reduce the complexity and variation in clinical microbiome testing. It is based on two hypotheses. First, changes in the levels of a small subset of clinically relevant microbes can reliably identify patients with dysbiosis. Second, interindividual variation can be addressed using a large data set of unbiased patient test results.
Methods
Fecal Sample Collection
Approximately 10 g of fresh stool samples (selecting from different parts of the stool) were collected and mixed thoroughly with or without preservative (i.e., C&S medium and 10% formalin). All specimens were shipped within 24 h of collection at room temperature. Upon arrival, all specimens were stored at 4 °C for up to 7 days before testing.
Microbial Genomic DNA Extraction
DNA was extracted from fecal samples using a glass-bead-based extraction kit (E.Z.N.A. Stool DNA Kit, Omega Bio-tek Inc., Norcross, GA, USA) following the manufacturer’s “Stool DNA Protocol for Pathogen Detection” protocol. DNA quantity and quality were assessed by spectrophotometry using the NanoDrop® (Roche, USA). The extraction method is based on the principle of the use of silica-coated magnetic beads. In brief, during a first lysis step, remaining cellular structures release their DNA content in the solution. The DNA will bind to (or be washed off) the silica-coated surface of the magnetic beads under defined conditions of temperature, pH, and ionic strength of buffers. The KingFisher Flex Analyzer (Thermo Fisher Scientific, Waltham, MA, USA) is used for this process. Extraction intra-precision and sample stability were confirmed using proper assessments.
Semiquantitative PCR
Twenty-four commensal microbes were selected based on their disease association in a literature review (data not shown). End-point PCR was performed using SYBR® chemistry (Invitrogen Life Technologies, Thermo Fisher Scientific, Waltham, MA) and thermal cycler (Thermo Fisher Scientific) to quantify bacterial 16S rRNA genes of a unique genus and/or species of the bacteria domain. Assay conditions were optimized via the following steps.
Primer Design
The 16S rRNA gene sequence (full or partial) for each microorganism was obtained from the NCBI GenBank database. Sequences of related organisms were aligned using ClustalW2 (http://www.clustal.org) to identify conserved regions (for genus probes) and regions of uniqueness (for species probes). Forward (5′–3′) and reverse (3′–5′) primers were chosen based on the level of specificity required of the individual assays. The designed primer sequences were verified using NCBI BLAST analysis (http://blast.ncbi.nlm.nih.gov/Blast.cgi), once with the microorganism specified and once with the microorganism excluded from the search. For proprietary reasons, primer sequences are not shown here.
Cycling Conditions
PCR cycling conditions were tested by comparing varying volumes of genomic DNA (gDNA), Taq polymerase, and number of cycles over increasing dilutions in duplicate. The optimal conditions (details not shown for proprietary reasons) for each assay were determined based on the most differentiated and reportable SYBR green results.
To test the linearity of each assay, pure genomic material for each microorganism (purchased from ATCC, Manassas, VA, USA; DSMz, Braunschweig, Germany; and University of Georgia, Athens, GA, USA) was used as positive control. Increasing amounts of microorganism-specific gDNA was added to independent PCR reactions to determine the dose-dependent range of concentrations relative to the SYBR signal using a PCR assay condition unique to the microorganism. This concentration curve was then used to establish the equivalent gDNA concentration for the microorganism in a matrix-matched genomic calibrator (standard), which was used for semiquantitative analysis of the level of the microorganism-specific gene encoding the 16S rRNA in both samples and controls for the respective assay. Sample dilution, assay precision and recovery, and recovery assessments were performed using proper methods.
Measurement of Fecal Biomarkers
Fecal calprotectin was determined using the PhiCal Test (Calpro AS, Lysaker, Norway), a quantitative enzyme-linked immunosorbent assay (ELISA). The methodology for fecal eosinophil protein X (EPX) measurement was described previously [17]. Quantitative determination of EPX was conducted using the EDN ELISA kit (Medical and Biological Laboratories Co., Ltd., Woburn, MA, USA). Fecal immunoglobulin A (IgA) was extracted using a previously published protocol [18] and quantified using an immunoturbidimetric IgA assay (Abbott Laboratories, Abbott Park, IL, USA). Fecal short-chain fatty acids (SCFA, i.e., butyrate, propionate, and acetate) and putrefactive SCFA (i.e., isobutyrate, valerate, and isovalerate) assays were laboratory-developed tests (LDTs) using gas chromatography–mass spectrometry (GC-MS). In brief, formalin-preserved fecal samples were filtered, extracted, and then diluted in sulfuric acid before being processed by centrifugation and filtration. The extracts were analyzed by GC-MS, and data was collected and integrated using Agilent GC-MS ChemStation software (Agilent, Santa Clara, CA, USA). Raw values were quantitated using a five-point calibration curve. The assay for fecal β-glucuronidase was an LDT enzymatic endpoint assay. In brief, samples were incubated with phenolphthalein glucuronic acid for 5 min. An alkaline buffer was added to the mixture, and the absorbance was read at 548 nm.
Data Source for Stool Test Results
A HIPAA (Health Insurance Portability and Accountability Act)-compliant database of Genova Diagnostics was created from Genova’s incoming patients’ test results without personal sensitive information. From that database, all test results of a test panel called GI Effects® (n = 187,144) were extracted from September 2014 to January 2018. After removing results that had significant missing data points (usually due to the quality of submitted stool samples), a de-identified data set (n = 173,221) of stool tests was created. GI Effects® is a stool test panel containing stool biomarkers including calprotectin, EPX, IgA, pancreatic elastase 1 (PE-1), butyrate, acetate, propionate, putrefactive SCFA, long-chain fatty acids (LCFA), triglycerides, phospholipids, cholesterol, β-glucuronidase, 24 commensal microbes (measured by PCR, see Table s1 for the list), and other microscopic and ELISA assays of bacteria, parasites, and yeast.
Disease Cohorts
Study 1 (Genova Diagnostics)
Cohorts in Study 1 were selected from Genova’s database. With stool specimen submission, patients were asked to complete a paper survey with consent. Among patients with complete test results, 13,106 returned the paper survey. Six hundred and seven patients and 425 patients reported having inflammatory bowel disease (IBD) and celiac disease, respectively. Patients with both IBD and celiac disease were not included in the study. Ultimately, 6231 patients met questionnaire-based Rome IV diagnostic criteria (Gastrointestinal Disorders https://theromefoundation.org/rome-iv/) for irritable bowel syndrome (IBS) without a history of IBD and celiac disease. There was a higher proportion of female patients in all three cohorts (73%, 81%, and 84% for IBD, IBS, and celiac disease, respectively). The average ages for the IBD, IBS, and celiac groups were 46 ± 0.73, 45 ± 0.22, and 47 ± 0.86 years.
Study 2 (UCLA Medical Center)
This prospective case series study was originally conducted to compare two fecal calprotectin test kits. All participants were recruited from the University of California, Los Angeles (UCLA) Medical Center and had completed one GI Effects® test. After the exclusion of individuals with incomplete microbiome data or overlapping diagnoses (i.e., IBD and celiac disease), 161 participants were included in this study: healthy control, n = 26; Crohn’s disease (CD), n = 35; celiac disease, n = 25; IBS, n = 36; ulcerative colitis (UC), n = 39. Percentages of female participants were 54% (healthy), 46% (CD), 80% (celiac), 64% (IBS), and 51% (UC). The average ages were 36 ± 3 (healthy), 38 ± 3 (CD), 33 ± 3 (celiac), 40 ± 3 (IBS), and 38 ± 3 years (UC). All patients were between 5 and 65 years of age and had confirmation of their diagnosis according to published clinical guidelines and standards of care using gold-standard diagnostics (e.g., endoscopy).
All procedures were approved by ethics committees: Advarra for Study 1 (www.advarra.com; IRB# Pro00030304) and UCLA for Study 2 (IRB# 16-001499). Informed consent was obtained from all individual participants included in the studies.
Data Analysis
Cluster Analysis
Cluster analysis using the k-means method [19] was employed in order to classify patients into groups or clusters based on the similarity of their fecal bacterial results. Within a cluster, patients are homogenous with respect to the variables used in the analysis; between clusters, patients are heterogeneous. Differences between clusters were assessed using one-way analysis of variance (ANOVA) tests with cluster as the between-person factor.
Factor Analysis
In order to examine the underlying pattern of covariation in the fecal bacteria variables, factor analysis was used. Specifically, principal components extraction with a varimax rotation was conducted to determine the underlying components (i.e., factors) in the data. Note that while cluster analysis essentially finds groups of patients that are similar on a set of variables and assigns them to a cluster, factor analysis finds groups of variables based on correlations and assigns those variables to a factor.
Exploratory-Pattern Analysis
To address the issue of interindividual variation in microbiome data analysis, we developed an approach that we call exploratory-pattern analysis, which comprises three steps: (1) grouping patients based on their fecal level of a biomarker (i.e., calprotectin, EPX, or IgA); (2) comparing the average levels of individual microbes in groups established in step 1; and (3) plotting the group mean values of each microbe and determining the pattern of association with the group mean values of the biomarker. The strength and significance of the associations were evaluated by Pearson’s correlation coefficient and Spearman rank-order correlation coefficient using PRISM 7 (GraphPad Software, Inc., San Diego, CA, USA). Based on the exploratory-pattern of all 24 microbes in patient groups with different levels of calprotectin, a proprietary algorithm was developed to calculate an index referred to as the Inflammation-Associated Dysbiosis (IAD) score. Exploratory-pattern analysis was also performed to study the association between individual fecal biomarkers or between the IAD score and biomarkers.
Other Statistical Analysis
Differences among commensal abundance groups or among different disease cohorts were determined using one-way ANOVA with post hoc Turkey’s multiple comparison test. Based on the data distribution, all results were log-transformed before performing statistical analysis using PRISM 7 (GraphPad Software, Inc., San Diego, CA, USA).
Results
Creation of Data Sets of Patients’ Stool Test Results
A de-identified database without sensitive personal information was created from Genova Diagnostics’ test results. From the de-identified database, we extracted all results (n = 187,144) of a test panel called GI Effects® from September 2014 to January 2018. A list of biomarkers tested in GI Effects® is shown in Table s1. After removing results that were missing a significant fraction of the data (usually due to the quality of submitted stool samples), we created a data set of 173,221 patients.
Abundance of Commensal Microbes Is Negatively Associated with Intestinal Inflammation (Immune Response) Biomarkers
A cluster analysis was performed using patients with complete PCR results for 24 commensal microbes in order to determine whether patients could be clustered into different groups based on their profiles of commensal microbes. The analysis demonstrated significant variations among the patients, and only two clusters were identified. Cluster 1 (n = 32,587) was significantly higher on all fecal microbial variables than Cluster 2 (n = 140,633). Further ANOVA analyses were performed to identify significant differences between clusters for tested fecal biomarkers. Cluster 1 was associated with high levels of fecal PE-1, LCFAs, triglycerides, phospholipids, total SCFAs (sum of butyrate, acetate, and propionate), percentage of butyrate in total SCFAs, and total putrefactive SCFAs (sum of valerate, isobutyrate, and isovalerate) (Table 1). Cluster 2 was associated with high fecal calprotectin, EPX, IgA, cholesterol, and percentage of acetate and propionate in total SCFAs (Table 1). Based on the cluster analysis effect sizes for the ANOVA tests, we generated an arbitrary number called commensal abundance to reflect the total concentration of the 24 microbes. As shown in Figure s1, commensal abundance is highly correlated with the sum of the concentrations of all 24 commensal microbes. Since fecal calprotectin, EPX, and IgA were fecal biomarkers for intestinal inflammation (immune response), we hypothesized that commensal abundance was negatively associated with intestinal inflammation. To further confirm the hypothesis, we regrouped all patients based on quartiles of commensal abundance. All three stool biomarkers showed a strong negative association with commensal abundance, and patients in the first quartile (lowest) group had the highest levels of fecal calprotectin, EPX, and IgA (Fig. 1a–c).
Table 1.
Cluster analysis identifies tow patient groups with high or low commensal abundance
| Cluster 1 (high commensal abundance) | Cluster 2 (low commensal abundance) |
|---|---|
| Long-chain fatty acids | Calprotectin |
| Triglycerides | EPX |
| Phospholipids | IgA |
| Total SCFAs (butyrate + acetate + propionate) | Cholesterol |
| % Butyrate of total SCFAs | % Acetate of total SCFAs |
| Pancreatic elastase 1 | % Propionate of total SCFAs |
| Putrefactive SCFAs (valerate + isobutyrate + isovalerate) |
Each group is associated with increased levels of certain fecal biomarkers
Fig. 1.
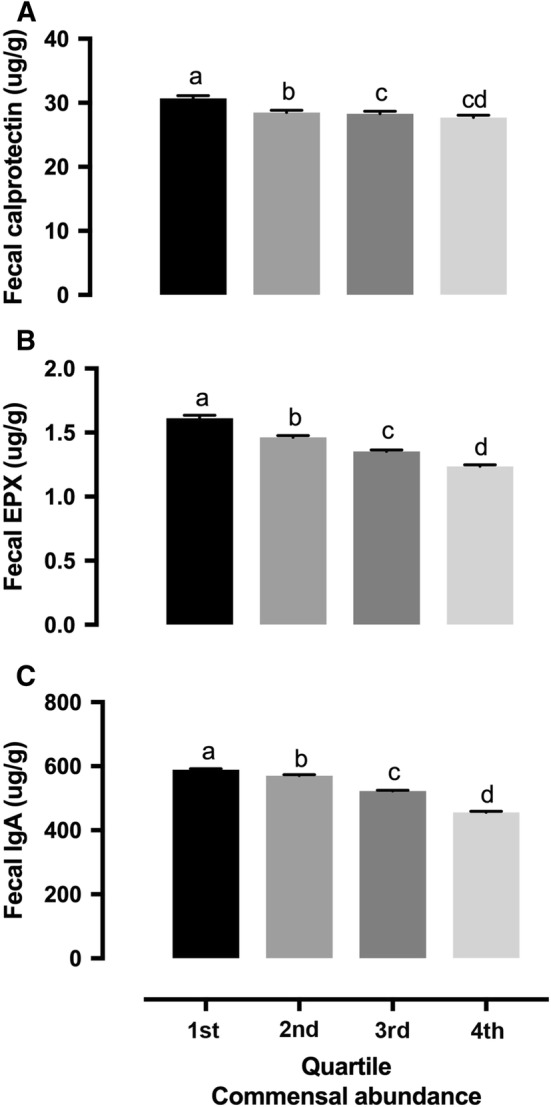
Commensal abundance was negatively associated with fecal inflammation biomarkers. Commensal abundance was calculated as the sum of concentrations of all 24 microbes. Quartiles were calculated with all 173,221 patients. Groups with no overlapping letters are statistically different (P < 0.05)
Fecal Inflammation (Immune Response) Biomarkers Are Associated with Unique Profiles of Commensal Microbes
Because fecal calprotectin, EPX, and IgA represent the activation of different cells in immune response pathways, we evaluated the relationships among those biomarkers. We divided patients into different groups based on their fecal calprotectin (Fig. 2a), IgA (Figure s2A), or EPX (Figure s2D) levels and cross-evaluated the relationships between these biomarkers. The results showed strong positive associations among fecal calprotectin, IgA, and EPX (Fig. 2b, c, Figure s2B, C and E, F). Also, factor analysis showed strong positive associations among calprotectin, EPX, and IgA (data not shown). The relationship between calprotectin and EPX was stronger than that with IgA (data not shown). To further understand potential relationships between fecal inflammation/immune response biomarkers and the microbiome, we assessed the concentrations of 24 commensal microbes in patient groups with different fecal levels of calprotectin, EPX, and IgA. As shown in Fig. 3, different microbes demonstrated different relationships with fecal calprotectin. Some were positively associated (i.e., Veillonella spp., Escherichia coli, and Fusobacterium spp.) or negatively associated (i.e., Barnesiella spp., Odoribacter spp., Anaerotruncus colihominis, Coprococcus eutactus, Pseudoflavonifractor spp., Roseburia spp., Ruminococcus spp., Methanobrevibacter smithii, and Akkermansia muciniphila) with fecal calprotectin. Some showed a bell-shaped distribution (i.e., Lactobacillus spp.) or no clear dose-dependent changes (i.e., Bacteroides-Prevotella group). Statistical analysis of the association between microbiome and calprotectin (group means) is shown in Table s2. The same analyses were performed in patient groups with different levels of fecal IgA (Figure s3, Table s6) and EPX (Figure s4, Table s7). Overall, those three fecal inflammation (immune response) biomarkers showed similar patterns in their relationships with the majority of the 24 commensal microbes. For example, all three biomarkers were negatively associated with Barnesiella spp., Odoribacter spp., Butyrivibrio crossotus, C. eutactus, Faecalibacterium prausnitzii, Pseudoflavonifractor spp., Roseburia spp., Oxalobacter formigenes, M. smithii, and A. muciniphila. All three biomarkers were positively associated with Veillonella spp. and Fusobacterium spp. Some of the commensal microbes had unique patterns with changes in fecal calprotectin, EPX, or IgA.
Fig. 2.
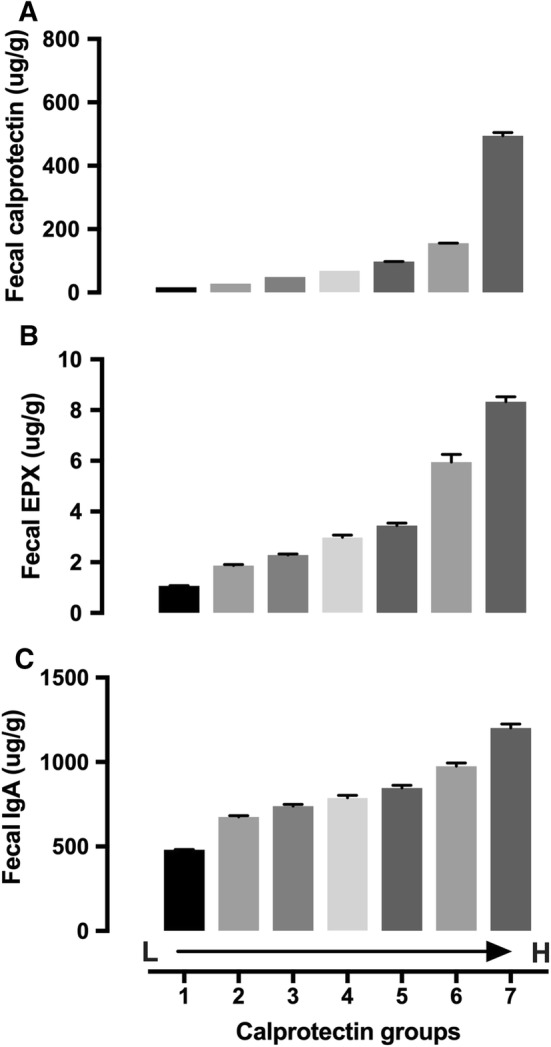
Fecal EPX (b) and IgA (c) in patient groups with different fecal calprotectin levels (a). Calprotectin groups (μg/g): 1. ≤ 20 (n = 141,913); 2. 21–40 (n = 15,418); 3. 41–60 (n = 5603); 4. 61–80 (n = 2889); 5. 81–120 (n = 2889); 6. 121–200 (n = 2431); 7. > 200 (n = 2191). Data presented as mean ± SE. Statistical information is provided in Table s2
Fig. 3.

Levels of commensal microbes in groups with different levels of fecal calprotectin. Calprotectin groups (μg/g): 1. ≤ 20 (n = 141,913); 2. 21–40 (n = 15,418); 3. 41–60 (n = 5603); 4. 61–80 (n = 2889); 5. 81–120 (n = 2889); 6. 121–200 (n = 2431); 7. > 200 (n = 2191). Data presented as mean ± SE. Statistical information is provided in Table s3
Creation and Validation of Inflammation-Associated Dysbiosis (IAD) Score
Because the patterns we determined in the analysis were based on a large patient data set, it would be difficult to apply the patterns at the individual patient level or in small clinical studies. For that purpose, we created a pattern-based algorithm (proprietary property of Genova Diagnostics), which calculated an index called the IAD score. The algorithm used only information regarding microbiome patterns (Fig. 3) and fecal beta-glucuronidase (Figure s5) associated with fecal calprotectin. None of the inflammation (immune response) biomarkers were used in the algorithm. When grouping patients according to their IAD scores, the group mean IAD score was negatively associated with commensal abundance (Fig. 4a and Table s4) and positively associated with fecal calprotectin, EPX, and IgA (Fig. 4b–d and Table s4).
Fig. 4.
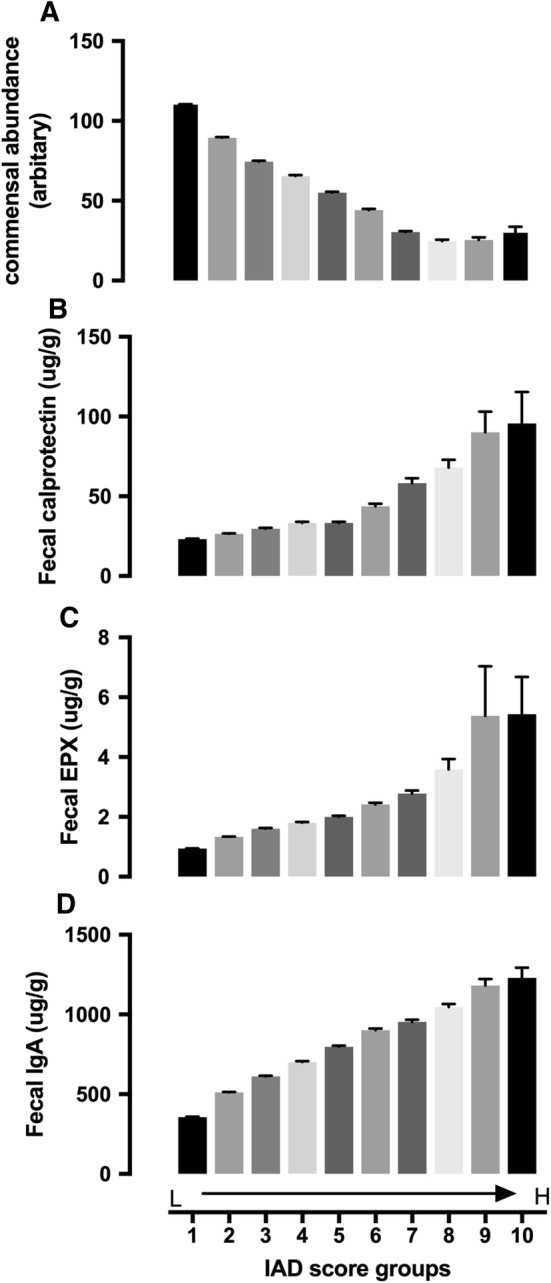
Commensal abundance (a), fecal calprotectin (b), EPX (c), and IgA (d) in patient groups with different IAD scores. IAD score groups: 1. 0–9.9 (n = 59,483); 2. 10–19.9 (n = 53,337); 3. 20–29.9 (n = 23,757); 4. 30–39.9 (n = 15,427); 5. 40–49.9 (n = 9977); 6. 50–59.9 (n = 5639); 7. 60–69.9 (n = 3499); 8. 70–79.9 (n = 1624); 9. 80–89.9 (n = 365); 10. > 90 (n = 113). Data presented as mean ± SE. Statistical information is provided in Table s4
While the IAD score was negatively associated with the total fecal putrefactive SCFA concentration (sum of valerate, isovalerate, and isobutyrate) (Fig. 5b, Table s5), the total concentration of SCFA produced from carbohydrates (sum of butyrate, acetate, and propionate) showed a slight bell shape, with similar levels in groups with high or low IAD scores (Fig. 5a, Table s5). Further analysis demonstrated that the composition of SCFA differed among groups with different IAD scores. The IAD score was negatively associated with the fecal butyrate (Fig. 5c, d, Table s5) but positively associated with fecal acetate (Fig. 6e, f, Table s5), both in concentration and percentage (of the sum of butyrate, acetate, and propionate). Fecal propionate showed a bell-shaped distribution (Fig. 6g, h, Table s5).
Fig. 5.

Fecal total SCFA (sum of butyrate, acetate, and propionate) (a), putrefactive SCFA (sum of valerate, isovalerate, and isobutyrate) (b), individual fecal SCFA (butyrate, acetate, and propionate) concentration (c, e, g) and percentage (d, f, h) in patient groups with different IAD scores. IAD score groups: 1. 0–9.9 (n = 59,483); 2. 10–19.9 (n = 53,337); 3. 20–29.9 (n = 23,757); 4. 30–39.9 (n = 15,427); 5. 40–49.9 (n = 9977); 6. 50–59.9 (n = 5639); 7. 60–69.9 (n = 3499); 8. 70–79.9 (n = 1624); 9. 80–89.9 (n = 365); 10. > 90 (n = 113). Data presented as mean ± SE. Statistical information is provided in Table s5
Fig. 6.

Fecal calprotectin, EPX, IgA, commensal abundance, and IAD score in two studies with disease cohorts. a–e From a questionnaire-based study: IBS, n = 6231; IBD, n = 607; celiac disease, n = 425. f–j From a clinical trial conducted in UCLA: healthy control, n = 26; Crohn’s disease, n = 35; celiac disease, n = 25; IBS, n = 36; ulcerative colitis (UC), n = 39. Groups with no overlapping letters are statistically different (P < 0.05). Data presented as mean ± SE
We hypothesized that the IAD score, independent of individual microbiome, would provide an indication of a dysbiosis status associated with intestinal inflammation. To test that hypothesis, we calculated IAD scores using test results from two clinical studies. The first study included questionnaire-based cohorts of symptomatic patients with IBS, IBD, and celiac disease from Genova’s database. The IBD cohort had significantly higher fecal calprotectin, EPX, IgA, and IAD score than the IBS and celiac disease cohorts, while commensal abundance could not differentiate IBD from the celiac cohort (Fig. 6a–e). The second study was conducted independently at the UCLA Medical Center with clinically validated patients. Similar to the first study, patients with IBD (Crohn’s disease and ulcerative colitis) had significantly higher levels of fecal calprotectin, EPX, and IAD score compared with healthy, celiac, and IBS cohorts (Fig. 6f, g, j). Commensal abundance was not able to differentiate IBD from other cohorts (Fig. 6i). Meanwhile, analysis with individual commensal microbes did not show significant differences among different disease cohorts (data not shown).
Discussion
A definition of dysbiosis commonly contains three key components: changes/imbalance in a person’s natural microflora, comparison to the community found in healthy individuals, and potential contribution to a range of conditions of ill health [20]. Although this definition is applicable to most clinical studies with a control group, it can be challenging in real-world clinical settings where data from healthy individuals is not readily available. Reference ranges provided by clinical laboratories can be useful but are limited by large variations due to differences in how the “healthy cohort” is defined. The exploratory-pattern analysis used in the current study allowed us to avoid potential selection biases associated with a healthy control group and/or predefined inclusion criteria. Instead, all patients in the database were included and analyzed based on certain conditions of ill health defined by one or a group of biomarkers. The current analysis also allowed for an examination of the changes in a continuous manner, which is more biologically relevant than using defined cutoffs from reference ranges.
The approach used in the current study to determine associations between fecal microbiome profiles and stool biomarkers is unique. The majority of previously published studies examined differences between disease and non-disease cohorts. Our data included all patients regardless of disease conditions, which also posed a challenge when making direct comparisons with published studies. Because fecal calprotectin was used to differentiate IBD from other gastrointestinal diseases [21], we anticipated that our results for individual microbiota should be similar to published data with IBD patients. Supporting that hypothesis, most of our results were consistent with published studies with IBD patients. For example, reduced abundance of F. prausnitzii was reported in many studies [22–29]. We found that F. prausnitzii was negatively associated with fecal calprotectin, EPX, and IgA in the current study. The Roseburia genus [23, 30–33] or specific species (e.g., Roseburia intestinalis and Roseburia hominis) [34, 35] were significantly decreased in patients with IBD. In our analysis, Roseburia spp. was negatively associated with fecal calprotectin, EPX, and IgA.
The current data was also aligned with previous reports of decreased Ruminococcus spp. in IBD patients [33]. Methanobrevibacter smithii, an archaea methanogen, was significantly decreased in IBD patients [36]. Another study showed no change in fecal M. smithii but increased fecal Methanosphaera stadtmanae in IBD patients [37]. Our data suggested a strong negative association between fecal M. smithii and fecal inflammation biomarkers (calprotectin, EPX, and IgA). In fact, a small increase in EPX and IgA was associated with a significant decrease in fecal M. smithii. A. muciniphila, which was decreased in patients with early onset of Crohn’s disease [22], was negatively associated with all three fecal inflammation biomarkers in the current analysis. Additionally, fecal levels of several commensal bacteria, including Veillonella spp., E. coli, and Fusobacterium spp., were positively associated with inflammation biomarkers in the current study. All of those bacteria were considered as invasive [38–40], and high levels were reported previously in IBD patients [23, 28, 31, 33, 41–45]. Changes in Prevotella spp. were reported previously, with conflicting results in multiple studies [26, 28, 31, 46]. Our results showed a relatively weak negative association between Prevotella spp. and fecal calprotectin, EPX, and IgA. Lactobacillus and Bifidobacterium have generally been regarded as beneficial commensal bacteria and used as probiotics. Although patients with active IBD (compared with patients with remission) had lower abundance of Bifidobacterium [47, 48], and low levels of Lactobacillus were discovered in Crohn’s disease [33], increased Bifidobacterium was reported in ulcerative colitis [49]. Overall, our data suggested that high levels of fecal Lactobacillus spp., Bifidobacterium spp., or Bifidobacterium longum were associated with intestinal inflammation.
While the results from the current study were similar to the findings of previous studies, there were some issues in applying the findings at the individual patient level in clinic. First, although our findings with real-world big data exploratory-pattern analysis aligned with multiple clinical studies, the results from those published studies varied substantially. Second, even in patients with high levels of fecal calprotectin, there were significant variations at the individual microbiota level (data not shown). Most patients with high fecal calprotectin did not completely align with the microbiome profile described above. In addition, changes in the same individual microbiota can be associated with various conditions. For example, A. muciniphila represents 1–3% of the gut microbiota [50, 51]. A decrease in this species has been demonstrated in feces and/or biopsies in several disorders including autism, obesity, type 2 diabetes, appendicitis, and IBD [52, 53]. F. prausnitzii is another example with multiple clinical associations. Representing between 2 and 15% of intestinal bacterial communities, F. prausnitzii is reduced in prevalence and abundance in disorders such as celiac disease [54], obesity and type 2 diabetes [55–57], appendicitis [58], chronic diarrhea [59], irritable bowel syndrome (IBS) of alternating type [60], colorectal cancer [61], and particularly IBD [29, 62–65]. Our unpublished data agrees with much of the current literature published on the changes seen in individual microbial populations between different disease groups and compared to a healthy cohort.
To address these issues, we generated an IAD score using an algorithm based on the exploratory-pattern analysis. The algorithm only considered the patterns of 24 commensal microbes and the level of fecal β-glucuronidase (a bacterial enzyme) in patient groups with different fecal calprotectin levels. As such, it was a pure fecal microbiome profile. Although none of the host fecal inflammation biomarkers (i.e., calprotectin, EPX, and IgA) were included in the algorithm, they all had a strong positive association with the IAD score. Patient groups with high IAD scores had high levels of fecal calprotectin, EPX, and IgA. Groups with high levels of fecal inflammation biomarkers also had high IAD scores. Similar to the three inflammation biomarkers, the IAD score was negatively associated with fecal commensal abundance. It was also negatively associated with fecal butyrate and propionate (both concentration and percentage) but positively associated with fecal acetate (both concentration and percentage), with no association with total SCFA (a sum of butyrate, propionate, and acetate). In addition, the IAD score was negatively associated with fecal putrefactive SCFAs. Decreased fecal SCFAs, particularly butyrate, was reported previously in IBD patients [66, 67]. Collectively, the IAD score might provide us an opportunity to assess dysbiosis related to intestinal inflammation based on an integrated picture but not on individual microbiota.
To further evaluate the clinical utility of the IAD score, it was calculated in two separate clinical studies. In the first study, IBD, IBS, and celiac disease cohorts were identified from Genova’s database using questionnaire-based criteria. The IBD cohort not only had high levels of fecal calprotectin, EPX, and IgA; it also showed a significantly higher IAD score than the other groups. In the second study, patients with Crohn’s disease, ulcerative colitis, IBS, and celiac disease, as well as a healthy control group, were recruited at the UCLA Medical Center based on clinical diagnostic criteria. Stool biomarkers and microbiome were analyzed at Genova Diagnostics. The Crohn’s disease and ulcerative colitis cohorts had significantly higher fecal calprotectin, EPX, and IAD scores than the healthy control, IBS, and celiac disease cohorts, while there was no statistical difference in commensal abundance among all groups. There was no difference among the healthy control, IBS, and celiac disease cohorts in fecal inflammation biomarkers or IAD score. Interestingly, when those cohorts were compared at the individual commensal microbiota level, there was no statistical difference identified in that study (data not shown). Overall, the results from both clinical studies strongly indicate that the IAD score is more effective than individual microbiota in predicting a dysbiosis status associated with severe intestinal inflammation, such as that found in IBD patients.
Gut dysbiosis has been associated with many different diseases [68]. In research studies, various microbiome measurements are used to demonstrate dysbiosis at community levels, such as taxonomic diversity and Firmicutes/Bacteroides (F/B) ratio. Compared with healthy controls, patients with many disease states (e.g., IBD, obesity, diabetes, autoimmune diseases, celiac disease, cardiovascular diseases) have demonstrated decreased taxonomic diversity of the fecal microbiome [69–71]. The F/B ratio is increased in some disease states (i.e., obesity) and decreased in other patient populations (i.e., diabetes) [72, 73]. Although those measurements have been confirmed in multiple studies, they are also mostly nonspecific. Our current approach and derived scores can be more specific for unique dysbiosis profiles associated with certain disease conditions. In fact, the IAD score is high only in IBD cohorts, and not in groups of IBS or celiac disease, or in other diseases such as diabetes, autoimmunity, hypertension, and mood disorder (data not shown). In addition, using the same approach and different biomarkers, we have identified another dysbiosis condition that is opposite the IAD score (unpublished data). Meanwhile, the current study has some limitations. For example, only 24 commensal microbes were measured. Although our data demonstrates that we can differentiate disease cohorts from healthy controls even with a small group of microbes (data not shown), we believe that increasing the number of targets will potentially improve the strength of the current test. While the principle can be applied in other studies, the algorithm generated from the current analysis is test-platform-specific. Other clinical laboratories will need to develop test-specific algorithms to account for technical variations between different groups. It is important to note that the purpose of the IAD score (and other scores generated from the method) is the identification of underlying root causes rather than diagnosis of the disease. Dysbiosis is not the only cause of intestinal inflammation.
In summary, we have developed a new approach to identify unique dysbiosis profiles using a large patient data set and exploratory-pattern analysis. This method can detect signals that may not be obvious due to big variations of the microbiome data. Derived algorithm-base scores provide opportunities to report disease/condition-specific microbiome profiles in clinical microbiome testing.
Electronic supplementary material
Below is the link to the electronic supplementary material.
Acknowledgments
All authors would like to thank Dr. Daniel Hommes for supervising the study conducted in the UCLA Medical Center, Mark Peucker for his support in data management, Dr. Jason Allaire for his support in data analysis, and Dr. Michael Chapman and Ashley Passmore for their careful reviews and corrections of the manuscript.
Funding
All studies in this manuscript were financially supported by Genova Diagnostics, Inc. LC, RD, and AB are employees of Genova Diagnostics.
Compliance with Ethical Standards
Ethical approval
All procedures performed in studies involving human participants were in accordance with the ethical standards of the institutional and/or national research committee and with the 1964 Helsinki declaration and its later amendments or comparable ethical standards.
Conflict of interest
LC, RD, and APB are employees of Genova Diagnostics. CR claims no conflicts of interest.
Footnotes
Publisher's Note
Springer Nature remains neutral with regard to jurisdictional claims in published maps and institutional affiliations.
Contributor Information
Lihong Chen, Email: lchen@gdx.net.
Courtney Reynolds, Email: courtney.reynolds@gmail.com.
Robert David, Email: RDavid@gdx.net.
Amy Peace Brewer, Email: APeaceBrewer@gdx.net.
References
- 1.Falk PG, Hooper LV, Midtvedt T, Gordon JI. Creating and maintaining the gastrointestinal ecosystem: what we know and need to know from gnotobiology. Microbiol Mol Biol Rev. 1998;62:1157–1170. doi: 10.1128/mmbr.62.4.1157-1170.1998. [DOI] [PMC free article] [PubMed] [Google Scholar]
- 2.Gilbert JA, Quinn RA, Debelius J, Xu ZZ, Morton J, Garg N, et al. Microbiome-wide association studies link dynamic microbial consortia to disease. Nature. 2016;535:94–103. doi: 10.1038/nature18850. [DOI] [PubMed] [Google Scholar]
- 3.Honda K, Littman DR. The microbiota in adaptive immune homeostasis and disease. Nature. 2016;535:75–84. doi: 10.1038/nature18848. [DOI] [PubMed] [Google Scholar]
- 4.Tremaroli V, Backhed F. Functional interactions between the gut microbiota and host metabolism. Nature. 2012;489:242–249. doi: 10.1038/nature11552. [DOI] [PubMed] [Google Scholar]
- 5.Casas V, Maloy S. Role of bacteriophage-encoded exotoxins in the evolution of bacterial pathogens. Future Microbiol. 2011;6:1461–1473. doi: 10.2217/fmb.11.124. [DOI] [PubMed] [Google Scholar]
- 6.Simren M, Barbara G, Flint HJ, Spiegel BM, Spiller RC, Vanner S, et al. Intestinal microbiota in functional bowel disorders: a Rome foundation report. Gut. 2013;62:159–176. doi: 10.1136/gutjnl-2012-302167. [DOI] [PMC free article] [PubMed] [Google Scholar]
- 7.Karlsson FH, Tremaroli V, Nookaew I, Bergstrom G, Behre CJ, Fagerberg B, et al. Gut metagenome in European women with normal, impaired and diabetic glucose control. Nature. 2013;498:99–103. doi: 10.1038/nature12198. [DOI] [PubMed] [Google Scholar]
- 8.Griffin JL, Wang X, Stanley E. Does our gut microbiome predict cardiovascular risk? A review of the evidence from metabolomics. Circ Cardiovasc Genet. 2015;8:187–191. doi: 10.1161/CIRCGENETICS.114.000219. [DOI] [PMC free article] [PubMed] [Google Scholar]
- 9.Kennedy PJ, Cryan JF, Dinan TG, Clarke G. Irritable bowel syndrome: a microbiome-gut-brain axis disorder? World J Gastroenterol. 2014;20:14105–14125. doi: 10.3748/wjg.v20.i39.14105. [DOI] [PMC free article] [PubMed] [Google Scholar]
- 10.Cani PD, Delzenne NM. The gut microbiome as therapeutic target. Pharmacol Ther. 2011;130:202–212. doi: 10.1016/j.pharmthera.2011.01.012. [DOI] [PubMed] [Google Scholar]
- 11.Winek K, Dirnagl U, Meisel A. The gut microbiome as therapeutic target in central nervous system diseases: implications for stroke. Neurotherapeutics. 2016;13:762–774. doi: 10.1007/s13311-016-0475-x. [DOI] [PMC free article] [PubMed] [Google Scholar]
- 12.Matsuoka K, Kanai T. The gut microbiota and inflammatory bowel disease. Semin Immunopathol. 2015;37:47–55. doi: 10.1007/s00281-014-0454-4. [DOI] [PMC free article] [PubMed] [Google Scholar]
- 13.Aragon G, Graham DB, Borum M, Doman DB. Probiotic therapy for irritable bowel syndrome. Gastroenterol Hepatol (NY) 2010;6:39–44. [PMC free article] [PubMed] [Google Scholar]
- 14.Mekkes MC, Weenen TC, Brummer RJ, Claassen E. The development of probiotic treatment in obesity: a review. Benef Microbes. 2014;5:19–28. doi: 10.3920/BM2012.0069. [DOI] [PubMed] [Google Scholar]
- 15.Martinez RC, Bedani R, Saad SM. Scientific evidence for health effects attributed to the consumption of probiotics and prebiotics: an update for current perspectives and future challenges. Br J Nutr. 2015;114:1993–2015. doi: 10.1017/S0007114515003864. [DOI] [PubMed] [Google Scholar]
- 16.Ursell LK, Metcalf JL, Parfrey LW, Knight R. Defining the human microbiome. Nutr Rev. 2012;70:S38–S44. doi: 10.1111/j.1753-4887.2012.00493.x. [DOI] [PMC free article] [PubMed] [Google Scholar]
- 17.Peterson CG, Eklund E, Taha Y, Raab Y, Carlson M. A new method for the quantification of neutrophil and eosinophil cationic proteins in feces: establishment of normal levels and clinical application in patients with inflammatory bowel disease. Am J Gastroenterol. 2002;97:1755–1762. doi: 10.1111/j.1572-0241.2002.05837.x. [DOI] [PubMed] [Google Scholar]
- 18.Peters IR, Calvert EL, Hall EJ, Day MJ. Measurement of immunoglobulin concentrations in the feces of healthy dogs. Clin Diagn Lab Immunol. 2004;11:841–848. doi: 10.1128/CDLI.11.5.841-848.2004. [DOI] [PMC free article] [PubMed] [Google Scholar]
- 19.Fraley C, Raftery AE. How many clusters? Which clustering method? Answers via model-based cluster analysis. Comput J. 1998;41:578–588. [Google Scholar]
- 20.Schippa S, Conte MP. Dysbiotic events in gut microbiota: impact on human health. Nutrients. 2014;6:5786–5805. doi: 10.3390/nu6125786. [DOI] [PMC free article] [PubMed] [Google Scholar]
- 21.Walsham NE, Sherwood RA. Fecal calprotectin in inflammatory bowel disease. Clin Exp Gastroenterol. 2016;9:21–29. doi: 10.2147/CEG.S51902. [DOI] [PMC free article] [PubMed] [Google Scholar]
- 22.Lopez-Siles M, Enrich-Capo N, Aldeguer X, Sabat-Mir M, Duncan SH, Garcia-Gil LJ, et al. Alterations in the abundance and co-occurrence of Akkermansia muciniphila and Faecalibacterium prausnitzii in the colonic mucosa of inflammatory bowel disease subjects. Front Cell Infect Microbiol. 2018;8:281. doi: 10.3389/fcimb.2018.00281. [DOI] [PMC free article] [PubMed] [Google Scholar]
- 23.Altomare A, Putignani L, Del Chierico F, et al. Gut mucosal-associated microbiota better discloses Inflammatory Bowel Disease differential patterns than faecal microbiota. Dig Liver Dis. 2019;5:648–656. doi: 10.1016/j.dld.2018.11.021. [DOI] [PubMed] [Google Scholar]
- 24.Fujimoto T, Imaeda H, Takahashi K, Kasumi E, Bamba S, Fujiyama Y, et al. Decreased abundance of Faecalibacterium prausnitzii in the gut microbiota of Crohn’s disease. J Gastroenterol Hepatol. 2013;28:613–619. doi: 10.1111/jgh.12073. [DOI] [PubMed] [Google Scholar]
- 25.Takahashi K, Nishida A, Fujimoto T, Fujii M, Shioya M, Imaeda H, et al. Reduced abundance of butyrate-producing bacteria species in the fecal microbial community in Crohn’s disease. Digestion. 2016;93:59–65. doi: 10.1159/000441768. [DOI] [PubMed] [Google Scholar]
- 26.Heidarian F, Alebouyeh M, Shahrokh S, Balaii H, Zali MR. Altered fecal bacterial composition correlates with disease activity in inflammatory bowel disease and the extent of IL8 induction. Curr Res Transl Med. 2019;67:41–50. doi: 10.1016/j.retram.2019.01.002. [DOI] [PubMed] [Google Scholar]
- 27.Tilg H, Moschen AR. Microbiota and diabetes: an evolving relationship. Gut. 2014;63:1513–1521. doi: 10.1136/gutjnl-2014-306928. [DOI] [PubMed] [Google Scholar]
- 28.Olbjorn C, Cvancarova Smastuen M, Thiis-Evensen E, Nakstad B, Vatn MH, Jahnsen J, et al. Fecal microbiota profiles in treatment-naïve pediatric inflammatory bowel disease: associations with disease phenotype, treatment, and outcome. Clin Exp Gastroenterol. 2019;12:37–49. doi: 10.2147/CEG.S186235. [DOI] [PMC free article] [PubMed] [Google Scholar]
- 29.Machiels K, Joossens M, Sabino J, De Preter V, Arijs I, Eeckhaut V, et al. A decrease of the butyrate-producing species Roseburia hominis and Faecalibacterium prausnitzii defines dysbiosis in patients with ulcerative colitis. Gut. 2014;63:1275–1283. doi: 10.1136/gutjnl-2013-304833. [DOI] [PubMed] [Google Scholar]
- 30.Imhann F, Vich Vila A, Bonder MJ, Fu J, Gevers D, Visschedijk MC, et al. Interplay of host genetics and gut microbiota underlying the onset and clinical presentation of inflammatory bowel disease. Gut. 2018;67:108–119. doi: 10.1136/gutjnl-2016-312135. [DOI] [PMC free article] [PubMed] [Google Scholar]
- 31.Nishino K, Nishida A, Inoue R, Kawada Y, Ohno M, Sakai S, et al. Analysis of endoscopic brush samples identified mucosa-associated dysbiosis in inflammatory bowel disease. J Gastroenterol. 2018;53:95–106. doi: 10.1007/s00535-017-1384-4. [DOI] [PubMed] [Google Scholar]
- 32.Chen L, Wang W, Zhou R, Ng SC, Li J, Huang M, et al. Characteristics of fecal and mucosa-associated microbiota in Chinese patients with inflammatory bowel disease. Medicine (Baltimore) 2014;93:e51. doi: 10.1097/MD.0000000000000051. [DOI] [PMC free article] [PubMed] [Google Scholar]
- 33.El Mouzan MI, Winter HS, Assiri AA, Korolev KS, Al Sarkhy AA, Dowd SE, et al. Microbiota profile in new-onset pediatric Crohn’s disease: data from a non-Western population. Gut Pathog. 2018;10:49. doi: 10.1186/s13099-018-0276-3. [DOI] [PMC free article] [PubMed] [Google Scholar]
- 34.Zhu C, Song K, Shen Z, Quan Y, Tan B, Luo W, et al. Roseburia intestinalis inhibits interleukin17 excretion and promotes regulatory T cells differentiation in colitis. Mol Med Rep. 2018;17:7567–7574. doi: 10.3892/mmr.2018.8833. [DOI] [PMC free article] [PubMed] [Google Scholar]
- 35.Tilg H, Danese S. Roseburia hominis: a novel guilty player in ulcerative colitis pathogenesis? Gut. 2014;63:1204–1205. doi: 10.1136/gutjnl-2013-305799. [DOI] [PubMed] [Google Scholar]
- 36.Ghavami SB, Rostami E, Sephay AA, Shahrokh S, Balaii H, Aghdaei HA, et al. Alterations of the human gut Methanobrevibacter smithii as a biomarker for inflammatory bowel diseases. Microb Pathog. 2018;117:285–289. doi: 10.1016/j.micpath.2018.01.029. [DOI] [PubMed] [Google Scholar]
- 37.Blais Lecours P, Marsolais D, Cormier Y, Berberi M, Hache C, Bourdages R, et al. Increased prevalence of Methanosphaera stadtmanae in inflammatory bowel diseases. PLoS ONE. 2014;9:e87734. doi: 10.1371/journal.pone.0087734. [DOI] [PMC free article] [PubMed] [Google Scholar]
- 38.Mirsepasi-Lauridsen HC, Vallance BA, Krogfelt KA, Petersen AM. Escherichia coli pathobionts associated with inflammatory bowel disease. Clin Microbiol Rev. 2019;32:e00060-18. doi: 10.1128/CMR.00060-18. [DOI] [PMC free article] [PubMed] [Google Scholar]
- 39.Zhang SL, Wang SN, Miao CY. Influence of microbiota on intestinal immune system in ulcerative colitis and its intervention. Front Immunol. 2017;8:1674. doi: 10.3389/fimmu.2017.01674. [DOI] [PMC free article] [PubMed] [Google Scholar]
- 40.Kasai C, Sugimoto K, Moritani I, Tanaka J, Oya Y, Inoue H, et al. Comparison of human gut microbiota in control subjects and patients with colorectal carcinoma in adenoma: terminal restriction fragment length polymorphism and next-generation sequencing analyses. Oncol Rep. 2016;35:325–333. doi: 10.3892/or.2015.4398. [DOI] [PubMed] [Google Scholar]
- 41.Kotlowski R, Bernstein CN, Sepehri S, Krause DO. High prevalence of Escherichia coli belonging to the B2+D phylogenetic group in inflammatory bowel disease. Gut. 2007;56:669–675. doi: 10.1136/gut.2006.099796. [DOI] [PMC free article] [PubMed] [Google Scholar]
- 42.Martin HM, Campbell BJ, Hart CA, Mpofu C, Nayar M, Singh R, et al. Enhanced Escherichia coli adherence and invasion in Crohn’s disease and colon cancer. Gastroenterology. 2004;127:80–93. doi: 10.1053/j.gastro.2004.03.054. [DOI] [PubMed] [Google Scholar]
- 43.Martinez C, Antolin M, Santos J, Torrejon A, Casellas F, Borruel N, et al. Unstable composition of the fecal microbiota in ulcerative colitis during clinical remission. Am J Gastroenterol. 2008;103:643–648. doi: 10.1111/j.1572-0241.2007.01592.x. [DOI] [PubMed] [Google Scholar]
- 44.Grigoras CA, Ziakas PD, Jayamani E, Mylonakis E. ATG16L1 and IL23R variants and genetic susceptibility to Crohn’s disease: mode of inheritance based on meta-analysis of genetic association studies. Inflamm Bowel Dis. 2015;21:768–776. doi: 10.1097/MIB.0000000000000305. [DOI] [PubMed] [Google Scholar]
- 45.Neut C, Bulois P, Desreumaux P, Membre JM, Lederman E, Gambiez L, et al. Changes in the bacterial flora of the neoterminal ileum after ileocolonic resection for Crohn’s disease. Am J Gastroenterol. 2002;97:939–946. doi: 10.1111/j.1572-0241.2002.05613.x. [DOI] [PubMed] [Google Scholar]
- 46.Hirano A, Umeno J, Okamoto Y, Shibata H, Ogura Y, Moriyama T, et al. Comparison of the microbial community structure between inflamed and non-inflamed sites in patients with ulcerative colitis. J Gastroenterol Hepatol. 2018;33:1590–1597. doi: 10.1111/jgh.14129. [DOI] [PubMed] [Google Scholar]
- 47.Prosberg M, Bendtsen F, Vind I, Petersen AM, Gluud LL. The association between the gut microbiota and the inflammatory bowel disease activity: a systematic review and meta-analysis. Scand J Gastroenterol. 2016;51:1407–1415. doi: 10.1080/00365521.2016.1216587. [DOI] [PubMed] [Google Scholar]
- 48.Matsuoka K, Uemura Y, Kanai T, Kunisaki R, Suzuki Y, Yokoyama K, et al. Efficacy of Bifidobacterium breve fermented milk in maintaining remission of ulcerative colitis. Dig Dis Sci. 2018;63:1910–1919. doi: 10.1007/s10620-018-4946-2. [DOI] [PMC free article] [PubMed] [Google Scholar]
- 49.Forbes JD, Chen CY, Knox NC, Marrie RA, El-Gabalawy H, de Kievit T, et al. A comparative study of the gut microbiota in immune-mediated inflammatory diseases-does a common dysbiosis exist? Microbiome. 2018;6:221. doi: 10.1186/s40168-018-0603-4. [DOI] [PMC free article] [PubMed] [Google Scholar]
- 50.Derrien M, Vaughan EE, Plugge CM, de Vos WM. Akkermansia muciniphila gen. nov., sp. nov., a human intestinal mucin-degrading bacterium. Int J Syst Evol Microbiol. 2004;54:1469–1476. doi: 10.1099/ijs.0.02873-0. [DOI] [PubMed] [Google Scholar]
- 51.Derrien M, Collado MC, Ben-Amor K, Salminen S, de Vos WM. The mucin degrader Akkermansia muciniphila is an abundant resident of the human intestinal tract. Appl Environ Microbiol. 2008;74:1646–1648. doi: 10.1128/AEM.01226-07. [DOI] [PMC free article] [PubMed] [Google Scholar]
- 52.Belzer C, de Vos WM. Microbes inside–from diversity to function: the case of Akkermansia. ISME J. 2012;6:1449–1458. doi: 10.1038/ismej.2012.6. [DOI] [PMC free article] [PubMed] [Google Scholar]
- 53.Everard A, Belzer C, Geurts L, Ouwerkerk JP, Druart C, Bindels LB, et al. Cross-talk between Akkermansia muciniphila and intestinal epithelium controls diet-induced obesity. Proc Natl Acad Sci USA. 2013;110:9066–9071. doi: 10.1073/pnas.1219451110. [DOI] [PMC free article] [PubMed] [Google Scholar]
- 54.De Palma G, Nadal I, Medina M, Donat E, Ribes-Koninckx C, Calabuig M, et al. Intestinal dysbiosis and reduced immunoglobulin-coated bacteria associated with coeliac disease in children. BMC Microbiol. 2010;10:63. doi: 10.1186/1471-2180-10-63. [DOI] [PMC free article] [PubMed] [Google Scholar]
- 55.Furet JP, Kong LC, Tap J, Poitou C, Basdevant A, Bouillot JL, et al. Differential adaptation of human gut microbiota to bariatric surgery-induced weight loss: links with metabolic and low-grade inflammation markers. Diabetes. 2010;59:3049–3057. doi: 10.2337/db10-0253. [DOI] [PMC free article] [PubMed] [Google Scholar]
- 56.Balamurugan R, George G, Kabeerdoss J, Hepsiba J, Chandragunasekaran AM, Ramakrishna BS. Quantitative differences in intestinal Faecalibacterium prausnitzii in obese Indian children. Br J Nutr. 2010;103:335–338. doi: 10.1017/S0007114509992182. [DOI] [PubMed] [Google Scholar]
- 57.Graessler J, Qin Y, Zhong H, Zhang J, Licinio J, Wong ML, et al. Metagenomic sequencing of the human gut microbiome before and after bariatric surgery in obese patients with type 2 diabetes: correlation with inflammatory and metabolic parameters. Pharmacogn J. 2013;13:514–522. doi: 10.1038/tpj.2012.43. [DOI] [PubMed] [Google Scholar]
- 58.Swidsinski A, Dorffel Y, Loening-Baucke V, Theissig F, Ruckert JC, Ismail M, et al. Acute appendicitis is characterised by local invasion with Fusobacterium nucleatum/necrophorum. Gut. 2011;60:34–40. doi: 10.1136/gut.2009.191320. [DOI] [PubMed] [Google Scholar]
- 59.Dorffel Y, Swidsinski A, Loening-Baucke V, Wiedenmann B, Pavel M. Common biostructure of the colonic microbiota in neuroendocrine tumors and Crohn’s disease and the effect of therapy. Inflamm Bowel Dis. 2012;18:1663–1671. doi: 10.1002/ibd.21923. [DOI] [PubMed] [Google Scholar]
- 60.Pittayanon R, Lau JT, Yuan Y, et al. Gut microbiota in patients with irritable Bowel syndrome-a systematic review. Gastroenterology. 2019;157:97–108. doi: 10.1053/j.gastro.2019.03.049. [DOI] [PubMed] [Google Scholar]
- 61.Hibberd AA, Lyra A, Ouwehand AC, Rolny P, Lindegren H, Cedgard L, et al. Intestinal microbiota is altered in patients with colon cancer and modified by probiotic intervention. BMJ Open Gastroenterol. 2017;4:e000145. doi: 10.1136/bmjgast-2017-000145. [DOI] [PMC free article] [PubMed] [Google Scholar]
- 62.Sokol H, Seksik P, Furet JP, Firmesse O, Nion-Larmurier I, Beaugerie L, et al. Low counts of Faecalibacterium prausnitzii in colitis microbiota. Inflamm Bowel Dis. 2009;15:1183–1189. doi: 10.1002/ibd.20903. [DOI] [PubMed] [Google Scholar]
- 63.Swidsinski A, Loening-Baucke V, Vaneechoutte M, Doerffel Y. Active Crohn’s disease and ulcerative colitis can be specifically diagnosed and monitored based on the biostructure of the fecal flora. Inflamm Bowel Dis. 2008;14:147–161. doi: 10.1002/ibd.20330. [DOI] [PubMed] [Google Scholar]
- 64.Willing BP, Dicksved J, Halfvarson J, Andersson AF, Lucio M, Zheng Z, et al. A pyrosequencing study in twins shows that gastrointestinal microbial profiles vary with inflammatory bowel disease phenotypes. Gastroenterology. 2010;139:1844–1854. doi: 10.1053/j.gastro.2010.08.049. [DOI] [PubMed] [Google Scholar]
- 65.Lopez-Siles M, Martinez-Medina M, Busquets D, Sabat-Mir M, Duncan SH, Flint HJ, et al. Mucosa-associated Faecalibacterium prausnitzii and Escherichia coli co-abundance can distinguish irritable bowel syndrome and inflammatory bowel disease phenotypes. Int J Med Microbiol. 2014;304:464–475. doi: 10.1016/j.ijmm.2014.02.009. [DOI] [PubMed] [Google Scholar]
- 66.Goncalves P, Araujo JR, Di Santo JP. A cross-talk between microbiota-derived short-chain fatty acids and the host mucosal immune system regulates intestinal homeostasis and inflammatory Bowel disease. Inflamm Bowel Dis. 2018;24:558–572. doi: 10.1093/ibd/izx029. [DOI] [PubMed] [Google Scholar]
- 67.Nagao-Kitamoto H, Kamada N. Host-microbial cross-talk in Inflammatory Bowel Disease. Immune Netw. 2017;17:1–12. doi: 10.4110/in.2017.17.1.1. [DOI] [PMC free article] [PubMed] [Google Scholar]
- 68.Cani PD. Human gut microbiome: hopes, threats and promises. Gut. 2018;67:1716–1725. doi: 10.1136/gutjnl-2018-316723. [DOI] [PMC free article] [PubMed] [Google Scholar]
- 69.Zimmermann P, Messina N, Mohn WW, Finlay BB, Curtis N. Association between the intestinal microbiota and allergic sensitization, eczema, and asthma: a systematic review. J Allergy Clin Immunol. 2019;143:467–485. doi: 10.1016/j.jaci.2018.09.025. [DOI] [PubMed] [Google Scholar]
- 70.Bu J, Wang Z. Cross-talk between gut microbiota and heart via the routes of metabolite and immunity. Gastroenterol Res Pract. 2018;2018:6458094. doi: 10.1155/2018/6458094. [DOI] [PMC free article] [PubMed] [Google Scholar]
- 71.Lozupone CA, Stombaugh JI, Gordon JI, Jansson JK, Knight R. Diversity, stability and resilience of the human gut microbiota. Nature. 2012;489:220–230. doi: 10.1038/nature11550. [DOI] [PMC free article] [PubMed] [Google Scholar]
- 72.Lopez-Cepero AA, Palacios C. Association of the intestinal microbiota and obesity. P R Health Sci J. 2015;34:60–64. [PubMed] [Google Scholar]
- 73.Kasselman LJ, Vernice NA, DeLeon J, Reiss AB. The gut microbiome and elevated cardiovascular risk in obesity and autoimmunity. Atherosclerosis. 2018;271:203–213. doi: 10.1016/j.atherosclerosis.2018.02.036. [DOI] [PubMed] [Google Scholar]
Associated Data
This section collects any data citations, data availability statements, or supplementary materials included in this article.