

Abstract
Background and Purpose
Naringenin, a flavonoid compound with strong anti‐inflammatory activity, attenuated non‐alcoholic fatty liver disease (NAFLD) induced by a methionine‐choline deficient (MCD) diet in mice. However, the mechanisms underlying this suppression of inflammation and NAFLD remain unknown.
Experimental Approach
WT and NLRP3−/− mice were fed with MCD diet for 7 days to induce NAFLD and were given naringenin by gavage at the same time. in vitro experiments used HepG2 cells, primary hepatocytes, and Kupffer cells (KCs) stimulated by LPS or LPS plus oleic acid (OA).
Key Results
Treating WT mice with naringenin (100 mg·kg−1·day−1) attenuated hepatic lipid accumulation and inflammation in the livers of mice given the MCD diet. NLRP3−/− mice showed less hepatic lipid accumulation than WT mice, but naringenin did not ameliorate hepatic lipid accumulation further in NLRP3−/− mice. Treating the HepG2 cells with naringenin or NLRP3 inhibitor MCC950 reduced lipid accumulation. Naringenin inhibited activation of the NLRP3/NF‐κB pathway stimulated by OA together with LPS. In KCs isolated from WT mice, naringenin inhibited NLRP3 expression. Naringenin also inhibited lipid deposition, NLRP3 and IL‐1β expression in WT hepatocytes but was not effective in NLRP3−/− hepatocytes. After re‐expressing NLRP3 in NLRP3−/− hepatocytes by adenovirus, the anti‐lipid deposition effect of naringenin was restored.
Conclusion and Implications
Naringenin prevented NAFLD via down‐regulating the NLRP3/NF‐κB signalling pathway both in KCs and in hepatocytes, thus attenuating inflammation in the mice livers.
Abbreviations
- ALT
alanine aminotransferase
- AST
aspartate aminotransferase
- KCs
Kupffer cells
- LPS
Lipopolysaccharide
- LRP3
NOD‐like receptor pyrin domain containing 3
- MCD
methionine‐choline deficient
- NAFLD
non‐alcoholic fatty liver disease
- OA
oleic acid
- TC
total cholesterol
- TG
triglycerides
What is already known
Naringenin, a plant flavonoid, attenuated non‐alcoholic fatty liver disease (NAFLD) in mice.
What does this study add
The anti‐NAFLD effects of naringenin involved the inflammasome NLRP3 and the NLRP3/NF‐κB pathway.
What is the clinical significance
Naringenin may have potential as a clinical treatment to prevent NAFLD in humans.
1. INTRODUCTION
Non‐alcoholic fatty liver disease (NAFLD) is a progressive hepatic disease with ectopic fat accumulation in the liver caused by injurious factors, other than alcohol. Estimates of the prevalence of NAFLD range from 25% to 45% in epidemiological studies (Rinella, 2015). Currently, the pathogenic factors of NAFLD are complex and not yet fully defined, but the “two‐hit hypothesis” is the most accepted theory (Buzzetti, Pinzani, & Tsochatzis, 2016). The “two‐hit hypothesis” states that the hepatic lipid accumulation caused by Type 2 diabetes mellitus (T2DM), obesity, dyslipidaemia, and other factors (the first hit) leads to simple fatty liver, increasing the susceptibility of liver to various other injurious factors. Such factors include inflammation, oxidative stress, mitochondrial dysfunction and adipose disorder (the second hit) and cause more serious lesions in the liver, eventually leading to NAFLD, non‐alcoholic steatohepatitis, liver fibrosis, liver cirrhosis, and even hepatocellular cancer (Lim et al., 2010).
It is now widely accepted that chronic inflammation plays a key role in the initiation, progression, and development of metabolic diseases, including NAFLD (Baker, Hayden, & Ghosh, 2018). Kupffer cells (KCs) are tissue macrophages localized within the liver sinusoids, secreting pro‐inflammatory cytokines when the liver is damaged. In the diet‐induced obesity mouse model, activation of KCs drives inflammatory responses, which recruits circulating macrophages, aggravates inflammation in hepatocytes and promotes fatty liver development (Dong et al., 2018). Injured hepatocytes also secrete a number of pro‐inflammatory cytokines, which contributed to hepatic inflammation (Marra et al., 2008). NF‐κB signalling is also activated in injured hepatocytes to up‐regulate transcription of inflammatory cytokines such as https://www.guidetopharmacology.org/GRAC/LigandDisplayForward?ligandId=5074 and https://www.guidetopharmacology.org/GRAC/LigandDisplayForward?ligandId=4974 (Rex et al., 2019). Increased expression of inflammatory cytokines further activates the downstream NF‐κB signalling pathway, forming a positive feedback that aggravates inflammation and lipid deposition in liver.
The inflammasome https://www.guidetopharmacology.org/GRAC/ObjectDisplayForward?objectId=1770 is a cytoplasmic multiprotein complex that is responsible for the activation of inflammatory reactions (Shao et al., 2015). NLRP3 mediates the cleavage and maturation of IL‐1β and https://www.guidetopharmacology.org/GRAC/LigandDisplayForward?ligandId=4983, which in turn lead to a complex network of cellular reactions that trigger local and systemic inflammatory reactions (Boaru et al., 2015). Activation of NLRP3 inflammasome in hepatocytes has been related to the pathogenesis of liver diseases (Szabo & Csak, 2012). NF‐κB signalling is a prerequisite for the activation of NLRP3 inflammasome (Szabo & Petrasek, 2015). Free fatty acids also can activate the NLRP3 inflammasome (Gianfrancesco et al., 2003) and sensitize hepatocytes to endotoxin response, leading to non‐alcoholic steatohepatitis. In particular, inhibition of the NLRP3 inflammasome reduced inflammation and fibrosis in mice livers ( Mridha et al., 2017). Therefore, inhibition of the inflammatory regulators such as NLRP3 and NF‐κB that are involved in NAFLD progression might be a promising strategy in the discovery of new drugs for NAFLD prevention and treatment.
Naringenin (4,5,7‐trihydroxyflavone; Figure 1a) is a flavonoid compound found in plants and is abundant in citrus fruits, especially grapefruit (Orhan et al., 2015). In recent years, naringenin has been shown to exert a range of biological effects, including anti‐inflammation (Jin, Zeng, Zhang, Zhang, & Liang, 2018), anti‐oxidation (Zhao et al., 2017), hypolipidaemic effects (Mulvihill et al., 2009), immunoregulation (Zeng et al., 2018), and antineoplastic activity (Ke et al., 2017). Moreover, naringenin ameliorated obesity (Burke et al., 2018), metabolic syndrome (Alam et al., 2014), diabetes (Al‐Dosari, Ahmed, Al‐Rejaie, Alhomida, & Ola, 2017), and atherosclerosis (Mulvihill et al., 2010b, a). We have found that naringenin attenuated the hepatic lipid accumulation induced by a methionine‐choline deficient (MCD) diet in mice (Chen et al., 2017). However, the effects of naringenin in NAFLD, as well as the underlying mechanism(s), have not been fully investigated.
Figure 1.
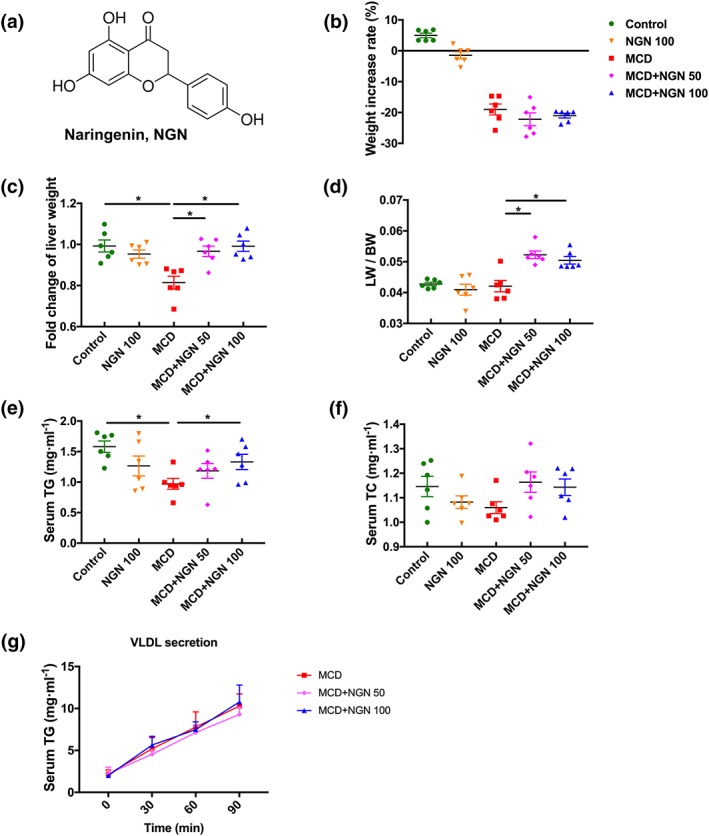
Effect of naringenin (NGN) on body weight, liver weight, serum lipids, and VLDL secretion rates of the WT mice fed with MCD diet. (a) Molecular structure of naringenin. (b–d) Body weight, liver weight, and ratio of liver weight to body weight. (e) Serum TG. (f) Serum TC. (g) VLDL secretion rates. Data shown are individual values with means ± SEM; n = 6 in each group. *P<.05, significantly different as indicated
This study therefore explored the possible prevention by naringenin of NAFLD in vivo, using the MCD diet‐induced mouse model, and in vitro on KCs and hepatocytes stimulated by https://www.guidetopharmacology.org/GRAC/LigandDisplayForward?ligandId=5019 and LPS plus https://www.guidetopharmacology.org/GRAC/LigandDisplayForward?ligandId=1054).
2. METHODS
2.1. Animal experiments
All animal care and experimental procedures were carried out in accordance with the Animals (scientific procedures) Act 1986, the National Institutes of Health Laboratory Animal Application Guidelines and the Regulations for the Administration of Affairs Concerning Experimental Animals published by the State Science and Technology Commission of China, and were approved by the Animal Ethics Committee of Peking University Healthcare and the Biomedical Ethics Committee of Peking University. Animal studies are reported in compliance with the ARRIVE guidelines (Kilkenny, Browne, Cuthill, Emerson, & Altman, 2010; McGrath & Lilley, 2015) and with the recommendations made by the British Journal of Pharmacology.
C57BL/6 mice were purchased from the Department of Laboratory Animal Science, Peking University Health Science Center (Beijing, China). The NLRP3−/− mice (on a C57BL/6 background; Xiao et al., 2018) were from the collaborative lab of Prof. Youyi Zhang. All mice were kept under a 12‐hr light/dark cycle with free access to food and water. Ambient temperature stabilized at 24 ± 2°C, and relative humidity was 45%.
2.2. Induction of NAFLD and naringenin administration
Male C57BL/6 wild type mice (8 weeks old, 20–23 g) were randomly divided into five groups, including control group, 100 mg·kg−1·day−1 naringenin (NGN 100) group, MCD group, MCD + 50 mg·kg−1·day−1 naringenin (MCD+NGN 50) group, and MCD + 100 mg·kg−1·day−1 naringenin (MCD+NGN 100) group; each group consisted of 6 mice (n = 6).
Male NLRP3−/− mice (8 weeks old, 20–23 g) were randomly divided into three groups: a control group, a MCD group, and a MCD + NGN 100 group (n = 5 per group).
Mice fed with a normal chow diet, containing 0.35% (w/w) methionine and 0.1% (w/w) choline, comprised the control group. Mice in the MCD groups were fed with the MCD diet, containing 0% methionine and 0% choline, for 1 week to induce NAFLD. There were no significant differences in the amounts of chow eaten, between the two diets. Mice in the control group and the MCD group were treated with the same volume of 0.5% sodium carboxymethyl cellulose as vehicle control. In the drug‐treated groups, mice were given naringenin by gavage (50 or 100 mg·kg−1·day−1, dispersed in 0.5% sodium carboxymethyl cellulose).
The mice were killed with an overdose of sodium pentobarbital. Blinding was used in subsequent analyses.
2.3. Determination of triglycerides (TG) and total cholesterol (TC) in plasma
Blood samples were taken from the mice after 12‐hr fasting. Heparin was added to blood for anticoagulant. Blood was centrifuged (Eppendorf 5418R, Eppendorf Corporation, Hamburg, Germany) at 1,400× g for 10 min at 4°C, and the plasma were taken for analysis. Plasma TG and TC were measured according to manufacturer's instructions of the kits.
2.4. Determination of TG and TC in mouse livers
The livers in each group were weighed and homogenized in 1‐ml pre‐cooled PBS. The homogenate was transferred to a 10‐ml glass tube and chloroform/methanol (4‐ml; 2/1, v/v) added. After vigorous mixing, the mixture was centrifuged (Eppendorf 5418R, Eppendorf Corporation, Hamburg, Germany) at 300× g for 30 min at 4°C. The upper aqueous phase was removed to a new tube and the chloroform/methanol extraction repeated. The lower organic phase was removed to another 10‐ml glass tube. The two organic phases were combined, the solvents evaporated in a stream of nitrogen and 500 μl of 3% Triton X‐100 (v/v) solution added to dissolve the lipids. TG and TC levels in the liver tissues were measured according to manufacturer's instructions of the kits and normalized by the weight of liver tissues.
2.5. Histopathological study
The livers were fixed in 4% paraformaldehyde solution for 2 hr, followed by dehydration in 20% sucrose solution overnight. OCT‐embedded frozen livers were sectioned at 7 μm. For Oil Red O staining, slides or cells were rinsed three times in PBS and fixed in 4% paraformaldehyde (v/v) for 10 min and then rinsed three times in double distilled water. After that, the liver cryosections were immersed in 60% isopropanol solution for 10 min, followed by Oil Red O staining for 30 min. Then the cryosections were rinsed in 60% isopropanol solution several times followed a rinse with double distilled water. Nuclei were counter‐stained with haematoxylin for 2 min. Glycerine was used to fix the cover slips onto the slides. Haematoxylin–eosin (H&E) staining was used to analyse hepatocyte morphology and hepatocellular ballooning. Images were observed using Leica Q550 IW imaging workstation (Leica Microsystems Imaging Solutions Ltd., Cambridge, UK).
2.6. Immunohistochemistry staining
The antibody‐based procedures in this study comply with the recommendations made by the British Journal of Pharmacology. (Alexander et al., 2018). Immunohistochemistry staining for CD68 (25747‐1‐AP, AB_2721140, Proteintech) and CD64 (sc‐515431, Santa Cruz) was performed on frozen liver sections. The slides were fixed in 4% paraformaldehyde (v/v) for 10 min. The fixed samples were sequentially exposed to endogenous peroxidase blocking solution (ZSGB‐Bio, Beijing, China) for 10 min. Then they were blocked with normal goat serum for 1 hr. The liver sections were incubated with primary antibody (1:100) overnight at 4°C. After that, the slides were incubated with secondary antibody (1:400) for 60 min at 37°C. The sections were incubated with diaminobenzidine (ZSGB‐Bio, Beijing, China) peroxidase substrate to visualize peroxidase activity by light microscopy and quantified by a semi‐quantification software ImageJ.
2.7. VLDL secretion experiment
Male C57BL/6 mice (8 weeks old, 20–23 g) fed with MCD diet were treated with naringenin (50 or 100 mg kg−1·day−1) by gavage for 1 week at the same time. After fasting for 12 hr, mice were treated with Triton wk‐1339 (20% v/v) by tail vein injection. Blood samples were drawn by retro‐orbital bleeding into heparinized tubes at 0, 30, 60, and 90 min after injection. Plasma samples were taken after centrifugation (Eppendorf 5418R, Eppendorf Corporation, Hamburg, Germany) at 1,400× g for 10 min at 4°C. TG levels in each plasma sample were measured according to the manufacturers’ instructions in the kits.
2.8. Isolation of primary hepatocytes
Primary hepatocytes were isolated from male C57BL/6 or NLRP3−/− mice (8 weeks old). Mice were anaesthetized by sodium pentobarbital. Livers were first perfused via the portal vein, with 20‐ml buffer A (KRG buffer with 0.1‐mM EGTA; KRG buffer composition, g l‐1: NaCl 7.0, NaHCO3 2.0, glucose 3.6, 1M HEPES (pH 7.45) 5mL, solution C (g l‐1; KCl 35.7, MgSO4•7H2O 29.58, KH2PO4 16.33) 10mL; final pH 7.45), then with 20‐ml buffer B (KRG buffer with 2‐mM CaCl2 and 0.5 mg·ml−1 of collagenase IV). The livers were then removed to a dish and 10‐ml buffer B added. The liver fascia was torn with tweezers and the buffer filtered with a 70‐μm cell strainer. Finally, the filtered cells were washed with 10% DMEM and centrifuged for 4 min at 50× g , twice.
2.9. Isolation of primary liver KCs
Primary liver KCs were isolated from C57BL/6 mice (8 weeks old) according to a published protocol (Froh, Konno, & Thurman, 2019). Briefly, mice were anaesthetized with sodium pentobarbital, and livers were perfused, via the portal vein, with 25‐ml CMF‐HBSS (composition, g l‐1: NaCl 8, KCl 0.4, Na2HPO4•7H2O 0.091, KH2PO4 0.06, glucose 1, NaHCO3 0.35, EGTA 0.19; pH 7.4) , followed by perfusion with 25‐ml HBSS (composition, g l‐1: NaCl 8, KCl 0.4, Na2HPO4•7H2O 0.091, KH2PO4 0.06, glucose 1, MgSO4•7H2O 0.2, CaCl2•7H2O 0.185, NaHCO3 0.35; pH 7.4) containing 0.5 mg·ml−1 of collagenase IV. Liver fascia was torn and the resulting suspension of cells centrifuged for 3 min at 70× g, 4°C. Supernatant was transferred to a clean 50‐ml tube and centrifuged for 7 min at 650× g, 4°C. The supernatant was discarded and the cell pellets resuspended in 10‐ml HBSS by gentle pipetting. The cell suspension was then carefully layered onto a 50%/25% two‐step Percoll gradient in a 50‐ml conical centrifuge tube (to avoid mixing the cell suspension with the upper Percoll layer), and the tube was centrifuged at 1,800× g for 15 min, 4°C. The upper layer (supernatant) was carefully removed from the tube and discarded. The middle layers in the tube were collected into a new 50‐ml tube and filled with HBSS. The middle layers were centrifuged (7 min, at 650× g, 4°C), the supernatant discarded and the cell pellets resuspended. CD14‐positive cells (AB_940578, 123307, Biolegend) were identified as KCs by flow cytometric analysis and formed about 80% of the cells. Then KCs were stimulated by LPS to study for the effects of naringenin on inflammatory activation and signalling pathways.
2.10. Cell culture
Primary hepatocytes, KCs, and HepG2 cells (Shanghai Institute of Biochemistry and Cell Biology, Shanghai, China) were cultured in DMEM supplemented with 10% FBS and 1% penicillin–streptomycin in a 5% CO2 incubator at 37°C. Stock solutions of 83.3‐mM oleic acid (OA) was dissolved in 0.1‐M NaOH at 75°C for 15 min by saponification. The OA was added to serum‐containing cell culture medium (containing 5% BSA) to a final concentration of 300 μM and heated for 15 min at 55°C and cooled to room temperature to obtain the OA‐BSA complex. The final concentration of LPS is 2.5 μg·ml−1. Cells were starved in serum‐free DMEM for 12 hr followed by incubation with OA and LPS for additional 24 hr in the absence or presence of naringenin (100 or 200 μM). The final concentration of ATP was 2.5 mM. Adenovirus was purchased from Vigene Biosciences (Shandong, China). Adenovirus was added to 10% DMEM and incubated with cells for 12 hr. These transfected cells were used for subsequent experiments. Blinding was used in analysis of the data obtained.
2.11. Methylthiazolyl tetrazolium assay for cell viability
The cells were cultured in 96‐well plates (4–5 × 10⁴ cells per well) for 24 hr. The cells were then treated with different concentrations of naringenin for 24 hr. Then, methylthiazolyl tetrazolium was added to each well to a final concentration of 0.5 mg·ml−1 and incubated for 4 hr at 37°C. The supernatant was removed and DMSO added (200‐μl per well) to dissolve the formazan, and absorbance at 490 nm was measured with a microplate reader (No. 550, Hercules, California, USA).
2.12. Determination of TG in hepatocytes
Cells were digested with 0.25% trypsin, then collected in DMEM, centrifuged, resuspended in PBS, and samples taken to measure protein concentration. The following steps were the same as those for extraction of lipid in liver (section 2.4). After evaporating the organic phase with nitrogen, Triton X‐100 solution (3% v/v; 40 μl) was added to dissolve the lipid. TG level in the liver tissues were measured according to manufacturer's instructions of the kits and normalized by the protein concentration.
2.13. RNA isolation and qPCR analysis
Total RNA was isolated from tissues or cells using Trizol Reagent according to the manufacturer's protocol. Then mRNA was reverse‐transcribed into cDNA using 5 × All‐In‐One RT MasterMix. qPCR analysis was performed in a MiniOpticon Real‐Time PCR Detection System (BioRad Laboratories, USA) using an EvaGreen qPCR MasterMix. Primer sequences are listed in Table S1.
2.14. Western blot analysis
The tissues or cells were lysed in RIPA, and protein concentrations were measured by a BCA protein assay. Proteins were run on 10% SDS‐PAGE and transferred to nitrocellulose membranes. The blots were subsequently incubated with mouse anti‐NF‐κB/p65 (1:500), rabbit anti‐IL‐1β (1:2,000), rabbit anti‐IL‐18 (1:500), rabbit anti‐NLRP3 (1:1,000), and mouse anti‐GAPDH (1:5,000) primary antibodies at 4°C overnight followed by HRP‐conjugated secondary antibodies (1:5,000) for 1 hr and visualized with electrochemiluminescent system (BioRad, USA) and quantified by a semi‐quantification software, ImageJ.
2.15. Data and statistical analysis
The data and statistical analysis in this study comply with the recommendations of the British Journal of Pharmacology on experimental design and analysis in pharmacology (Curtis et al., 2018). Data are presented as mean ± SEM and were analysed using the GraphPad Prism for Windows (version 4, San Diego, CA, USA). Statistical significance of differences among the groups was analysed by one‐way ANOVA for multiple comparisons with Tukey's test. Tukey's tests were run only when F achieved P < .05 and there was no significant variance inhomogeneity. P < .05 was considered as statistical significance of difference. Statistical analysis was undertaken only for studies where each group size was at least n = 5. The declared group size is the number of independent values and that statistical analysis was done using these independent values. To control the unwanted sources of variation, normalization of the data was also carried out. The normalized data are expressed as fold of control.
2.16. Materials
Naringenin and Oil Red O was purchased from Sigma‐Aldrich (St. Louis, MO). MCD diet was purchased from Trophic Animal Feed High‐tech Co., Ltd (Jiangsu, China). Total cholesterol (TC) and triglycerides (TG) kits were purchased from Biosino (Suzhou, China). Trizol Reagent was purchased from Invitrogen (USA). All‐In‐One RT MasterMix and EvaGreen qPCR MasterMix were purchased from ABM (Canada). ProteinExt Mammalian Total Protein Extraction Kit were purchased from TRANSGEN BIOTECH (Beijing, China). BCA protein kit was purchased from Thermo (USA). Nitrocellulose membranes were purchased from BioRad (USA). Mouse anti‐NF‐κB/p65 (sc‐8008, RRID:AB_628017), mouse anti‐GAPDH primary antibody (sc‐166545, RRID:AB_2107299), HRP‐conjugated goat‐anti‐rabbit (sc‐2004, RRID:AB_631746), and goat‐anti‐mouse (sc‐2005, RRID:AB_631736) IgG were purchased from Santa Cruz (USA). Rabbit anti‐IL‐1β primary antibody (ab9722, AB_308765) was purchased from Abcam (UK). Rabbit anti‐IL‐18 primary antibody (10663‐1‐AP, AB_2123636) was purchased from Proteintech (USA). Rabbit anti‐NLRP3 primary antibody (15101, AB_2722591) was purchased from Cell Signaling Technology (USA). FBS, DMEM, trypsin, and EDTA were purchased from Gibco (Grand Island, USA). LPS was purchased from Yuanye (Shanghai, China). OA was purchased from Energy Chemical (Shanghai, China). Other chemical reagents were purchased from local suppliers in China.
2.17. Nomenclature of targets and ligands
Key protein targets and ligands in this article are hyperlinked to corresponding entries in http://www.guidetopharmacology.org, the common portal for data from the IUPHAR/BPS Guide to PHARMACOLOGY (Han et al., 2018), and are permanently archived in the Concise Guide to PHARMACOLOGY 2019/20 (Alexander, Fabbro et al., 2019).
3. RESULTS
3.1. Naringenin protected against liver steatosis and injury induced by MCD diet
After one week on the MCD diet, significant reductions in body weight, liver weight and a ratio of liver to body weight were observed, as expected in the MCD group (Figure 1b), which were significantly reversed in the MCD+NGN 100 group (Figure 1c,d). The MCD diet also decreased plasma TG levels but did not affect the plasma TC levels (Figure 1e,f). Correspondingly, naringenin treatment remedied the reduced plasma TG levels caused by MCD diet feeding, but had no effect on TC levels (Figure 1e,f). However, treating the mice with naringenin did not change their VLDL secretion rate, compared with the MCD group (Figure 1g). Plasma alanine aminotransferase (ALT) and aspartate aminotransferase (AST) levels are an important criterion for evaluation of liver injury. Compared to the control group, plasma ALT and AST levels in the MCD group were elevated, but NGN 100 treatment (MCD+NGN 100 group) reduced these raised levels of ALT and AST (Figure 2a,b). Compared to the control group, the NGN 100 group, receiving naringenin and control diet, did not show significant changes in these variables.
Figure 2.
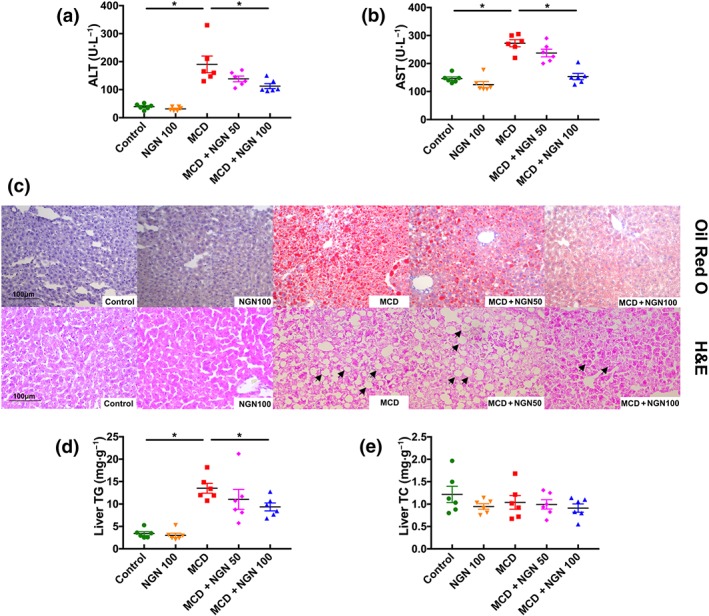
Naringenin (NGN) attenuated hepatic injury and steatosis in WT mice fed with MCD diet. (a, b) Serum ALT and AST. (c) Representative histology of H&E and Oil Red O staining. (d, e) TG and TC in mice livers. Data shown are individual values with means ± SEM; n = 6 in each group. *P<.05, significantly different as indicated
The results of the histological examination, using Oil Red O and H&E staining, revealed that the MCD diet triggered obvious macrovesicular steatosis in the livers of the MCD group of mice. However, the hepatic lipid deposition was significantly decreased in the MCD+NGN 100 group (Figure 2c). Notably, the lipid droplet density was greater in the MCD group than that in the MCD+NGN 100 group (Figure 2c). Moreover, there was a shift in the lipid droplet size distribution: The number of large droplets was greater in the livers of the MCD group than that in the MCD+NGN 100 group. Moreover, the results of hepatic lipid extraction also showed that the hepatic TG level was significantly increased in the MCD group, but this increase was much less in the MCD+NGN 100 group (Figure 2d). However, TC levels were not changed in any of the experimental groups (Figure 2e).
3.2. Naringenin inhibited hepatic inflammation in MCD mice
Inflammation has been recognized as a pivotal driver of NAFLD development, promoting hepatic lipid steatosis. Gene expression in the livers was examined by qPCR, and the results indicate that naringenin treatment did not change the mRNA levels of the genes related to lipid metabolism (Figure S1A), oxidative stress (Figure S1B), and endoplasmic reticulum stress (Figure S1C), but did affect the expression of several genes associated with inflammation. The qPCR assay showed that hepatic mRNA levels of inflammatory genes (TNF‐α, NF‐κB, NLRP3, and IL‐18) were significantly elevated in the MCD group, and these changes were reduced in the livers from the MCD+NGN group of mice (Figure 3a). Analysis of H&E staining of liver sections revealed that naringenin treatment ameliorated the hepatic inflammation induced by MCD diet feeding.
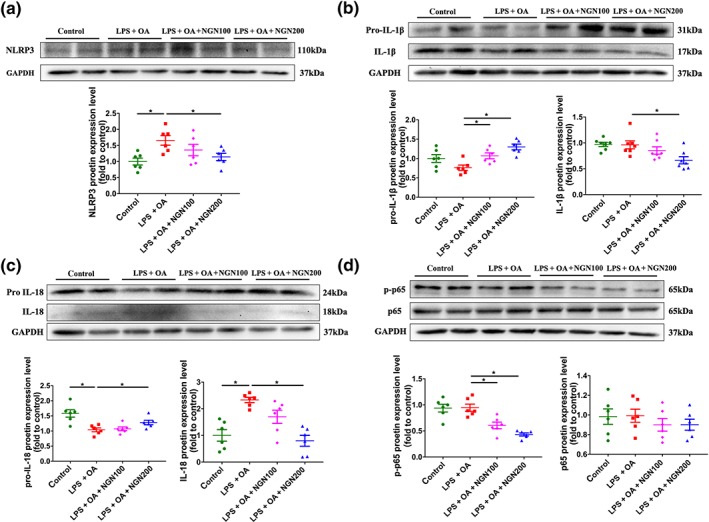
Figure 3.
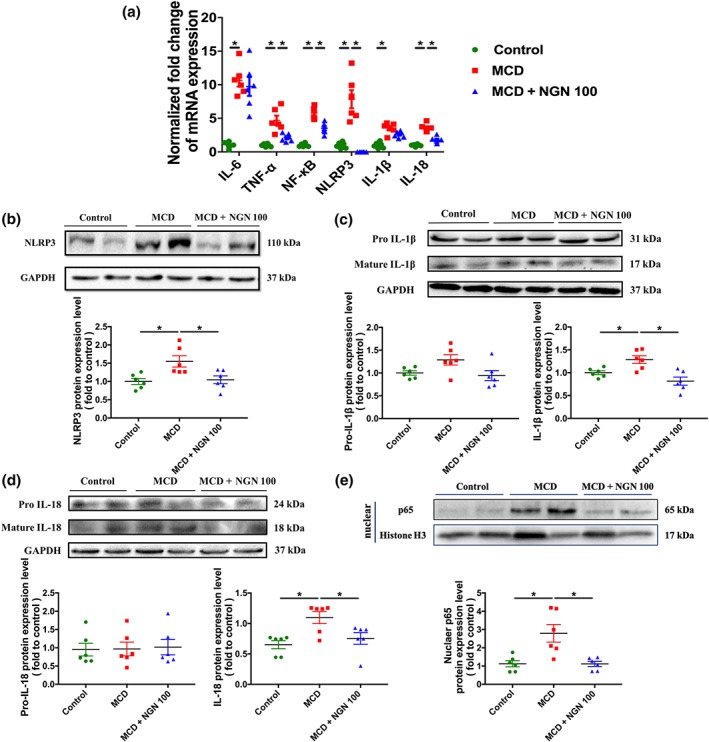
Naringenin (NGN) attenuated inflammation in WT mice livers induced by MCD diet. (a) Effects of naringenin (NGN) on mRNA expression level of pro‐inflammatory genes. (b–e) Protein expression and quantitative results of NLRP3, IL‐1β, IL‐18, and p65. Data shown are individual values with means ± SEM; n = 6 in each group. *P<.05, significantly different as indicated
Given that NLRP3/NF‐κB signalling plays vital roles in the inflammatory response in NAFLD, and based on the above results, we assumed that naringenin inhibits pro‐inflammatory cytokines synthesis by down‐regulation of NLRP3/NF‐κB. As expected, nuclear NF‐κB protein level was significantly down‐regulated in the NGN 100 group, compared to the MCD group (Figure 3e). Consistent with the changes in NF‐κB, the hepatic protein expression levels of NLRP3, IL‐1β, and IL‐18 were significantly enhanced in the MCD mice group and lowered greatly in the MCD+NGN 100 group (Figure 3b–d), indicating that naringenin suppressed activation of NLRP3 inflammasome to inhibit maturation of IL‐1β and IL‐18.
3.3. Naringenin attenuated lipid accumulation via inhibiting NLRP3/NF‐κB signalling pathway in HepG2 cells
A hepatic in vitro model of cellular steatosis with a fat overaccumulation profile was established in HepG2 cells by stimulation of the cells with LPS and OA. The results of methylthiazolyl tetrazolium assay showed that naringenin had no cytotoxic effects (cell viabilities higher than 80% of the normal cell control) on HepG2 cells at concentrations less than 200 μM (Figure 4a). Thus, naringenin concentrations of 100 and 200 μM were chosen for the following in vitro experiments.
Figure 4.
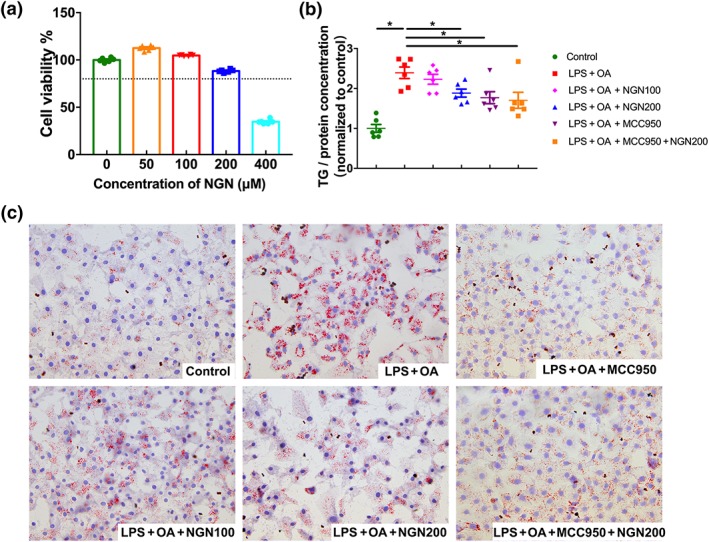
Naringenin (NGN) suppressed hepatocellular lipid deposition in HepG2 cells stimulated by LPS and OA. (a) Cytotoxicity of naringenin in HepG2 cells. (b) TG contents in HepG2 cells. (c) Lipid droplets in HepG2 cells measured by Oil Red O staining assay. Data shown are individual values with means ± SEM; n = 6 in each group. *P<.05, significantly different as indicated
HepG2 cells cultured in medium containing LPS and OA showed marked accumulation of lipid as assayed by Oil Red O staining, whereas treating the cells with naringenin (200 μM) or https://www.guidetopharmacology.org/GRAC/LigandDisplayForward?ligandId=8228 (NLRP3 inhibitor) significantly reduced the hepatocellular lipid accumulation (Figure 4c). Consistent with these findings, hepatocellular TG levels were increased significantly by co‐stimulation of the cells with LPS and OA but reduced significantly by treatment with either naringenin or MCC950 (Figure 4b). In addition, when the cells were treated together with a combination of naringenin and MCC950, the hepatocellular lipid deposition was not further decreased.
We found that NLRP3 was activated after 24‐hr stimulation of HepG2 cells with LPS and OA. Treatment of the cells with naringenin significantly reduced NLRP3 activation (Figure 5a). The activation of NLRP3 promoted the cleavage of pro IL‐1β and pro IL‐18 and increased the maturation of IL‐1β and IL‐18. However, naringenin treatment inhibited secretion of IL‐1β and IL‐18, resulting in accumulation of pro IL‐1β and pro IL‐18 (Figure 5b,c). It is noteworthy that LPS and OA did not activate phosphorylation of p65 (p‐p65), but naringenin treatment significantly inhibited protein expression of p‐p65 (Figure 5d).
Figure 5.
Naringenin (NGN) blocks NLRP3/NF‐κB inflammatory signalling pathway in HepG2 cells stimulated by LPS and OA. (a–d) Protein expression and quantitative results of NLRP3, IL‐1β, IL‐18, and p65 in HepG2 cells. Data shown are individual values with means ± SEM; n = 6 in each group. *P<.05, significantly different as indicated
3.4. The anti‐NAFLD effects of naringenin were abolished in NLRP3−/− mice
In order to further investigate the importance of NLRP3 for the effects of naringenin against NAFLD, NAFLD was induced in NLRP3 KO mice by the MCD diet (Figure 6a).
Figure 6.
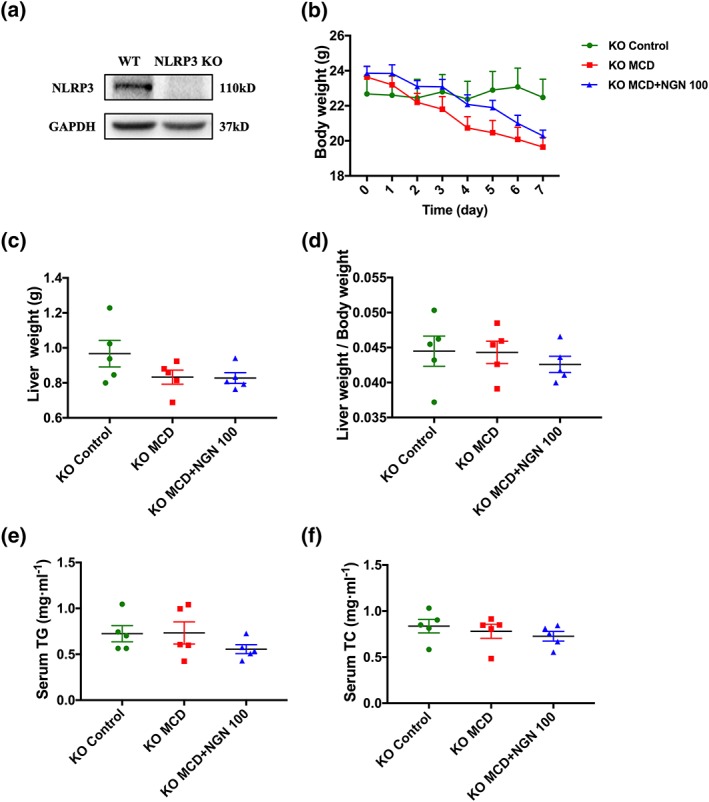
Effects of naringenin (NGN) on body weight, liver weight, and serum lipids were abolished in NLRP3 KO mice fed with MCD diet. (a) Protein expression of NLRP3 in the livers of NLRP3 KO mice. (b–d) Body weight, liver weight, and ratio of liver weight to body weight. (e) Serum TG. (f) Serum TC. Data shown are individual values with means ± SEM; n = 5 in each group
The body weight of the mice in the MCD+NGN 100 group remained significantly decreased (Figure 6b). However, the liver weight, ratio of liver to body weight, and serum TG levels that were decreased due to the MCD diet in WT mice were abolished. Consistent with these findings, naringenin treatment could not further improve these indicators of NAFLD (Figure 6c–e). There was no significant change in serum TC level (Figure 6f).
Oil Red O staining showed that the size of hepatic lipid droplets, caused by the MCD diet, was significantly reduced in the MCD group of NLRP3 KO mice but this change was not reduced further in the mice of the MCD+NGN 100 group. Hepatic lipid extraction also showed that naringenin treatment could not attenuate hepatic steatosis in the MCD+NGN 100 group of NLRP3 KO mice (Figure 7d,e). Moreover, compared to that in the Control group, hepatic lipid accumulation induced by the MCD diet increased about twofold in NLRP3 KO mice but increased about fourfold in WT mice, indicating that KO of the NLRP3 gene alone could attenuate NAFLD induced by the MCD diet.
Figure 7.
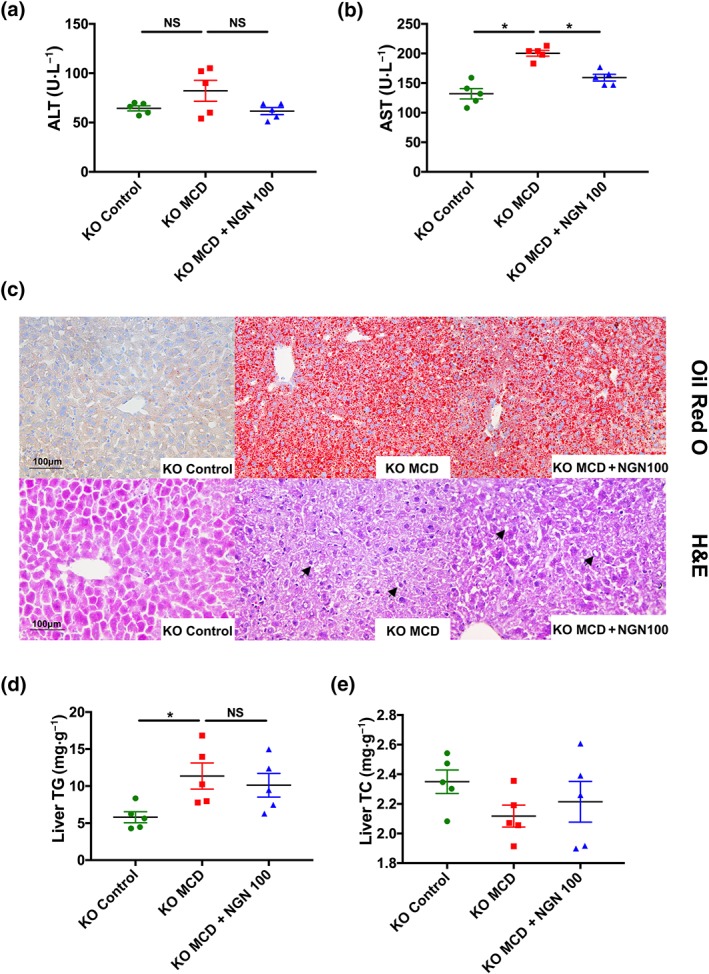
Naringenin (NGN) had no further effects on attenuation of liver steatosis in NLRP3 KO mice fed with MCD diet. (a, b) Serum ALT and AST in NLRP3 KO mice. (c) Representative histology of H&E and Oil Red O staining of NLRP3 KO mice. (d) The content of TG and TC in NLRP3 KO mice livers. Data shown are individual values with means ± SEM; n = 5 in each group. *P<.05, significantly different as indicated; NS, not significant
However, naringenin treatment significantly reduced the increase of serum AST levels induced by the MCD diet in NLRP3 KO mice, suggesting that naringenin may have other hepatoprotective effects (Figure 7a,b), apart from those involving NLRP3‐related inflammatory pathways.
3.5. The anti‐lipid deposition effect of naringenin is mediated by NLRP3
To further investigate the importance of NLRP3 activation to the anti‐lipid deposition effects of naringenin, primary hepatocytes were isolated and stimulated by LPS and OA. As shown in Figure 8, naringenin decreased TG accumulation in WT primary hepatocytes, but did not affect TG levels in hepatocytes from NLRP3 KO mice (Figure 8a). However, the lipid‐lowing effects of naringenin were observed after NLRP3 protein was re‐expressed using adenovirus, in NLRP3 KO primary hepatocytes (Figure 8b,c). Furthermore, in WT primary hepatocytes incubated with LPS and ATP, in order to activate NLRP3, levels of NLPR3 and mature IL‐1β proteins were increased. Treatment with naringenin down‐regulated this activation of NLRP3 and maturation of IL‐1β (Figure 8d–f).
Figure 8.
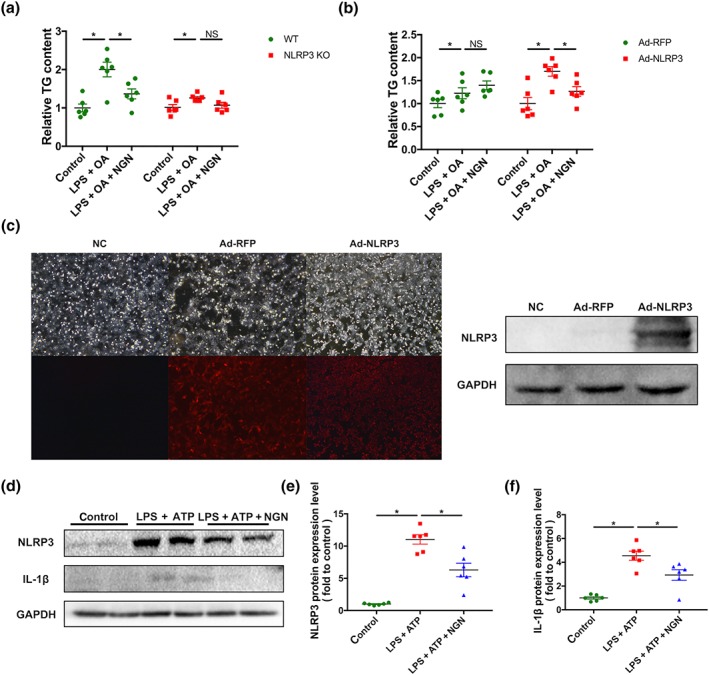
NLRP3 mediated the inhibitory effect of naringenin (NGN) on lipid accumulation in hepatocytes. (a) Effects of naringenin treatment on TG contents in the primary hepatocytes separated from WT or NLRP3 KO mice after stimulated by LPS and OA. (b) After stimulated by LPS and OA, effects of naringenin treatment on TG contents in the primary hepatocytes separated from NLRP3 KO mice and re‐expressed NLRP3 by adenovirus in NLRP3 KO mice. (c) Fluorescence and western blot graph of NLRP3 protein expression after adenovirus infection. (d–f) Effects of naringenin treatment on protein expression and quantitation of NLRP3 and IL‐1β proteins in primary hepatocytes separated from WT mice after stimulated by LPS and ATP. Data shown are individual values with means ± SEM; n = 6 in each group. *P<.05, significantly different as indicated; NS, not significant
3.6. Naringenin also ameliorated inflammatory activation in KCs
Activation of KCs was increased when hepatic inflammation was aggravated. Results of immumohistochemical staining ex vivo showed that expression of CD68 and CD64, markers of macrophages, were augmented in both WT and NLRP3−/− mice fed with the MCD diet. Correspondingly, naringenin significantly lowered CD64 at both the low (MCD+NGN 50) and the high (MCD+NGN 100) dose, and lowered CD68 at the high dose in WT mice (Figure 9a–c). In NLRP3−/− mice, the MCD diet increased CD68 and CD64 expression less than in the WT MCD group. Treatment with naringenin at either dose (MCD+NGN 50 or MCD+NGN 100) did not affect CD68 and CD64 expression. (Figure 9d–f).
Figure 9.
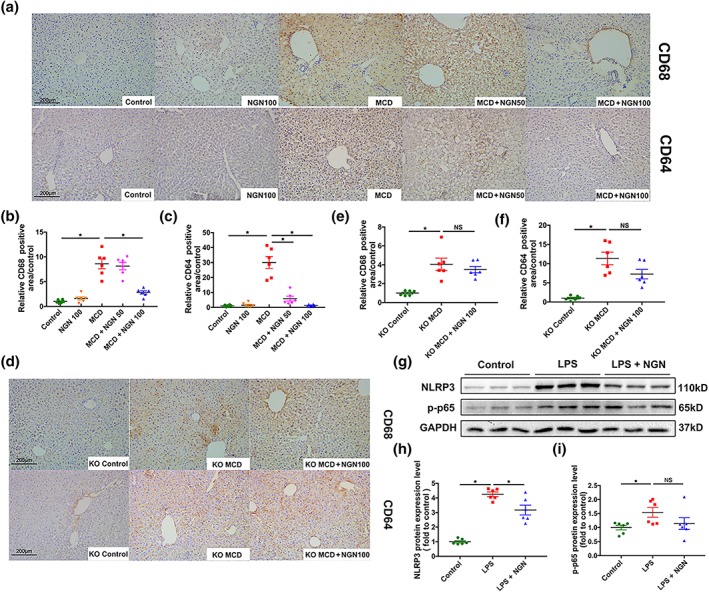
Naringenin (NGN) attenuated inflammatory activation in liver Kupffer cells. (a–c) Representative images of immunohistochemical staining of CD68 and CD64 of WT mice livers and semi‐quantification respectively. (d, e) Representative images of immunohistochemical staining of CD68 and CD64 of NLRP3−/− mice livers and semi‐quantification respectively. (g–i) Western blot of NLRP3 and p‐p65 in primary liver Kupffer cells after stimulated by LPS and treated with naringenin. Data shown are individual values with means ± SEM; n = 6 in each group. *P<.05, significantly different as indicated
We also isolated primary liver KCs from WT mice. NLRP3 protein expression increased after LPS stimulation and was significantly reduced by naringenin treatment. Interestingly, p‐p65 also augmented when stimulated with LPS but only showed a decreasing tendency with naringenin treatment (Figure 9g–i), which suggests that naringenin may also regulate p‐p65 through NLRP3 in a feedback mechanism rather than direct regulation.
4. DISCUSSION
At present, the most common drugs used for the clinical treatment of NAFLD include hypoglycaemic drugs, lipid‐lowering drugs, and insulin sensitizers (Pallayova & Taheri, 2014), but the efficacy and safety of these drugs in long‐term application remain to be determined. Besides, these drugs are not specific for NAFLD treatment, but for the original diseases, such as hyperglycaemia or hyperlipidaemia. The MCD diet model is a simple fatty liver model that does not include NAFLD caused by other diseases indirectly and is suitable for the study of drugs specifically for the prevention and treatment of NAFLD.
The MCD diet model is a well‐established experimental NAFLD model with features of hepatic steatosis which are similar to the pathological features of human NAFLD (Coulon et al., 2013). In addition, the value of anti‐inflammatory treatment for NAFLD has been demonstrated in several clinical trials (Sumida & Yoneda, 2018), and the MCD diet model is a typical inflammatory model, which is suitable for studying the role of potential drugs in preventing NAFLD, through inhibiting inflammation‐related pathways. The lack of VLDL secretion inhibited the transport of TG from liver into the circulation and resulted in severe hepatic TG accumulation and a reduced level of plasma TG in the MCD‐induced mouse model. Our data showed that naringenin treatment raised the low plasma TG levels caused by MCD diet feeding, but did not enhance VLDL secretion rate. This effect could be related to changes in TG metabolism (Mulvihill et al., 2009) but is more likely to reflect a decreased in hepatic inflammation.
In the progression of NAFLD, the aberrant regulation of inflammation is a prominent driving factor (Smith & Adams, 2011). Our results demonstrate that the MCD diet enhanced the mRNA expression levels of NF‐κB, IL‐1β, IL‐18, and NLRP3. In the classical pathway of NLRP3 inflammasome, activation of the NF‐κB signalling pathway initiates NLRP3 priming. After further assembly, activated caspase‐1 cleaves pro IL‐1β and IL‐18 to promote the maturation of IL‐1β and IL‐18, which expands the inflammatory response (Abderrazak et al., 2015). In our in vivo experiments, we found that naringenin significantly down‐regulated the mRNA and protein levels of NF‐κB, NLRP3, IL‐1β, and IL‐18 in the livers of mice on the MCD diet. In vitro, our first experiments showed that naringenin did not inhibit the lipid deposition in OA‐stimulated HepG2 cells (Figure S2A, B), a condition in which NLRP3 was not activated (Figure S2C). However, naringenin treatment did reduce lipid accumulation in HepG2 cells, stimulated with LPS and OA, in which NLRP3 signalling was activated significantly. Meanwhile, compared with the naringenin treatment group, adding MCC950, a NLRP3 inhibitor, to naringenin did not further decrease lipid accumulation, indicating that naringenin might inhibit development of fatty livers, through inhibiting inflammatory pathways involving NLRP3. In addition, when the MCD diet‐fed NLRP3−/− mice were treated with naringenin, their hepatic TG content did not reduce further. For further confirmation, we isolated primary hepatocytes from WT and NLRP3−/− mouse livers and stimulated the cells with LPS and OA. Naringenin was highly effective in preventing lipid deposition in WT primary hepatocytes but much less effective in NLRP3−/− primary hepatocytes. However, after re‐expression of NLRP3 by adenovirus in NLRP3−/− primary hepatocytes, the anti‐lipid deposition effects of naringenin was restored. Lastly, in LPS and ATP‐stimulated WT primary hepatocytes, a treatment known to activate NLRP3, naringenin could also inhibit NLRP3 expression and activation, as expected. All the above results demonstrate that the anti‐NAFLD effect of naringenin was dependent on NLRP3. However, the mechanisms underlying the effects of naringenin on NLPR3 still need to be elucidated in further studies. Naringenin has been reported to inhibit activation of neutrophils through miR‐223 (Shi et al., 2016), a negative regulator of NLRP3, which indicates that naringenin may also regulate NLRP3 through other mediators.
In this study, we not only found that naringenin alleviated inflammation and lipid accumulation by inhibiting NLRP3 activation in hepatocytes but also found that naringenin reduced expression of CD68 and CD64, markers of macrophages, in the livers of the MCD diet‐fed WT mice but was less effective in the livers from NLRP3−/− mice fed the MCD diet.. Meanwhile, we found that naringenin also inhibited the high expression of NLRP3 induced by LPS and thereby would decrease the inflammation in KCs. Such amelioration of inflammatory activation in KCs would decrease secretion of pro‐inflammatory cytokines from the KCs, which could further ameliorate the inflammatory state of hepatocytes and thus contribute to the inhibition of lipid deposition in hepatocytes. The anti‐inflammatory effects of naringenin on KCs and hepatocytes both contributed to the overall reduced development of NAFLD.
In recent years, the role of NLRP3 in liver diseases has attracted increased attention and NLRP3 has been considered as a potential new therapeutic target for liver diseases. However, even though some studies have shown that liver injury can be alleviated by inhibiting the expression or function of NLRP3 (Han et al., 2019), there is no clinical inhibitor targeting NLRP3 for NAFLD prevention at present. We found that naringenin reduced inflammation by down‐regulating the activation of NLRP3 inflammasome and NF‐κB, which resulted in its anti‐NAFLD effects. The significant effects of naringenin on hepatic inflammation and steatosis indicate the potential application of naringenin, in the near future, as a clinical treatment for NAFLD.
CONFLICT OF INTEREST
The authors declare that they have no competing interests.
AUTHOR CONTRIBUTIONS
R.Q. and Q.W. conceived and designed this study. Q.W. and Y.O. performed the experiments and analysed the data. Q.W. and R.Q. drafted and revised the manuscript. G.H., C.W., S.Y., C.C., L.X., J.X., and H.D. provided great help for the laboratory technique, experiments, and data analysis. Prof. Y.Z. and H.X. provided suggestion for the experiments and helped in data analysis. The manuscript has been reviewed and approved by all authors.
DECLARATION OF TRANSPARENCY AND SCIENTIFIC RIGOUR
This Declaration acknowledges that this paper adheres to the principles for transparent reporting and scientific rigour of preclinical research as stated in the BJP guidelines for https://bpspubs.onlinelibrary.wiley.com/doi/abs/10.1111/bph.14207, https://bpspubs.onlinelibrary.wiley.com/doi/abs/10.1111/bph.14208, and https://bpspubs.onlinelibrary.wiley.com/doi/abs/10.1111/bph.14206, and as recommended by funding agencies, publishers and other organisations engaged with supporting research.
Supporting information
Figure S1. NGN had no significant regulatory effects on the mRNA expression of the genes related to lipid metabolism, oxidative stress and endoplasmic reticulum stress. (A) mRNA expression of lipid metabolism genes. (B) mRNA expression of oxidative stress genes. (C) mRNA expression of endoplasmic reticulum stress genes. n = 6 in each group.
Figure S2. NGN could not attenuate lipid accumulation stimulated by OA alone in HepG2 cells. (A) Oil red O staining of OA‐stimulated HepG2 cells. (B) The content of TG in HepG2 cells. (C) mRNA expression of NLRP3, IL‐1β and IL‐18. n = 6 in each group.
Table S1 Primers used for qPT‐PCR experiments
ACKNOWLEDGEMENT
We thank the Key Laboratory of Molecular Cardiovascular Sciences for technical support and access to instrumentation. This research was supported by the National Natural Science Foundation of China (U1803125 to R.Q., 81530009 to Y.Y.Z., and 81670205 to H.X.) and the National Basic Research Program of China (2015CB932100).
Wang Q, Ou Y, Hu G, et al. Naringenin attenuates non‐alcoholic fatty liver disease by down‐regulating the NLRP3/NF‐κB pathway in mice. Br J Pharmacol. 2020;177:1806–1821. 10.1111/bph.14938
REFERENCES
- Abderrazak, A. , Syrovets, T. , Couchie, D. , El Hadri, K. , Friguet, B. , Simmet, T. , et al. (2015). NLRP3 inflammasome: From a danger signal sensor to a regulatory node of oxidative stress and inflammatory diseases. Redox Biology, 4, 296–307. 10.1016/j.redox.2015.01.008 [DOI] [PMC free article] [PubMed] [Google Scholar]
- Al‐Dosari, D. I. , Ahmed, M. M. , Al‐Rejaie, S. S. , Alhomida, A. S. , & Ola, M. S. (2017). Flavonoid naringenin attenuates oxidative stress, apoptosis and improves neurotrophic effects in the diabetic rat retina. Nutrients, 9, 1161 10.3390/nu9101161 [DOI] [PMC free article] [PubMed] [Google Scholar]
- Alexander, S. P. H. , Fabbro, D. , Kelly, E. , Mathie, A. , Peters, J. A. , Veale, E. L. , … CGTP Collaborators (2019). THE CONCISE GUIDE TO PHARMACOLOGY 2019/20: Catalytic receptors. British Journal of Pharmacology, 176, S247–S296. 10.1111/bph.14751 [DOI] [PMC free article] [PubMed] [Google Scholar]
- Alexander, S. P. H. , Roberts, R. E. , Broughton, B. R. S. , Sobey, C. G. , George, C. H. , Stanford, S. C. , … Ahluwalia, A. (2018). Goals and practicalities of immunoblotting and immunohistochemistry: A guide for submission to the British Journal of Pharmacology . British Journal of Pharmacology, 175, 407–411. 10.1111/bph.14112 [DOI] [PMC free article] [PubMed] [Google Scholar]
- Baker, R. G. , Hayden, M. S. , & Ghosh, S. (2011). NF‐κB, inflammation, and metabolic disease. Cell Metabolism, 13, 11–22. 10.1016/j.cmet.2010.12.008 [DOI] [PMC free article] [PubMed] [Google Scholar]
- Boaru, S. G. , Borkham‐Kamphorst, E. , Van de Leur, E. , Lehnen, E. , Liedtke, C. , & Weiskirchen, R. (2015). NLRP3 inflammasome expression is driven by NF‐κB in cultured hepatocytes. Biochemical and Biophysical Research Communications, 458, 700–706. 10.1016/j.bbrc.2015.02.029 [DOI] [PubMed] [Google Scholar]
- Burke, A. C. , Sutherland, B. G. , Telford, D. E. , Morrow, M. R. , Sawyez, C. G. , Edwards, J. Y. , … Huff, M. W. (2018). Intervention with citrus flavonoids reverses obesity and improves metabolic syndrome and atherosclerosis in obese Ldlr−/− mice. Journal of Lipid Research, 59, 1714–1728. 10.1194/jlr.M087387 [DOI] [PMC free article] [PubMed] [Google Scholar]
- Buzzetti, E. , Pinzani, M. , & Tsochatzis, E. A. (2016). The multiple‐hit pathogenesis of non‐alcoholic fatty liver disease (NAFLD). Metabolism, 65, 1038–1048. 10.1016/j.metabol.2015.12.012 [DOI] [PubMed] [Google Scholar]
- Chen, C. , Jie, X. , Ou, Y. , Cao, Y. , Xu, L. , Wang, Y. , & Qi, R. (2017). Nanoliposome improves inhibitory effects of naringenin on nonalcoholic fatty liver disease in mice. Nanomedicine, 12, 1791–1800. 10.2217/nnm-2017-0119 [DOI] [PubMed] [Google Scholar]
- Coulon, S. , Legry, V. , Heindryckx, F. , Van Steenkiste, C. , Casteleyn, C. , Olievier, K. , et al. (2013). Role of vascular endothelial growth factor in the pathophysiology of nonalcoholic steatohepatitis in two rodent models. Hepatology, 57, 1793–1805. 10.1002/hep.26219 [DOI] [PubMed] [Google Scholar]
- Curtis, M. J. , Alexander, S. , Cirino, G. , Docherty, J. R. , George, C. H. , Giembycz, M. A. , … Ahluwalia, A. (2018). Experimental design and analysis and their reporting II: updated and simplified guidance for authors and peer reviewers. British Journal of Pharmacology, 175, 987–993. 10.1111/bph.14153 [DOI] [PMC free article] [PubMed] [Google Scholar]
- Dong, B. , Zhou, Y. , Wang, W. , Scott, J. , Kim, K. H. , Sun, Z. , … Moore, D. D. (2019). Vitamin D receptor activation in liver macrophages ameliorates hepatic inflammation, steatosis, and insulin resistance in mice. Hepatology. 10.1002/hep.30937 [DOI] [PubMed] [Google Scholar]
- Froh, M. , Konno, A. , & Thurman, R. G. (2003). Isolation of liver Kupffer cells. Current Protocols in Toxicology, 14, 14–14. [DOI] [PubMed] [Google Scholar]
- Gianfrancesco, M. A. , Dehairs, J. , L'Homme, L. , Herinckx, G. , Esser, N. , Jansen, O. , et al. (2019). Saturated fatty acids induce NLRP3 activation in human macrophages through K+ efflux resulting from phospholipid saturation and Na, K‐ATPase disruption. Biochimica et Biophysica Acta ‐ Molecular and Cell Biology of Lipids, 1864, 1017–1030. 10.1016/j.bbalip.2019.04.001.1864.1017.1030 [DOI] [PubMed] [Google Scholar]
- Han, C. Y. , Rho, H. S. , Kim, A. , Kim, T. H. , Jang, K. , Jun, D. W. , … Kim, S. G. (2018). FXR inhibits endoplasmic reticulum stress‐induced NLRP3 inflammasome in hepatocytes and ameliorates liver injury. Cell Reports, 24, 2985–2999. 10.1016/j.celrep.2018.07.068 [DOI] [PubMed] [Google Scholar]
- Harding, S. D. , Sharman, J. L. , Faccenda, E. , Southan, C. , Pawson, A. J. , Ireland, S. , … NC‐IUPHAR (2018). The IUPHAR/BPS guide to pharmacology in 2018: updates and expansion to encompass the new guide to immunopharmacology. Nucleic Acids Research, 46, D1091–D1106. 10.1093/nar/gkx1121 [DOI] [PMC free article] [PubMed] [Google Scholar]
- Alam, M. A. , Subhan, N. , Rahman, M. M. , Uddin, S. J. , Reza, H. M. , & Sarker, S. D. (2014). Effect of citrus flavonoids, naringin and naringenin, on metabolic syndrome and their mechanisms of action. Advances in Nutrition, 5, 404–417. 10.3945/an.113.005603 [DOI] [PMC free article] [PubMed] [Google Scholar]
- Jin, L. , Zeng, W. , Zhang, F. , Zhang, C. , & Liang, W. (2017). Naringenin ameliorates acute inflammation by regulating intracellular cytokine degradation. Journal of Immunology, 199, 3466–3477. 10.4049/jimmunol.1602016 [DOI] [PubMed] [Google Scholar]
- Ke, J. Y. , Banh, T. , Hsiao, Y. H. , Cole, R. M. , Straka, S. R. , Yee, L. D. , & Belury, M. A. (2017). Citrus flavonoid naringenin reduces mammary tumor cell viability, adipose mass, and adipose inflammation in obese ovariectomized mice. Molecular Nutrition & Food Research, 61, 1600934 10.1002/mnfr.201600934 [DOI] [PubMed] [Google Scholar]
- Kilkenny, C. , Browne, W. , Cuthill, I. C. , Emerson, M. , Altman, D. G. , & Group NCRRGW (2010). Animal research: Reporting in vivo experiments: The ARRIVE guidelines. British Journal of Pharmacology, 160, 1577–1579. [DOI] [PMC free article] [PubMed] [Google Scholar]
- Lim, J. S. , Mietus‐Snyder, M. , Valente, A. , Schwarz, J. M. , & Lustig, R. H. (2010). The role of fructose in the pathogenesis of NAFLD and the metabolic syndrome. Nature Reviews. Gastroenterology & Hepatology, 7, 251–264. 10.1038/nrgastro.2010.41 [DOI] [PubMed] [Google Scholar]
- Marra, F. , Gastaldelli, A. , Svegliati Baroni, G. , Tell, G. , & Tiribelli, C. (2008). Molecular basis and mechanisms of progression of non‐alcoholic steatohepatitis. Trends in Molecular Medicine, 14, 72–81. 10.1016/j.molmed.2007.12.003 [DOI] [PubMed] [Google Scholar]
- McGrath, J. C. , & Lilley, E. (2015). Implementing guidelines on reporting research using animals (ARRIVE etc.): New requirements for publication in BJP . British Journal of Pharmacology, 172, 3189–3193. 10.1111/bph.12955 [DOI] [PMC free article] [PubMed] [Google Scholar]
- Mridha, A. R. , Wree, A. , Robertson, A. A. B. , Yeh, M. M. , Johnson, C. D. , Van Rooyen, D. M. , et al. (2017). NLRP3 inflammasome blockade reduces liver inflammation and fibrosis in experimental NASH in mice. Journal of Hepatology, 66, 1037–1046. 10.1016/j.jhep.2017.01.022 [DOI] [PMC free article] [PubMed] [Google Scholar]
- Mulvihill, E. E. , Allister, E. M. , Sutherland, B. G. , Telford, D. E. , Sawyez, C. G. , Edwards, J. Y. , … Huff, M. W. (2009). Naringenin prevents dyslipidemia, apolipoprotein B overproduction, and hyperinsulinemia in LDL receptor‐null mice with diet‐induced insulin resistance. Diabetes, 58, 2198–2210. 10.2337/db09-0634 [DOI] [PMC free article] [PubMed] [Google Scholar]
- Mulvihill, E. E. , Assini, J. M. , Sutherland, B. G. , DiMattia, A. S. , Khami, M. , Koppes, J. B. , … Huff, M. W. (2010b). Naringenin decreases progression of atherosclerosis by improving dyslipidemia in high‐fat‐fed low‐density lipoprotein receptor‐null mice. Arteriosclerosis, Thrombosis, and Vascular Biology, 30, 742–748. 10.1161/ATVBAHA.109.201095 [DOI] [PubMed] [Google Scholar]
- Mulvihill, E. E. , Assini, J. M. , Sutherland, B. G. , DiMattia, A. S. , Khami, M. , Koppes, J. B. , et al. (2010a). Naringenin decreases progression of atherosclerosis by improving dyslipidemia in high‐fat‐fed low‐density lipoprotein receptor‐null mice. Arteriosclerosis, Thrombosis, and Vascular Biology, 30, 742–748. 10.1161/ATVBAHA.109.201095 [DOI] [PubMed] [Google Scholar]
- Orhan, I. E. , Nabavi, S. F. , Daglia, M. , Tenore, G. C. , Mansouri, K. , & Nabavi, S. M. (2015). Naringenin and atherosclerosis: A review of literature. Current Pharmaceutical Biotechnology, 16, 245–251. 10.2174/1389201015666141202110216 [DOI] [PubMed] [Google Scholar]
- Pallayova, M. , & Taheri, S. (2014). Non‐alcoholic fatty liver disease in obese adults: Clinical aspects and current management strategies. Clin Obes, 4, 243–253. 10.1111/cob.12068 [DOI] [PubMed] [Google Scholar]
- Rex, J. , Lutz, A. , Faletti, L. E. , Albrecht, U. , Thomas, M. , Bode, J. G. , … Merfort, I. (2019). IL‐1β and TNFα differentially influence NF‐κB activity and FasL‐induced apoptosis in primary murine hepatocytes during LPS‐induced inflammation. Frontiers in Physiology, 10, 117 10.3389/fphys.2019.00117 [DOI] [PMC free article] [PubMed] [Google Scholar]
- Rinella, M. E. (2015). Nonalcoholic fatty liver disease: A systematic review. JAMA, 313, 2263–2273. 10.1001/jama.2015.5370 [DOI] [PubMed] [Google Scholar]
- Shao, B. , Xu, Z. , Han, B. , Su, D. , & Liu, C. (2015). NLRP3 inflammasome and its inhibitors: A review. Frontiers in Pharmacology, 6, 262. [DOI] [PMC free article] [PubMed] [Google Scholar]
- Shi, L.‐B. , Tang, P.‐F. , Zhang, W. , Zhao, Y.‐P. , Zhang, L.‐C. , & Zhang, H. (2016). Naringenin inhibits spinal cord injury‐induced activation of neutrophils through miR‐223. Gene, 592, 128–133. 10.1016/j.gene.2016.07.037 [DOI] [PubMed] [Google Scholar]
- Smith, B. W. , & Adams, L. A. (2011). Non‐alcoholic fatty liver disease. Critical Reviews in Clinical Laboratory Sciences, 48, 97–113. 10.3109/10408363.2011.596521 [DOI] [PubMed] [Google Scholar]
- Sumida, Y. , & Yoneda, M. (2018). Current and future pharmacological therapies for NAFLD/NASH. Journal of Gastroenterology, 53, 362–376. 10.1007/s00535-017-1415-1 [DOI] [PMC free article] [PubMed] [Google Scholar]
- Szabo, G. , & Csak, T. (2012). Inflammasomes in liver diseases. Journal of Hepatology, 57, 642–654. 10.1016/j.jhep.2012.03.035 [DOI] [PubMed] [Google Scholar]
- Szabo, G. , & Petrasek, J. (2015). Inflammasome activation and function in liver disease. Nature Reviews. Gastroenterology & Hepatology, 12, 387–400. 10.1038/nrgastro.2015.94 [DOI] [PubMed] [Google Scholar]
- Xiao, H. , Li, H. , Wang, J. J. , Zhang, J.‐S. , Shen, J. , An, X.‐B. , … Zhang, Y.‐Y. (2018). IL‐18 cleavage triggers cardiac inflammation and fibrosis upon β‐adrenergic insult. European Heart Journal, 39, 60–69. 10.1093/eurheartj/ehx261 [DOI] [PubMed] [Google Scholar]
- Zeng, W. , Jin, L. , Zhang, F. , Zhang, C. , & Liang, W. (2018). Naringenin as a potential immunomodulator in therapeutics. Pharmacological Research, 135, 122–126. 10.1016/j.phrs.2018.08.002 [DOI] [PubMed] [Google Scholar]
- Zhao, M. , Li, C. , Shen, F. , Wang, M. , Jia, N. , & Wang, C. (2017). Naringenin ameliorates LPS‐induced acute lung injury through its anti‐oxidative and anti‐inflammatory activity and by inhibition of the PI3K/AKT pathway. Experimental and Therapeutic Medicine, 14, 2228–2234. 10.3892/etm.2017.4772 [DOI] [PMC free article] [PubMed] [Google Scholar]
Associated Data
This section collects any data citations, data availability statements, or supplementary materials included in this article.
Supplementary Materials
Figure S1. NGN had no significant regulatory effects on the mRNA expression of the genes related to lipid metabolism, oxidative stress and endoplasmic reticulum stress. (A) mRNA expression of lipid metabolism genes. (B) mRNA expression of oxidative stress genes. (C) mRNA expression of endoplasmic reticulum stress genes. n = 6 in each group.
Figure S2. NGN could not attenuate lipid accumulation stimulated by OA alone in HepG2 cells. (A) Oil red O staining of OA‐stimulated HepG2 cells. (B) The content of TG in HepG2 cells. (C) mRNA expression of NLRP3, IL‐1β and IL‐18. n = 6 in each group.
Table S1 Primers used for qPT‐PCR experiments