

Abstract
Background
Pregnancy is a cardiometabolic stressor and thus a critical period to address women's lifetime cardiovascular health (CVH). However, CVH among US pregnant women has not been characterized.
Methods and Results
We analyzed cross‐sectional data from National Health and Nutrition Examination Surveys 1999 to 2014 for 1117 pregnant and 8200 nonpregnant women, aged 20 to 44 years. We assessed 7 CVH metrics using American Heart Association definitions modified for pregnancy; categorized metrics as ideal, intermediate, or poor; assigned these categories 2, 1, or 0 points, respectively; and summed across the 7 metrics for a total score of 0 to 14 points. Total scores 12 to 14 indicated high CVH; 8 to 11, moderate CVH; and 0 to 7, low CVH. We applied survey weights to generate US population‐level estimates of CVH levels and compared pregnant and nonpregnant women using demographic‐adjusted polytomous logistic and linear regression. Among pregnant women, the prevalences (95% CIs) of ideal levels of CVH metrics were 0.1% (0%–0.3%) for diet, 27.3% (22.2%–32.3%) for physical activity, 38.9% (33.7%–44.0%) for total cholesterol, 51.1% (46.0%–56.2%) for body mass index, 77.7% (73.3%–82.2%) for smoking, 90.4% (87.5%–93.3%) for blood pressure, and 91.6% (88.3%–94.9%) for fasting glucose. The mean total CVH score was 8.3 (95% CI, 8.0–8.7) of 14, with high CVH in 4.6% (95% CI, 0.5%–8.8%), moderate CVH in 60.6% (95% CI, 52.3%–68.9%), and low CVH in 34.8% (95% CI, 26.4%–43.2%). CVH levels were significantly lower among pregnant versus nonpregnant women; for example, 13.0% (95% CI, 11.0%–15.0%) of nonpregnant women had high CVH (adjusted, comparison P=0.01).
Conclusions
From 1999 to 2014, <1 in 10 US pregnant women, aged 20 to 44 years, had high CVH.
Keywords: cardiovascular health, Life's Simple 7, pregnancy
Subject Categories: Pregnancy, Women, Epidemiology, Risk Factors
Clinical Perspective
What Is New?
Cardiovascular health (CVH), as defined by the American Heart Association with modifications for pregnancy, was examined among pregnant women in the United States for the first time.
Among pregnant women, CVH was far from optimal: 4.6% had high CVH, 60.6% had moderate CVH, and 34.8% had low CVH.
CVH was worse among pregnant women compared with nonpregnant women.
What Are the Clinical Implications?
Further study is warranted to determine the relevance of total CVH during pregnancy for maternal and offspring health outcomes.
Formal development of pregnancy‐specific guidelines and definitions for CVH metrics may aid in comprehensive CVH promotion in women across the life course, a stated goal of the American Heart Association and the American College of Obstetricians and Gynecologists.
Introduction
In 2018, the American Heart Association (AHA) and the American College of Obstetricians and Gynecologists released a joint advisory, highlighting the role of obstetricians and gynecologists in promoting women's cardiovascular health (CVH) across the life course.1 The authors described pregnancy as a physiological “stress test” that reveals underlying risk for cardiovascular disease (CVD),1 a phenomenon that is increasingly recognized in AHA guidelines and statements for women's cardiovascular care.2, 3, 4 Gestation is also increasingly recognized as a critical period for developmental programming of offspring CVD risk.5, 6 For example, maternal obesity in pregnancy has been associated with offspring CVD risk factors (adiposity, blood pressure, lipids, and insulin resistance), CVD events, and premature all‐cause mortality.6
The 2018 AHA/American College of Obstetricians and Gynecologists advisory highlighted the utility of “Life's Simple 7” CVH metrics to monitor women's CVH across the life course.1 As defined by the AHA in 2010, the 7 CVH metrics include diet, physical activity, nonsmoking, body mass index (BMI), blood pressure, total cholesterol, and fasting glucose.7 Thus defined, better CVH has been shown to powerfully predict CVD‐free longevity and other positive health outcomes in nonpregnant adults.8 Levels of CVH in the US population have been characterized across most of the life course, from childhood through later adulthood.8, 9 However, to our knowledge, CVH based on the AHA‐defined construct has not previously been described in pregnant women in the United States.
We sought to characterize CVH, defined using Life's Simple 7, among pregnant women, aged 20 to 44 years, in the United States and compare it with that among nonpregnant women. We also compared CVH between subgroups of pregnant women defined by trimester of pregnancy, age, and race/ethnicity.
Methods
All data used for this study are publicly available from the National Center for Health Statistics at https://www.cdc.gov/nchs/nhanes/index.htm.
Study Design and Participants
We analyzed cross‐sectional data from the National Health and Nutrition Examination Survey (NHANES), which uses a complex, multistage probability sampling design to select a sample representative of the civilian noninstitutionalized US population.10 In 1999 to 2006, pregnant women were oversampled. NHANES combines in‐home interviews with mobile examinations and laboratory tests. Written informed consent was obtained from all participants.
We included women, aged 20 to 44 years, who attended an NHANES examination between 1999 and 2014 (continuous examination cycles) and had a urine pregnancy test result available (publicly released by NHANES for women aged 20–44 years only). The overall NHANES examination response rate for women aged 20 to 49 years was 76% (range, 70%–80% across cycles),11 and urine pregnancy test results were available in 98% of women (range, 97%–98% across cycles).12 We analyzed all available data, excluding individuals from particular analyses if relevant variables were missing. The Northwestern University Institutional Review Board assigned a determination of research not involving human subjects.
Pregnancy Status and Trimesters
Urine pregnancy testing was performed with a rapid chromatographic immunoassay, which uses a combination of monoclonal and polyclonal antibodies to detect elevated levels of human chorionic gonadotropin.12 Women were classified as pregnant or nonpregnant on the basis of the result. Month of pregnancy was self‐reported in 1999 to 2012 (unavailable in 2013–2014); months 1 through 3 were considered first trimester, months 4 through 6 were second trimester, and months 7 through 9 were third trimester.
Demographics
For age‐stratified analyses, age was categorized as 20 to 24, 25 to 34, and 35 to 44 years to preserve subgroup sample sizes among pregnant women. Race and ethnicity were self‐reported from provided categories and coded in NHANES as Mexican, other Hispanic, non‐Hispanic white, non‐Hispanic black, or other race; starting in 2011, non‐Hispanic Asian became separate from other race. For race/ethnicity‐stratified analyses, data are presented only for Mexican, non‐Hispanic white, and non‐Hispanic black groups because of small sample sizes in the remaining groups. Education level was defined by the self‐reported highest level of school completed and categorized as less than high school, high school, or more than high school. Annual self‐reported family income/poverty level ratio was categorized as ≤1.30, 1.30 to ≤1.85, or >1.85, on the basis of national nutrition assistance program guidelines.13
Measurement of CVH Metrics
CVH behaviors, including diet, physical activity, and smoking status, were self‐reported during in‐person interviews. Dietary intake was assessed with a 24‐hour dietary recall interview. Starting in 2003 to 2004, a second 24‐hour recall interview was completed over the telephone; for 2003 to 2014, we averaged dietary data from the 2 recalls. The Food Patterns Equivalents Database14 (formerly MyPyramid Equivalents Database) was used to determine servings of dietary components consumed. Physical activity over the past 30 days (minutes moderate to vigorous) was assessed with questions about frequency and duration of recreational physical activities, such as exercise, sports, and physically active hobbies, at either a vigorous (heavy sweating or large increases in breathing or heart rate) or a moderate (light sweating or small increase in breathing or heart rate) level. Smoking status was assessed with interviewer‐administered questions about current and former smoking of cigarettes.
CVH factors, including BMI, blood pressure, total cholesterol, and fasting blood glucose, were measured by trained personnel. BMI was calculated as the weight in kilograms divided by the square of the height in meters from standardized height and weight measurements. Blood pressure was measured manually after 5 minutes of quiet, seated rest and determination of the maximal inflation level; 3 measurement attempts (or 4, if the third was incomplete) were recorded, and we averaged available measurements. Before venous blood draw, fasting status was assessed, and individuals assigned to morning examinations were specifically requested to fast. Venous blood was frozen and shipped to standardized laboratories. Total cholesterol and fasting plasma glucose were each measured enzymatically; however, glucose was only reported if fasting time was between 8 and 24 hours (otherwise, values were set as missing). Prescription medications were assessed during the household interview, and medication containers were examined when available.
Classification of CVH
Table 1 shows the definitions of CVH metric levels for pregnant and nonpregnant women. For diet, we used AHA definitions for 4 of 5 components: fruits and vegetables, whole grains, sodium, and sugar‐sweetened beverages. For fish, although the AHA definition of ideal is at least two 3.5‐ounce servings per week for nonpregnant women,7 we considered two to three 3.5‐ounce servings per week ideal for pregnant women (ie, >3 per week not ideal), consistent with Food and Drug Administration guidelines for pregnancy.15 For physical activity and smoking, we used standard AHA definitions, consistent with pregnancy guidelines.16 For BMI, only current measured BMI and self‐reported month of pregnancy were available (ie, not prepregnancy BMI or gestational weight gain). Therefore, we considered BMI ideal if current weight was less than or equal to the maximum allowable for current height, assuming a top‐normal prepregnancy BMI (24.9 kg/m2) and maximal recommended gestational weight gain per Institute of Medicine guidelines of up to 4.4 pounds total during the first trimester (months 1–3) and up to 5.1 pounds per month (1.0 lb/wk) thereafter.17 Otherwise, BMI was considered nonideal. For nonpregnant women, the standard AHA BMI definition was used,7 but intermediate and poor were collapsed to “nonideal” to mirror the categories for pregnant women. For blood pressure, primary analyses used the standard AHA definition, consistent with pregnancy guidelines,18 and sensitivity analyses used a stricter definition based on the 2017 American College of Cardiology/AHA blood pressure guideline (see Table 1 footnote).19 For total cholesterol, there are no guidelines on risk thresholds during pregnancy. On the basis of limited data that higher cholesterol levels in pregnancy are associated with adverse maternal and offspring effects,20, 21 we chose to retain the standard AHA definition for total cholesterol in the primary analyses. For fasting glucose, we used the standard AHA definition of ideal levels for earlier pregnancy (ie, <100 mg/dL untreated for months 1–5)7, 22 and a lower threshold for later pregnancy (<92 mg/dL untreated for months 6–9), consistent with international pregnancy guidelines23; all others were considered nonideal. The standard AHA definition was used for ideal glucose in nonpregnant women, but intermediate and poor were collapsed to nonideal to mirror the classification in pregnant women.
Table 1.
CVH Metric Definitions for Pregnant and Nonpregnant Women
| Metric | Pregnant Women | ||
|---|---|---|---|
| Ideal | Intermediate | Poor | |
| Dieta | 4–5 Components | 2–3 Components | 0–1 Component |
| Diet components: (1) fruits and vegetables: ≥4.5 cups/d; (2) fisha: 2–3 3.5‐oz servings/wk; (3) whole grains (ie, ≥1.1 g fiber per 10 g carbohydrate): ≥3 1‐oz equivalent servings/d; (4) sodium: <1500 mg/d; (5) sugar‐sweetened beverages: ≤450 kcal/wk | |||
| Physical activity | ≥150 min/wk moderate or ≥75 min/wk vigorous intensity or combination |
1–149 min/wk moderate+vigorous or 1–74 min/wk vigorous |
None |
| Smoking | Never or quit >12 mo ago | Former ≤12 mo | Current |
| BMIa | Less than or equal to maximum possible if top‐normal prepregnancy BMI and maximal recommended gestational weight gain (see Methods) | All others “nonideal” | |
| Blood pressureb | <120/<80 mm Hg untreated | SBP 120–139 mm Hg or DBP 80–89 mm Hg or treated to goal | SBP ≥140 mm Hg or DBP ≥90 mm Hg |
| Total cholesterol | <200 mg/dL untreated | 200–239 mg/dL or treated to goal | ≥240 mg/dL |
| Fasting plasma glucosea |
Month of pregnancy 1–5: <100 mg/dL untreated Month of pregnancy 6–9: <92 mg/dL untreated |
All others “nonideal” | |
| Metric | Nonpregnant Women | ||
|---|---|---|---|
| Ideal | Intermediate | Poor | |
| Diet | 4–5 Components | 2–3 Components | 0–1 Component |
| Diet components: (1) fruits and vegetables: ≥4.5 cups/d; (2) fish: ≥2 3.5‐oz servings/wk; (3) whole grains (ie, ≥1.1 g fiber per 10 g carbohydrate): ≥3 1‐oz equivalent servings/d; (4) sodium: <1500 mg/d; (5) sugar‐sweetened beverages: ≤450 kcal/wk | |||
| Physical activity | ≥150 min/wk moderate or ≥75 min/wk vigorous intensity or combination |
1–149 min/wk moderate+vigorous or 1–74 min/wk vigorous |
None |
| Smoking | Never or quit >12 mo ago | Former ≤12 mo | Current |
| BMIa | <25 kg/m2 | All others “nonideal” | |
| Blood pressureb | <120/<80 mm Hg untreated | SBP 120–139 mm Hg or DBP 80–89 mm Hg or treated to goal | SBP ≥140 mm Hg or DBP ≥90 mm Hg |
| Total cholesterol | <200 mg/dL untreated | 200–239 mg/dL or treated to goal | ≥240 mg/dL |
| Fasting plasma glucosea | <100 mg/dL untreated | All others “nonideal” | |
BMI indicates body mass index; CVH, cardiovascular health; DBP, diastolic blood pressure; SBP, systolic blood pressure.
Different from American Heart Association CVH metric definitions for nonpregnant adults. See text (Methods) for details.
Primary definition shown. In a sensitivity analysis, blood pressure was categorized as intermediate if SBP 120 to 129 mm Hg and DBP <80 mm Hg or treated to goal and as poor if SBP ≥130 mm Hg or DBP ≥80 mm Hg, per recent American Heart Association/American College of Cardiology blood pressure guidelines for nonpregnant adults.
We calculated total CVH scores by assigning 2 points for each ideal metric, 1 point for intermediate, and 0 points for poor or nonideal. We summed points across the 7 metrics for a range of total CVH scores of 0 to 14 and classified CVH scores of 12 to 14 as high, 8 to 11 as moderate, and 0 to 7 as low CVH.24 In sensitivity analyses, we excluded the cholesterol metric (given uncertainty about ideal levels during pregnancy) to create total CVH scores ranging from 0 to 12 and classified CVH scores of 10 to 12 as high, 6 to 9 as moderate, and 0 to 5 as low CVH.
Statistical Analysis
We used survey procedures in SAS, version 9.3 (SAS Institute, Cary, NC), to account for the complex NHANES design; and we applied survey weights to generate US population‐level estimates. Estimates were calculated from pooled data across all NHANES cycles (1999–2014), except trimester‐specific estimates and estimates for BMI, glucose, and total CVH were calculated from 1999 to 2012 data (month of pregnancy was unavailable in 2013–2014). In primary analyses, we calculated estimates according to pregnancy status (pregnant versus nonpregnant) and trimester. In secondary analyses, we calculated estimates for pregnant women according to age category and race/ethnicity.
We calculated the proportions of women (by pregnancy status, trimester, age category, and race/ethnicity) with ideal, intermediate, and poor (or nonideal) levels of each CVH metric and with high, moderate, or low total CVH scores. We also calculated the proportion of women attaining each of the 5 healthy diet components. We used polytomous logistic regression to compare the distributions of proportions across strata, after adjustment for demographic characteristics that were found to differ significantly across strata using χ2 tests. Comparisons across pregnancy strata were thus adjusted for continuous age and race/ethnicity; comparisons across race/ethnicity strata were adjusted for age, education, and income; and comparisons across age strata were adjusted for race/ethnicity, education, and income. Comparisons across trimesters did not require adjustment and were performed using χ2 tests.
We also calculated mean values for numbers of ideal CVH behaviors, factors, and metrics, as well as total CVH scores and total CVH scores excluding cholesterol. We used linear regression to compare means across strata, again adjusting for demographic characteristics that differed significantly across strata. We also calculated the proportions of pregnant and nonpregnant women with each CVH point score from 0 to 14 for illustration; statistical comparison of these distributions was not performed because of sample size limitations (N=0 for some cells).
For all analyses, we tested hypotheses using an α level of 0.05 based on a 2‐tailed test, with no adjustment for multiple comparisons. Because this increased the potential for type 1 error, and because smaller sample sizes in some subgroups increased the potential for type 2 error, we considered secondary analyses (stratified by age group and race/ethnicity) to be exploratory.
Results
Analytic Sample
A total of 1117 pregnant and 8200 nonpregnant women, aged 20 to 44 years, participated in an NHANES examination from 1999 to 2014 and were eligible for inclusion. Sample sizes and demographics of pregnant participants varied between cycles according to sampling strategy (eg, intentional oversampling of pregnant women in 1999–2006 and of non‐Hispanic Asians in 2011–2014; Table 2).
Table 2.
Sample Sizes, Characteristics, and Missingness of Data Among Pregnant Women, by Survey Cycle: NHANES, 1999 to 2014
| Variable | Survey Cycle | |||||||
|---|---|---|---|---|---|---|---|---|
| 1999–2000 | 2001–2002 | 2003–2004 | 2005–2006 | 2007–2008 | 2009–2010 | 2011–2012 | 2013–2014 | |
| N | 218 | 233 | 187 | 289 | 46 | 46 | 38 | 60 |
| Demographic characteristics | ||||||||
| Age, y | 27.5 (4.9) | 27.8 (5.1) | 28.4 (5.0) | 27.3 (4.6) | 26.9 (5.1) | 29.2 (6.8) | 29.4 (6.1) | 27.2 (5.6) |
| Race/ethnicity | ||||||||
| White (non‐Hispanic) | 101 (46.3) | 116 (49.8) | 96 (51.3) | 136 (47.1) | 9 (19.6) | 16 (34.8) | 11 (28.9) | 21 (35.0) |
| Black (non‐Hispanic) | 19 (8.7) | 25 (10.7) | 30 (16.0) | 34 (11.8) | 8 (17.4) | 5 (10.9) | 10 (26.3) | 17 (28.3) |
| Mexican | 65 (29.8) | 59 (25.3) | 47 (25.1) | 93 (32.2) | 19 (41.3) | 14 (30.4) | 5 (13.2) | 4 (6.7) |
| Other Hispanic | 18 (8.3) | 14 (6.0) | 5 (2.7) | 12 (4.2) | 7 (15.2) | 3 (6.5) | 4 (10.5) | 7 (11.7) |
| Non‐Hispanic Asian | ··· | ··· | ··· | ··· | ··· | ··· | 7 (18.4) | 7 (11.7) |
| Other race | 15 (6.9) | 19 (8.2) | 9 (4.8) | 14 (4.8) | 3 (6.5) | 8 (17.4) | 1 (2.6) | 4 (6.7) |
| Education | ||||||||
| Less than high school | 58 (28.4) | 60 (26.8) | 48 (26.1) | 80 (29.0) | 18 (39.1) | 11 (23.9) | 6 (16.7) | 9 (15.3) |
| High school graduate | 42 (20.6) | 44 (19.6) | 41 (22.3) | 55 (19.9) | 9 (19.6) | 9 (19.6) | 7 (19.4) | 15 (25.4) |
| Greater than high school | 104 (51.0) | 120 (53.6) | 95 (51.6) | 141 (51.1) | 19 (41.3) | 26 (56.5) | 23 (63.9) | 35 (59.3) |
| Family income/poverty ratio | ||||||||
| ≤1.30 | 52 (28.0) | 65 (29.1) | 62 (33.5) | 91 (33.1) | 15 (37.5) | 14 (36.8) | 10 (27.0) | 26 (46.4) |
| 1.30–≤1.85 | 22 (11.8) | 27 (12.1) | 23 (12.4) | 34 (12.4) | 7 (17.5) | 7 (18.4) | 6 (16.2) | 7 (12.5) |
| >1.85 | 112 (60.2) | 131 (58.7) | 100 (54.1) | 150 (54.5) | 18 (45.0) | 17 (44.7) | 21 (56.8) | 23 (41.1) |
| No. (proportion) with missing data | ||||||||
| Diet | 7 (3.2) | 2 (0.9) | 5 (2.7) | 5 (1.7) | 1 (2.2) | 0 | 2 (5.3) | 3 (5.0) |
| Physical activity | 0 | 0 | 0 | 0 | 0 | 0 | 0 | 0 |
| Smoking status | 0 | 0 | 0 | 0 | 0 | 0 | 0 | 0 |
| BMI | 0 | 1 (0.4) | 1 (0.5) | 1 (0.3) | 0 | 0 | 0 | ···a |
| Blood pressure | 18 (8.3) | 12 (5.2) | 20 (10.7) | 14 (4.8) | 0 | 1 (2.2) | 5 (13.2) | 10 (16.7) |
| Total cholesterol | 14 (6.4) | 11 (4.7) | 15 (8.0) | 14 (4.8) | 5 (10.9) | 4 (8.7) | 3 (7.9) | 4 (6.7) |
| Fasting plasma glucose | 130 (59.6) | 136 (58.4) | 109 (58.3) | 158 (54.7) | 30 (65.2) | 28 (60.9) | 21 (55.3) | ···a |
| Missing despite morning examinationb | 17 (16.2) | 21 (17.8) | 14 (15.2) | 19 (12.7) | 4 (20.0) | 3 (14.3) | 2 (10.5) | ···a |
| Any CVH metric | 138 (63.3) | 141 (60.5) | 120 (64.2) | 167 (57.8) | 31 (67.4) | 28 (60.9) | 26 (68.4) | ···a |
| Missing despite morning examinationb | 25 (23.8) | 26 (22.0) | 25 (27.2) | 28 (18.7) | 5 (25.0) | 3 (14.3) | 7 (36.8) | ···a |
Data shown are for the sample (ie, survey weights not used). Mean (SD) is shown for continuous variables, and number (proportion) is shown for categorical variables. BMI and fasting plasma glucose data were only assessed in participants during survey years 1999 to 2012, as month of pregnancy information (needed for their assessment) was not available in 2013 to 2014. BMI indicates body mass index; CVH, cardiovascular health; NHANES, National Health and Nutrition Examination Survey.
BMI and fasting plasma glucose were measured in 2013 to 2014, but they are not used in the present analyses because month of pregnancy was not reported in 2013 to 2014 and is needed for classification of those metrics.
Only morning examination participants were eligible for fasting plasma glucose measurement; morning examination samples are designed with separate weights to be nationally representative. The number (proportion) listed herein indicate the number missing the measurement despite attending a morning examination and thus being eligible for all measurements.
Among pregnant participants, missingness was rare for CVH behaviors (0%–5.3% across NHANES cycles for diet and 0% for physical activity and smoking) but was more common for some CVH factors (0%–0.5% for BMI, 0%–16.7% for blood pressure, 4.7%–10.9% for total cholesterol, and 10.5%–20.0% among morning examinees for fasting glucose; see Table 2). Compared with the 406 pregnant participants from 1999 to 2012 with complete data for all CVH metrics, the 119 with any missing CVH metric despite a morning examination tended to be slightly older (mean [SD] age, 28.7 [5.2] versus 27.5 [4.9] years), were less often Mexican (19% versus 32%), were more often non‐Hispanic white (59% versus 44%), and more often had a higher income/poverty level ratio (>1.85 in 69% versus 54%); there were no significant differences in education level (data not shown).
Individual CVH Metrics
The distributions of ideal, intermediate, and poor or nonideal levels of individual CVH metrics among pregnant women overall are shown in Figure 1 and Table 3. Across CVH behaviors, the population prevalence of ideal levels varied from 0.1% (95% CI, 0%–0.3%) for diet and 27.3% (95% CI, 22.2%–32.3%) for physical activity, to 77.7% (95% CI, 73.3%–82.2%) for smoking. Among the 5 dietary components, attainment of healthy levels was lowest for limited sodium (<1500 mg/d in 2.1%) and adequate whole grains (≥3 1‐oz equivalent servings/day in 4.6%) and highest for limited sugar‐sweetened beverages (≤450 kcal/wk in 38.7%; Figure 2A). For CVH factors, the prevalence of ideal levels varied from 38.9% (95% CI, 33.7%–44.0%) for total cholesterol and 51.1% (95% CI, 46.0%–56.2%) for BMI to 90.4% (95% CI, 87.5%–93.3%) for blood pressure and 91.6% (95% CI, 88.3%–94.9%) for fasting glucose.
Figure 1.
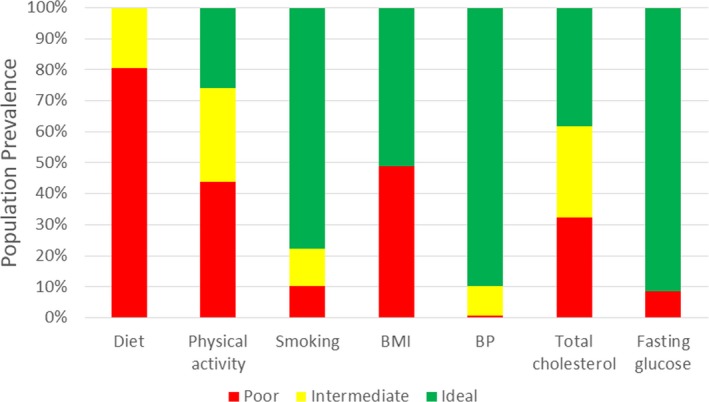
Status of individual cardiovascular health metrics among pregnant women, aged 20 to 44 years, in the United States, 1999 to 2014*. All estimates are based on population‐weighted data from the National Health and Nutrition Examination Survey. *Body mass index (BMI) and fasting plasma glucose data are for 1999 to 2012, as month of pregnancy information was not available in 2013 to 2014. BP indicates blood pressure.
Table 3.
Demographic Characteristics and CVH Among Women, Aged 20 to 44 Years, in the United States, by Pregnancy Status, 1999 to 2014
| Variable | Pregnancy Status | P Value for Comparison | |
|---|---|---|---|
| Pregnant | Not Pregnant | ||
| Population % Prevalence (95% CI) of Demographic Characteristics | |||
| Demographic characteristics | |||
| Age group, sample N | 1117 | 8200 | |
| 20–24 y | 28.4 (24.3–32.5) | 20.2 (18.7–21.7) | <0.0001 |
| 25–34 y | 55.9 (51.3–60.5) | 37.5 (36.0–39.0) | |
| 35–44 y | 15.7 (11.8–19.6) | 42.3 (40.7–44.0) | |
| Race/ethnicity, sample N | 1117 | 8200 | |
| White (non‐Hispanic) | 55.2 (49.7–60.6) | 62.0 (60.2–65.4) | <0.0001 |
| Black (non‐Hispanic) | 13.7 (10.5–16.9) | 14.0 (11.9–14.8) | |
| Mexican | 14.3 (11.5–17.0) | 10.0 (8.6–11.3) | |
| Other Hispanic | 5.8 (3.6–7.9) | 8.0 (5.6–8.4) | |
| Other race | 11.1 (7.7–14.6) | 7.3 (6.1–7.7) | |
| Education, sample N | 1075 | 7877 | |
| Less than high school | 18.6 (15.9–21.4) | 17.3 (16.1–18.6) | 0.10 |
| High school graduate | 19.1 (15.4–22.8) | 23.0 (21.4–24.5) | |
| Greater than high school | 62.3 (58.2–66.5) | 59.7 (57.6–61.7) | |
| Family income/poverty ratio, sample Na | 1040 | 7635 | |
| ≤1.30 | 23.9 (20.1–27.7) | 27.1 (25.5–28.7) | 0.33 |
| 1.30–≤1.85 | 12.7 (9.4–16.0) | 11.5 (10.7–12.4) | |
| >1.85 | 63.4 (58.4–68.4) | 61.4 (59.6–63.1) | |
| Variable | Pregnancy Status | P Value for Adjusted Comparisonb | |
|---|---|---|---|
| Pregnant | Not Pregnant | ||
| Population % Prevalence (95% CI) of CVH Status | |||
| Individual CVH metrics | |||
| Diet, sample N | 1092 | 7618 | |
| Ideal | 0.1 (0.0–0.3) | 0.4 (0.3–0.6) | 0.28 |
| Intermediate | 19.4 (15.5–23.3) | 20.2 (19.0–21.5) | |
| Poor | 80.5 (76.6–84.4) | 79.3 (78.0–80.6) | |
| Physical activity, sample N | 1117 | 8200 | |
| Ideal | 27.3 (22.2–32.3) | 40.1 (38.4–41.8) | <0.0001 |
| Intermediate | 27.9 (23.1–32.8) | 23.1 (21.9–24.4) | |
| Poor | 44.8 (39.5–50.0) | 36.8 (35.3–38.2) | |
| Smoking status, sample N | 1117 | 8195 | |
| Ideal | 77.7 (73.3–82.2) | 73.1 (71.7–74.6) | <0.0001 |
| Intermediate | 12.4 (8.6–16.1) | 2.4 (2.0–2.9) | |
| Poor | 9.9 (6.9–12.9) | 24.4 (23.1–25.8) | |
| BMI, sample N | 1054 | 6917 | |
| Ideal | 51.1 (46.0–56.2) | 43.3 (41.4–45.1) | 0.06 |
| Nonideal | 48.9 (43.8–54.0) | 56.7 (54.9–58.6) | |
| Blood pressure, sample N | 1037 | 5466 | |
| Ideal | 90.4 (87.5–93.3) | 74.1 (72.7–75.5) | <0.0001 |
| Intermediate | 9.0 (6.1–11.9) | 22.3 (21.0–23.6) | |
| Poor | 0.6 (0.03–1.2) | 3.6 (3.1–4.1) | |
| Total cholesterol, sample N | 1047 | 7688 | |
| Ideal | 38.9 (33.7–44.0) | 67.2 (66.0–68.5) | <0.0001 |
| Intermediate | 29.9 (25.6–34.1) | 24.7 (23.5–25.9) | |
| Poor | 31.3 (26.4–36.2) | 8.1 (7.3–8.8) | |
| Fasting plasma glucose, sample N | 445 | 2948 | |
| Ideal | 91.6 (88.3–94.9) | 81.7 (79.9–83.5) | 0.007 |
| Nonideal | 8.4 (5.1–11.7) | 18.3 (16.5–20.1) | |
| Composite CVH | |||
| No. of ideal CVH behaviors, mean (95% CI) | 1.0 (0.9–1.1) | 1.2 (1.1–1.2) | 0.0003 |
| No. of ideal CVH factors, mean (95% CI) | 2.7 (2.5–2.9) | 2.7 (2.6–2.7) | 0.05 |
| Total No. of ideal CVH metrics, mean (95% CI) | 3.7 (3.4–3.9) | 3.8 (3.8–3.9) | 0.0005 |
| Total CVH score, mean (95% CI) | 8.3 (8.0–8.7) | 8.6 (8.5–8.7) | 0.004 |
| Total CVH category prevalence (95% CI), sample N | 406 | 2563 | |
| High (CVH score 12–14) | 4.6 (0.5–8.8) | 13.0 (11.0–15.0) | 0.01 |
| Moderate (CVH score 8–11) | 60.6 (52.3–68.9) | 55.8 (53.4–58.2) | |
| Low (CVH score 0–7) | 34.8 (26.4–43.2) | 31.2 (28.7–33.7) | |
| Total CVH score, excluding cholesterol, mean (95% CI) | 7.3 (6.9–7.6) | 7.0 (6.9–7.1) | 0.98 |
| Total CVH category, excluding cholesterol, prevalence (95% CI), sample N | 408 | 2589 | |
| High (CVH score 10–12) | 8.5 (3.9–13.1) | 16.2 (14.2–18.2) | 0.001 |
| Moderate (CVH score 6–9) | 78.2 (71.3–85.2) | 59.3 (57.2–61.3) | |
| Low (CVH score 0–5) | 13.2 (7.5–18.9) | 24.6 (22.5–26.6) | |
All estimates are based on population‐weighted data from the National Health and Nutrition Examination Survey. BMI and fasting plasma glucose data are for 1999 to 2012, as month of pregnancy information was not available in 2013 to 2014. BMI indicates body mass index; CVH, indicates cardiovascular health.
For 1999 to 2006, calculated on the basis of annual income (INDFMPIR); for 2007 to 2014, calculated on the basis of monthly income (INDFMMPI).
After adjustment for age and race/ethnicity.
Figure 2.
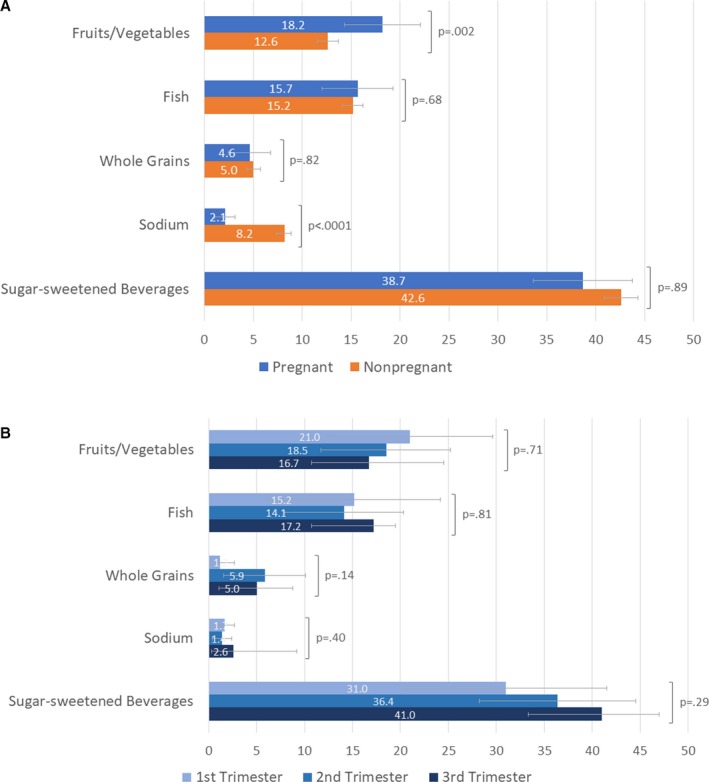
Prevalence of attaining individual healthy diet components among women, aged 20 to 44 years, in the United States, by A. pregnancy status and B. trimester, 1999 to 2014*. All estimates are based on population‐weighted data from the National Health and Nutrition Examination Survey. Error bars show 95% CIs. P values for comparisons between pregnant and nonpregnant women were calculated after adjustment for age and race/ethnicity. Attainment of healthy diet components for pregnant women was defined as follows: (1) fruits and vegetables: ≥4.5 cups/day; (2) fish: two to three 3.5‐oz servings/week; (3) whole grains (ie, ≥1.1 g fiber per 10 g carbohydrate): ≥3 1‐oz equivalent servings/day; (4) sodium: <1500 mg/d; (5) sugar‐sweetened beverages: ≤450 kcal/wk. See Methods text for details. *Trimester‐specific data are for 1999 to 2012, as month of pregnancy information was not available in 2013 to 2014.
Compared with nonpregnant women, pregnant women tended to be younger and more often nonwhite, but there were no significant differences in education or income categories (Table 3). Pregnant (versus nonpregnant) women had less favorable levels for physical activity and total cholesterol, even after adjustment for age and race/ethnicity (Table 3). Conversely, pregnant (versus nonpregnant) women had more favorable levels for smoking, blood pressure, and fasting glucose, even after adjustment. The distribution of diet levels overall did not differ significantly by pregnancy status (Table 3), but pregnant women more frequently consumed adequate fruits and vegetables and less frequently limited sodium compared with pregnant women (Figure 2A). The distribution of ideal versus nonideal BMI levels did not differ significantly by pregnancy status.
In trimester‐specific analyses of pregnant women, the distribution of total cholesterol levels varied significantly across trimesters; the proportion of pregnant women with ideal levels was 80.7% (95% CI, 73.0%–88.3%) in the first trimester but 33.8% (95% CI, 24.4%–43.2%) and 15.5% (95% CI, 9.4%–21.6%) in the second and third trimesters, respectively (P<0.0001; Table 4). There were no statistically significant differences across trimesters for any of the other CVH metrics (Table 4), nor for any of the 5 dietary components (Figure 2B).
Table 4.
Demographic Characteristics and CVH Among Pregnant Women, Aged 20 to 44 Years, in the United States, by Trimester of Pregnancy, 1999 to 2012
| Variable | Population % Prevalence (95% CI) | P Value for Comparison | ||
|---|---|---|---|---|
| First Trimester | Second Trimester | Third Trimester | ||
| Demographic characteristics | ||||
| Age group, sample N | 210 | 433 | 414 | |
| 20–24 y | 26.7 (18.9–34.6) | 30.5 (23.6–37.4) | 23.1 (16.9–29.4) | 0.26 |
| 25–34 y | 61.3 (51.9–70.6) | 55.3 (47.1–63.4) | 55.6 (47.3–63.9) | |
| 35–44 y | 12.0 (4.5–19.5) | 14.3 (8.5–20.0) | 21.3 (13.2–29.3) | |
| Race/ethnicity, sample N | 210 | 433 | 414 | |
| White (non‐Hispanic) | 60.0 (49.4–70.6) | 53.3 (45.4–61.1) | 54.6 (46.3–63.0) | 0.53 |
| Black (non‐Hispanic) | 11.4 (6.6–16.3) | 15.1 (10.2–20.1) | 10.9 (6.0–15.8) | |
| Mexican | 16.1 (10.8–21.3) | 14.8 (10.7–19.0) | 15.3 (11.1–19.5) | |
| Other Hispanic | 4.7 (1.8–7.6) | 3.9 (1.9–5.9) | 7.6 (2.9–12.3) | |
| Other race | 7.8 (2.2–13.3) | 12.8 (7.5–18.1) | 11.5 (4.6–18.5) | |
| Education, sample N | 201 | 419 | 396 | |
| Less than high school | 18.1 (11.3–25.0) | 20.5 (15.4–25.6) | 19.9 (14.0–25.8) | 0.34 |
| High school graduate | 18.0 (10.4–25.7) | 22.4 (15.4–29.3) | 14.0 (9.3–18.8) | |
| Greater than high school | 63.8 (54.2–73.5) | 57.2 (50.0–64.3) | 66.0 (59.1–73.0) | |
| Family income/poverty ratio, sample Na | 195 | 399 | 390 | |
| ≤1.30 | 22.6 (16.1–29.1) | 25.9 (19.6–32.1) | 17.2 (12.5–21.9) | 0.19 |
| 1.30–≤1.85 | 15.8 (7.7–23.9) | 10.5 (6.5–14.6) | 12.5 (7.1–17.9) | |
| >1.85 | 61.6 (51.1–72.0) | 63.6 (56.8–70.4) | 70.4 (63.5–77.3) | |
| CVH metrics | ||||
| Diet, sample N | 207 | 421 | 407 | |
| Ideal | 0 | 0 | 0 | 0.76 |
| Intermediate | 16.7 (8.4–25.1) | 19.8 (12.3–27.3) | 21.0 (14.3–27.7) | |
| Poor | 83.3 (74.9–91.6) | 80.2 (72.7–87.7) | 79.0 (72.3–85.7) | |
| Physical activity, sample N | 210 | 433 | 414 | |
| Ideal | 32.4 (21.5–43.3) | 23.8 (16.5–31.2) | 24.0 (16.3–31.7) | 0.30 |
| Intermediate | 31.6 (20.4–42.7) | 26.8 (19.1–34.5) | 32.5 (25.2–39.8) | |
| Poor | 36.1 (24.9–47.2) | 49.4 (40.4–58.3) | 43.5 (35.7–51.4) | |
| Smoking status, sample N | 210 | 433 | 414 | |
| Ideal | 69.9 (59.1–80.7) | 78.2 (72.3–84.0) | 82.2 (76.5–87.9) | 0.08 |
| Intermediate | 13.8 (5.8–21.7) | 12.7 (7.3–18.1) | 10.7 (5.7–15.7) | |
| Poor | 16.3 (9.4–23.3) | 9.1 (4.9–13.4) | 7.1 (3.4–10.9) | |
| BMI, sample N | 210 | 431 | 413 | |
| Ideal | 42.8 (32.5–53.2) | 53.4 (45.5–61.3) | 54.3 (46.8–61.8) | 0.15 |
| Nonideal | 57.2 (46.8–67.5) | 46.6 (38.7–54.5) | 45.7 (38.2–53.2) | |
| Blood pressure, sample N | 199 | 404 | 384 | |
| Ideal | 92.0 (88.2–95.8) | 91.2 (86.9–95.4) | 86.6 (80.0–93.3) | 0.16 |
| Intermediate | 7.2 (3.6–10.8) | 7.8 (3.5–12.0) | 13.1 (6.4–19.8) | |
| Poor | 0.8 (0–2.0) | 1.1 (0.1–2.0) | 0.3 (0–0.6) | |
| Total cholesterol, sample N | 190 | 412 | 389 | |
| Ideal | 80.7 (73.0–88.3) | 33.8 (24.4–43.2) | 15.5 (9.4–21.6) | <0.0001 |
| Intermediate | 16.1 (9.3–22.9) | 39.3 (31.1–47.4) | 28.4 (21.0–35.8) | |
| Poor | 3.2 (0–6.9) | 26.9 (20.1–33.7) | 56.1 (47.6–64.6) | |
| Fasting plasma glucose, sample N | 92 | 177 | 176 | |
| Ideal | 96.2 (92.9–99.5) | 88.0 (82.7–93.3) | 92.2 (85.8–98.5) | 0.13 |
| Nonideal | 3.8 (0.5–7.1) | 12.0 (6.7–17.3) | 7.8 (1.5–14.2) | |
| No. of ideal CVH behaviors, mean (95% CI) | 0.9 (0.7–1.0) | 1.0 (0.8–1.1) | 1.0 (0.9–1.2) | 0.02 |
| No. of ideal CVH factors, mean (95% CI) | 3.2 (3.0–3.4) | 2.7 (2.4–2.9) | 2.4 (2.2–2.5) | <0.0001 |
| Total No. of ideal CVH metrics, mean (95% CI) | 4.0 (3.8–4.3) | 3.7 (3.2–4.1) | 3.4 (3.2–3.5) | <0.0001 |
| Total CVH score, mean (95% CI) | 9.0 (8.5–9.5) | 8.4 (7.7–9.1) | 7.8 (7.5–8.2) | 0.0004 |
| Total CVH category, prevalence (95% CI), sample N | 82 | 162 | 162 | |
| High (CVH score 12–14) | 4.4 (2.4–6.5) | 8.6 (0–18.4) | 0.3 (0–0.8) | <0.0001 |
| Moderate (CVH score 8–11) | 79.4 (70.5–88.3) | 49.9 (37.4–62.5) | 58.7 (46.5–70.9) | |
| Low (CVH score 0–7) | 16.1 (8.1–24.2) | 41.4 (28.4–54.4) | 41.0 (28.8–53.2) | |
| Total CVH score, excluding cholesterol, mean (95% CI) | 7.1 (6.6–7.6) | 7.4 (6.9–8.0) | 7.2 (6.9–7.5) | 0.06 |
| Total CVH category, excluding cholesterol, prevalence (95% CI), sample N | 83 | 163 | 162 | |
| High (CVH score 10–12) | 6.4 (3.8–9.1) | 15.0 (4.8–25.2) | 2.9 (1.2–4.6) | 0.0009 |
| Moderate (CVH score 6–9) | 79.6 (71.0–88.3) | 68.9 (57.6–80.3) | 87.6 (80.4–94.9) | |
| Low (CVH score 0–5) | 13.9 (6.5–21.4) | 16.1 (7.2–25.0) | 9.4 (2.8–16.1) | |
All estimates, including characteristics, are based on population‐weighted data from the National Health and Nutrition Examination Survey. Trimester‐specific data and overall BMI and fasting plasma glucose require month of pregnancy information, which was not available in 2013 to 2014. BMI indicates body mass index; CVH, cardiovascular health.
For 1999 to 2006, calculated on the basis of annual income (INDFMPIR); for 2007 to 2014, calculated on the basis of monthly income (INDFMMPI).
Composite CVH
Composite CVH indicators among pregnant women overall are shown in Table 3 and Figure 3. The mean number of ideal CVH behaviors achieved by pregnant women was 1.0 (95% CI, 0.9–1.1; of 3: diet, physical activity, and smoking), and the mean number of ideal CVH factors was 2.7 (95% CI, 2.5–2.9; of 4: BMI, blood pressure, total cholesterol, and fasting glucose; Table 3). The mean total CVH score was 8.3 (95% CI, 8.0–8.7) of 14 (Table 3 and Figure 3). High CVH (score 12–14) was least frequent at 4.6% (95% CI, 0.5%–8.8%), whereas moderate CVH (score 8–11) was most frequent at 60.6% (95% CI, 52.3%–68.9%) and low CVH (score 0–7) was present in 34.8% (95% CI, 26.4%–43.2%). In sensitivity analyses excluding the cholesterol metric, high CVH remained least frequent at 8.5% (95% CI, 3.9%–13.1%), moderate CVH remained most frequent at 78.2% (95% CI, 71.3%–85.2%), and low CVH was present in 13.2% (95% CI, 7.5%–18.9%; Table 3 and Figure 3).
Figure 3.
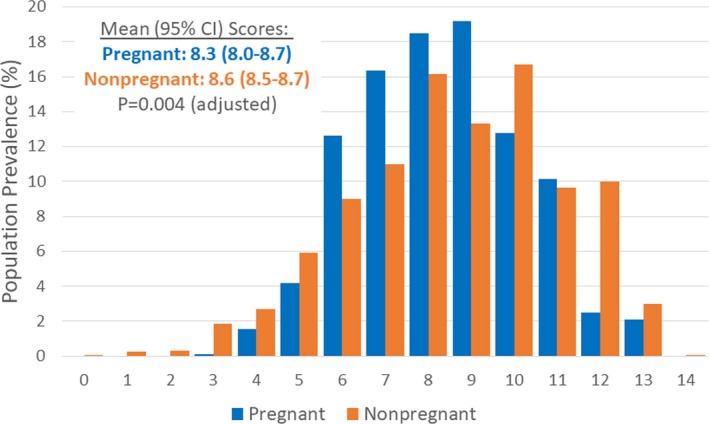
Cardiovascular health scores among women, aged 20 to 44 years, in the United States, by pregnancy status, 1999 to 2012. All estimates are based on population‐weighted data from the National Health and Nutrition Examination Survey. Total sample sizes were 406 for pregnant women and 2563 for nonpregnant women. Comparison of mean scores by pregnancy status was adjusted for age and race/ethnicity.
Compared with nonpregnant women, the distribution of CVH scores was overall lower among pregnant women (Figure 3 and Table 3). Pregnant (versus nonpregnant) women had lower mean numbers of ideal CVH behaviors, a lower mean total CVH score, and a lower prevalence of high CVH, even after adjustment for age and race/ethnicity. However, in sensitivity analyses excluding the cholesterol metric, there was no significant difference in mean CVH scores by pregnancy status; and pregnant women less frequently had both high CVH (8.5% [95% CI, 3.9%–13.1%] versus 16.2% [95% CI, 14.2%–18.2%]) and low CVH (13.2% [95% CI, 7.5%–18.9%] versus 24.6% [95% CI, 22.5%–26.6%]), but more frequently had moderate CVH, compared with nonpregnant women (P=0.001 after adjustment; Table 3).
Across trimesters of pregnancy, the mean total number of ideal CVH metrics and total CVH score were lower in later trimesters, driven by fewer ideal CVH factors (but not behaviors; Table 4). The distribution of total CVH categories was also less favorable in later trimesters, with a much lower prevalence of low CVH in the first trimester compared with the second and third trimesters. However, in sensitivity analyses excluding the cholesterol metric, total CVH was most favorable during the second trimester. For example, the prevalence of high CVH was 6.4% (95% CI, 3.8%–9.1%) in the first trimester, 15.0% (95% CI, 4.8%–25.2%) in the second trimester, and 2.9% (95% CI, 1.2%–4.6%) in the third trimester (P=0.0009; Table 4).
Secondary Analyses by Age and Race/Ethnicity Among Pregnant Women
In secondary analyses, there were statistically significant differences between age strata of pregnant women in the distribution of levels for diet, smoking, blood pressure, and total cholesterol (Table 5). Diet and smoking status were generally more favorable in older age strata, even after adjustment for race/ethnicity, education, and income. Conversely, for blood pressure and total cholesterol, poor levels were most frequent in older pregnant women, and ideal levels were most frequent in the middle‐age stratum. There were no statistically significant differences by age strata for the status of physical activity, BMI, or fasting glucose. Total CVH was more favorable in older age strata; for example, mean (95% CI) total CVH scores were 7.8 (7.5–8.1) for age 20 to 24 years, 8.6 (8.0–9.1) for age 25 to 34 years, and 8.7 (7.8–9.5) for age 35 to 44 years (P=0.02 after adjustment; Table 5). In sensitivity analyses excluding the cholesterol metric, these age‐related differences in total CVH persisted.
Table 5.
Demographic Characteristics and CVH Among Pregnant Women, Aged 20 to 44 Years, in the United States, by Age Group, 1999 to 2014
| Variable | Age Group, y | P Value for Comparison | ||
|---|---|---|---|---|
| 20–24 | 25–34 | 35–44 | ||
| Population % Prevalence (95% CI) of Demographic Characteristics | ||||
| Race/ethnicity, sample N | 350 | 640 | 127 | |
| White (non‐Hispanic) | 45.3 (36.9–53.6) | 58.3 (51.7–64.8) | 62.0 (49.9–74.1) | <0.0001 |
| Black (non‐Hispanic) | 25.1 (18.0–32.2) | 9.9 (6.9–13.0) | 6.2 (1.5–10.8) | |
| Mexican | 17.8 (12.9–22.8) | 13.2 (10.2–16.2) | 11.7 (6.6–16.8) | |
| Other Hispanic | 5.5 (2.7–8.2) | 5.7 (3.1–8.4) | 6.5 (0–13.7) | |
| Other race | 6.3 (2.2–10.4) | 12.9 (8.0–17.8) | 13.6 (5.6–21.6) | |
| Education, sample N | 329 | 625 | 121 | |
| Less than high school | 28.6 (22.2–35.0) | 14.5 (11.2–17.7) | 15.9 (7.3–24.5) | <0.0001 |
| High school graduate | 29.4 (23.6–35.2) | 16.1 (11.4–20.8) | 11.0 (3.0–19.0) | |
| Greater than high school | 42.0 (35.1–48.9) | 69.4 (64.2–74.7) | 73.1 (61.5–84.6) | |
| Family income/poverty ratio, sample Na | 319 | 605 | 116 | |
| ≤1.30 | 44.0 (35.3–52.8) | 16.9 (12.9–20.8) | 12.7 (6.5–18.9) | <0.0001 |
| 1.30–≤1.85 | 15.4 (9.4–21.5) | 12.4 (7.9–16.9) | 8.9 (4.8–13.0) | |
| >1.85 | 40.5 (31.8–49.3) | 70.8 (64.7–76.8) | 78.5 (70.4–86.5) | |
| Variable | Age Group, y | P Value for Adjusted Comparisonb | ||
|---|---|---|---|---|
| 20–24 | 25–34 | 35–44 | ||
| Population % Prevalence (95% CI) of CVH Status | ||||
| Diet, sample N | 338 | 631 | 123 | |
| Ideal | 0 | 0.2 (0–0.5) | 0 | <0.0001 |
| Intermediate | 6.2 (2.8–9.7) | 20.9 (15.2–26.7) | 37.6 (24.8–50.4) | |
| Poor | 93.8 (90.3–97.2) | 78.9 (73.2–84.6) | 62.4 (49.6–75.2) | |
| Diet componentsc | ||||
| Adequate fruits and vegetables | 10.6 (5.8–15.4) | 19.2 (14.2–24.1) | 28.4 (16.7–40.1) | 0.14 |
| Adequate fish | 10.8 (6.3–15.3) | 14.4 (9.6–19.1) | 29.0 (15.5–42.5) | 0.09 |
| Adequate whole grains | 2.3 (0–5.3) | 6.0 (2.7–9.4) | 3.8 (0–8.4) | 0.004 |
| Limited sodium | 1.5 (0–3.3) | 2.5 (1.0–4.0) | 1.7 (0–3.3) | 0.37 |
| Limited sugar‐sweetened beverages | 25.4 (18.3–32.4) | 39.9 (33.1–46.7) | 58.4 (44.9–71.9) | 0.04 |
| Physical activity, sample N | 350 | 640 | 127 | |
| Ideal | 23.1 (16.1–30.0) | 29.5 (23.0–35.9) | 27.1 (15.7–38.6) | 0.87 |
| Intermediate | 23.9 (17.1–30.7) | 29.6 (23.7–35.5) | 29.1 (17.7–40.5) | |
| Poor | 53.0 (44.8–61.1) | 40.9 (34.5–47.3) | 43.7 (31.6–55.9) | |
| Smoking status, sample N | 350 | 640 | 109 | |
| Ideal | 63.3 (54.5–72.2) | 81.6 (76.5–86.7) | 89.8 (81.7–97.9) | 0.0003 |
| Intermediate | 20.0 (11.9–28.2) | 10.3 (6.3–14.2) | 5.9 (0–12.6) | |
| Poor | 16.6 (10.4–22.8) | 8.1 (5.1–11.2) | 4.3 (0–9.1) | |
| BMI, sample N | 322 | 611 | 121 | |
| Ideal | 53.1 (45.4–60.9) | 49.9 (44.0–55.8) | 52.0 (38.4–65.5) | 0.56 |
| Nonideal | 46.9 (39.1–54.6) | 50.1 (44.2–56.0) | 48.0 (34.5–61.6) | |
| Blood pressure, sample N | 324 | 598 | 115 | |
| Ideal | 86.6 (80.9–92.3) | 93.3 (90.3–96.3) | 87.0 (77.2–96.7) | 0.0005 |
| Intermediate | 13.2 (7.5–18.9) | 6.0 (2.8–9.2) | 11.7 (2.0–21.5) | |
| Poor | 0.2 (0–0.5) | 0.7 (0–1.5) | 1.3 (0.9–1.7) | |
| Total cholesterol, sample N | 324 | 604 | 119 | |
| Ideal | 37.6 (28.5–46.7) | 41.0 (34.5–47.6) | 33.5 (19.3–47.6) | 0.02 |
| Intermediate | 39.9 (31.9–47.8) | 28.5 (22.5–34.5) | 17.3 (7.4–27.1) | |
| Poor | 22.5 (15.2–29.9) | 30.5 (24.5–36.5) | 49.3 (36.3–62.3) | |
| Fasting plasma glucose, sample N | 137 | 256 | 52 | |
| Ideal | 88.2 (79.1–97.3) | 92.8 (87.0–98.6) | 91.0 (84.0–98.0) | 0.39 |
| Nonideal | 11.8 (2.7–20.9) | 7.2 (1.4–13.0) | 9.0 (2.0–16.0) | |
| No. of ideal CVH behaviors, mean (95% CI) | 0.7 (0.5–0.9) | 1.1 (0.9–1.2) | 1.2 (1.0–1.4) | 0.13 |
| No. of ideal CVH factors, mean (95% CI) | 2.7 (2.4–2.9) | 2.7 (2.5–2.9) | 2.7 (2.4–3.0) | 0.78 |
| Total No. of ideal CVH metrics, mean (95% CI) | 3.3 (3.0–3.5) | 3.8 (3.5–4.1) | 3.9 (3.3–4.4) | 0.0002 |
| Total CVH score, mean (SD) | 7.8 (7.5–8.1) | 8.6 (8.0–9.1) | 8.7 (7.8–9.5) | 0.02 |
| Total CVH category, prevalence (95% CI), sample N | 127 | 235 | 44 | |
| High (CVH score 12–14) | 0.1 (0–0.3) | 5.2 (0.1–10.2) | 13.0 (0–33.8) | 0.0002 |
| Moderate (CVH score 8–11) | 54.1 (43.7–64.5) | 62.5 (52.0–73.0) | 66.9 (45.3–88.6) | |
| Low (CVH score 0–7) | 45.8 (35.4–56.2) | 32.3 (22.3–42.4) | 20.1 (7.7–32.4) | |
| Total CVH score, excluding cholesterol, mean (95% CI) | 6.6 (6.3–6.9) | 7.5 (7.1–7.9) | 7.8 (7.2–8.4) | 0.01 |
| Total CVH category, excluding cholesterol, prevalence (95% CI), sample N | 127 | 237 | 44 | |
| High (CVH score 10–12) | 1.9 (0.6–3.3) | 10.2 (4.4–16.1) | 16.1 (0–36.6) | 0.004 |
| Moderate (CVH score 6–9) | 74.0 (65.6–82.5) | 80.1 (71.0–89.3) | 78.5 (57.3–99.6) | |
| Low (CVH score 0–5) | 24.1 (15.3–32.8) | 9.6 (1.9–17.3) | 5.5 (0–13.0) | |
All estimates are based on population‐weighted data from the National Health and Nutrition Examination Survey. BMI and fasting plasma glucose data are for 1999 to 2012, as month of pregnancy information was not available in 2013 to 2014. BMI indicates body mass index; CVH, cardiovascular health.
For 1999 to 2006, calculated on the basis of annual income (INDFMPIR); for 2007 to 2014, calculated on the basis of monthly income (INDFMMPI).
Comparisons of metric statuses between age groups are adjusted for race/ethnicity, income, and education; and comparisons of metric statuses between race/ethnicity groups are adjusted for continuous age, income, and education.
Attainment of healthy diet components was defined as follows: (1) fruits and vegetables: ≥4.5 cups/day; (2) fish: two to three 3.5‐oz servings/week; (3) whole grains (ie, ≥1.1 g fiber per 10 g carbohydrate): ≥3 1‐oz equivalent servings/day; (4) sodium: <1500 mg/d; (5) sugar‐sweetened beverages: ≤450 kcal/wk. See Methods text for details.
There were also statistically significant racial/ethnic differences in the distribution of levels for physical activity, smoking, BMI, and blood pressure among pregnant women (Table 6). Physical activity was most favorable among whites (and comparable between blacks and Mexicans), and smoking status was most favorable among Mexicans. BMI was most favorable among whites and least favorable among blacks, and blood pressure was also least favorable among blacks (and comparable between whites and Mexicans). There were no statistically significant differences in the distributions of levels for diet (despite some differences for individual dietary components), total cholesterol, or fasting glucose. CVH behaviors and factors and total CVH were all least favorable among blacks; for example, mean (95% CI) total CVH scores were 8.6 (8.1–9.1) for whites, 7.6 (6.8–8.3) for blacks, and 8.4 (8.1–8.7) for Mexicans (P=0.0002; Table 6). In sensitivity analyses excluding the cholesterol metric, these racial/ethnic differences in total CVH persisted.
Table 6.
Demographic Characteristics and CVH Among Pregnant Women, Aged 20 to 44 Years, in the United States, by Race/Ethnicity, 1999 to 2014a
| Variable | Race/Ethnicity | P Value for Comparison | ||
|---|---|---|---|---|
| White (Non‐Hispanic) | Black (Non‐Hispanic) | Mexican | ||
| Population % Prevalence (95% CI) of Demographic Characteristics | ||||
| Age group, sample N | 506 | 148 | 306 | |
| 20–24 y | 23.3 (17.9–28.8) | 52.2 (42.6–61.9) | 35.5 (28.7–42.2) | <0.0001 |
| 25–34 y | 59.0 (52.5–65.5) | 40.6 (31.8–49.5) | 51.6 (45.0–58.2) | |
| 35–44 y | 17.7 (12.0–23.3) | 7.1 (2.0–12.3) | 12.9 (8.4–17.4) | |
| Education, sample N | 497 | 145 | 280 | |
| Less than high school | 7.2 (3.7–10.7) | 23.8 (16.1–31.5) | 53.1 (44.8–61.3) | <0.0001 |
| High school graduate | 17.6 (11.8–23.3) | 24.6 (17.5–31.7) | 26.1 (18.3–34.0) | |
| Greater than high school | 75.3 (69.4–81.1) | 51.6 (42.8–60.4) | 20.8 (14.3–27.4) | |
| Family income/poverty ratioa, sample N* | 483 | 138 | 275 | |
| ≤1.30 | 11.0 (6.6–15.4) | 45.4 (36.0–54.9) | 54.0 (45.9–62.1) | <0.0001 |
| 1.30–≤1.85 | 8.9 (4.9–12.9) | 11.1 (4.7–17.5) | 23.5 (17.3–29.8) | |
| >1.85 | 80.1 (74.2–86.0) | 43.5 (32.9–54.0) | 22.5 (15.3–29.6) | |
| Variable | Race/Ethnicity | P Value for Adjusted Comparisonb | ||
|---|---|---|---|---|
| White (Non‐Hispanic) | Black (Non‐Hispanic) | Mexican | ||
| Population % Prevalence (95% CI) of CVH Metric Status | ||||
| Diet, sample N | 498 | 142 | 298 | |
| Ideal | 0 | 0 | 0 | 0.75 |
| Intermediate | 19.6 (13.4–25.9) | 13.5 (6.8–20.3) | 11.8 (6.5–17.1) | |
| Poor | 80.4 (74.1–86.6) | 86.5 (79.7–93.2) | 88.2 (82.9–93.5) | |
| Diet componentsc | ||||
| Adequate fruits and vegetables | 15.2 (10.0–20.3) | 13.2 (5.5–20.9) | 21.4 (15.2–27.6) | 0.008 |
| Adequate fish | 11.8 (6.6–17.0) | 22.5 (14.4–30.7) | 16.2 (10.5–21.8) | 0.001 |
| Adequate whole grains | 6.4 (2.6–10.2) | 1.4 (0–3.6) | 0.4 (0–0.8) | 0.02 |
| Limited sodium | 0.7 (0.2–1.1) | 3.1 (0–7.0) | 6.0 (1.6–10.5) | 0.0002 |
| Limited sugar‐sweetened beverages | 43.3 (35.7–51.0) | 22.9 (14.2–31.6) | 25.3 (18.8–31.7) | 0.14 |
| Physical activity, sample N | 506 | 148 | 306 | |
| Ideal | 36.3 (28.6–44.1) | 18.6 (11.1–26.0) | 16.5 (9.6–23.3) | 0.003 |
| Intermediate | 29.4 (22.6–36.2) | 21.5 (13.4–29.5) | 23.4 (16.7–30.1) | |
| Poor | 34.2 (27.3–41.2) | 60.0 (50.9–69.1) | 60.2 (52.6–67.8) | |
| Smoking status, sample N | 506 | 148 | 306 | |
| Ideal | 74.5 (67.8–81.2) | 75.4 (67.1–83.7) | 89.2 (84.0–94.4) | <0.0001 |
| Intermediate | 14.6 (8.9–20.3) | 7.0 (2.7–11.2) | 8.4 (3.6–13.2) | |
| Poor | 11.0 (6.3–15.6) | 17.7 (10.0–25.3) | 2.4 (0.1–4.7) | |
| BMI, sample N | 484 | 130 | 302 | |
| Ideal | 53.4 (47.2–59.6) | 38.6 (29.3–47.8) | 45.4 (38.0–52.9) | 0.03 |
| Nonideal | 46.6 (40.4–52.8) | 61.4 (52.2–70.7) | 54.6 (47.1–62.0) | |
| Blood pressure, sample N | 465 | 135 | 291 | |
| Ideal | 92.3 (88.8–95.8) | 85.8 (79.0–92.7) | 94.6 (91.8–97.3) | 0.006 |
| Intermediate | 7.6 (4.1–11.1) | 11.9 (5.7–18.1) | 4.0 (1.2–6.7) | |
| Poor | 0.1 (0–0.3) | 2.3 (0–5.4) | 1.4 (1.1–1.8) | |
| Total cholesterol, sample N | 478 | 132 | 289 | |
| Ideal | 38.2 (30.8–45.5) | 39.3 (29.1–49.5) | 39.0 (32.5–45.4) | 0.25 |
| Intermediate | 28.0 (22.0–33.9) | 39.2 (29.9–48.5) | 31.3 (24.8–37.7) | |
| Poor | 33.8 (27.4–40.2) | 21.5 (11.8–31.2) | 29.8 (22.7–36.8) | |
| Fasting plasma glucose, sample N | 200 | 49 | 141 | |
| Ideal | 91.1 (85.8–96.3) | 96.3 (90.4–100) | 87.9 (82.4–93.3) | 0.21 |
| Non‐ideal | 8.9 (3.7–14.2) | 3.7 (0–9.6) | 12.1 (6.7–17.6) | |
| No. of ideal CVH behaviors, mean (95% CI) | 1.0 (0.9–1.1) | 0.9 (0.7–1.1) | 1.0 (1.0–1.1) | 0.003 |
| No. of ideal CVH factors, mean (95% CI) | 2.8 (2.5–3.0) | 2.4 (2.2–2.6) | 2.8 (2.6–3.0) | 0.0005 |
| Total No. of ideal CVH metrics, mean (95% CI) | 3.7 (3.5–4.0) | 3.2 (2.9–3.5) | 3.8 (3.7–4.0) | <0.0001 |
| Total CVH score, mean (95% CI) | 8.6 (8.1–9.1) | 7.6 (6.8–8.3) | 8.4 (8.1–8.7) | 0.0002 |
| Total CVH category, prevalence (95% CI), sample N | 179 | 43 | 131 | |
| High (CVH score 12–14) | 6.5 (0–14.0) | 0.8 (0–2.3) | 0.4 (0–0.9) | 0.03 |
| Moderate (CVH score 8–11) | 65.5 (55.0–76.1) | 44.9 (26.3–63.5) | 70.7 (61.5–79.9) | |
| Low (CVH score 0–7) | 28.0 (19.5–36.5) | 54.3 (35.7–72.9) | 28.9 (19.6–38.2) | |
| Total CVH score, excluding cholesterol, mean (95% CI) | 7.5 (7.1–8.0) | 6.5 (5.8–7.2) | 7.3 (7.1–7.6) | 0.0007 |
| Total CVH category, excluding cholesterol, prevalence (95% CI), sample N | 181 | 43 | 131 | |
| High (CVH score 10–12) | 11.4 (3.2–19.6) | 0.8 (0–2.3) | 5.3 (3.4–7.1) | 0.003 |
| Moderate (CVH score 6–9) | 78.7 (69.0–88.4) | 72.7 (55.4–90.0) | 87.3 (81.8–92.8) | |
| Low (CVH score 0–5) | 9.9 (3.7–16.1) | 26.5 (9.3–43.8) | 7.4 (2.4–12.5) | |
All estimates are based on population‐weighted data from the National Health and Nutrition Examination Survey. BMI and fasting plasma glucose data are for 1999 to 2012, as month of pregnancy information was not available in 2013 to 2014. BMI indicates body mass index; CVH, cardiovascular health.
For 1999 to 2006, calculated on the basis of annual income (INDFMPIR); for 2007 to 2014, calculate on the basis of monthly income (INDFMMPI).
Comparisons between age groups are adjusted for race/ethnicity, income, and education; and comparisons between racial/ethnic groups are adjusted for continuous age, income, and education.
Attainment of healthy diet components was defined as follows: (1) fruits and vegetables: ≥4.5 cups/day; (2) fish: two to three 3.5‐oz servings/week; (3) whole grains (ie, ≥1.1 g fiber per 10 g carbohydrate): ≥3 1‐oz equivalent servings/day; (4) sodium: <1500 mg/d; (5) sugar‐sweetened beverages: ≤450 kcal/wk. See Methods text for details.
Sensitivity Analysis With Alternative Blood Pressure Definition
Using the more restrictive blood pressure definition (Table 1, footnote), the proportions of pregnant women overall and by trimester with poor blood pressure levels were higher, but patterns were similar (Table 7). The patterns of findings for total CVH were also unchanged (Table 7).
Table 7.
CVH Among Women, Aged 20 to 44 Years, in the United States Using Alternative Blood Pressure Categories, by Pregnancy Status and Trimester, 1999 to 2014
| Variable | Population % Prevalence (95% CI) | P Value for Adjusted Comparisona | |
|---|---|---|---|
| Pregnant | Not Pregnant | ||
| Blood pressure, sample N | 1037 | 7428 | |
| Ideal | 90.4 (87.5–93.3) | 74.1 (72.7–75.5) | 0.04 |
| Intermediate | 5.4 (3.5–7.2) | 10.9 (10.1–11.8) | |
| Poor | 4.2 (2.0–6.5) | 14.9 (13.8–16.1) | |
| Total No. of ideal CVH metrics, mean (95% CI) | 3.7 (3.4–3.9) | 3.8 (3.8–3.9) | 0.003 |
| Total CVH score, mean (95% CI) | 8.3 (7.9–8.7) | 8.5 (8.4–8.6) | 0.06 |
| Total CVH category prevalence (95% CI), sample N | 406 | 2563 | |
| High (CVH score 12–14) | 4.6 (0.5–8.8) | 12.9 (10.9–14.9) | 0.13 |
| Moderate (CVH score 8–11) | 59.5 (51.5–67.6) | 54.7 (52.3–57.0) | |
| Low (CVH score 0–7) | 35.9 (27.7–44.0) | 32.4 (30.1–34.8) | |
| Total CVH score, excluding cholesterol, mean (95% CI) | 7.2 (6.9–7.5) | 6.9 (6.8–7.0) | 0.24 |
| Total CVH category, excluding cholesterol, prevalence (95% CI), sample N | 408 | 2589 | |
| High (CVH score 10–12) | 8.5 (3.9–13.1) | 15.8 (13.8–17.8) | 0.003 |
| Moderate (CVH score 6–9) | 76.0 (68.1–83.8) | 58.4 (56.4–60.5) | |
| Low (CVH score 0–5) | 15.5 (8.6–22.4) | 25.7 (23.6–27.8) | |
| Variable | Population % Prevalence (95% CI) | P Value for Comparison | ||
|---|---|---|---|---|
| First Trimester | Second Trimester | Third Trimester | ||
| Blood pressure, sample N | 199 | 404 | 384 | |
| Ideal | 92.0 (88.2–95.8) | 91.2 (86.9–95.4) | 86.6 (80.0–93.3) | 0.58 |
| Intermediate | 4.5 (1.6–7.4) | 4.9 (2.0–7.9) | 6.8 (2.6–11.1) | |
| Poor | 3.4 (1.1–5.8) | 3.9 (0.7–7.2) | 6.5 (1.0–12.1) | |
| Total No. of ideal CVH metrics, mean (95% CI) | 4.0 (3.8–4.3) | 3.7 (3.2–4.1) | 3.4 (3.2–3.5) | <0.0001 |
| Total CVH score, mean (95% CI) | 8.9 (8.4–9.5) | 8.4 (7.7–9.1) | 7.7 (7.4–8.0) | <0.0001 |
| Total CVH category prevalence (95% CI), sample N | 82 | 162 | 162 | |
| High (CVH score 12–14) | 4.4 (2.4–6.5) | 8.6 (0–18.4) | 0.3 (0–0.8) | <0.0001 |
| Moderate (CVH score 8–11) | 79.4 (70.5–88.3) | 49.9 (37.4–62.5) | 55.6 (43.6–67.6) | |
| Low (CVH score 0–7) | 16.1 (8.1–24.2) | 41.4 (28.4–54.4) | 44.1 (32.1–56.0) | |
| Total CVH score, excluding cholesterol, mean (95% CI) | 7.1 (6.6–7.6) | 7.4 (6.8–8.0) | 7.1 (6.8–7.4) | 0.43 |
| Total CVH category, excluding cholesterol, prevalence (95% CI), sample N | 83 | 163 | 162 | |
| High (CVH score 12–14) | 6.4 (3.8–9.1) | 15.0 (4.8–25.2) | 2.9 (1.2–4.6) | 0.003 |
| Moderate (CVH score 8–11) | 79.6 (71.0–88.3) | 68.9 (57.6–80.3) | 81.1 (73.4–88.7) | |
| Low (CVH score 0–7) | 13.9 (6.5–21.4) | 16.1 (7.2–25.0) | 16.0 (9.0–23.0) | |
All estimates are based on population‐weighted data from the National Health and Nutrition Examination Survey. Compared with the primary analyses, a more restrictive definition was used for intermediate blood pressure: systolic 120 to 129 mm Hg and diastolic <80 mm Hg or treated to goal. See Table 1 and text (Methods) for details. Trimester‐specific data as well as total CVH data are for 1999 to 2012, as month of pregnancy information was not available in 2013 to 2014. CVH indicates cardiovascular health.
After adjustment for age and race/ethnicity.
Discussion
Among pregnant women, aged 20 to 44 years, in the United States from 1999 to 2012, CVH was far from optimal: 4.6% had high CVH, 60.6% had moderate CVH, and 34.8% had low CVH. Gestational diet and physical activity were especially poor (0.1% and 27.3%, respectively, with ideal levels), followed by total cholesterol and BMI (38.9% and 51.3%, respectively, with ideal levels). Total CVH levels were worse in pregnant women compared with nonpregnant women, driven mainly by physical activity and total cholesterol levels; when total cholesterol was excluded, both high and low (versus moderate) CVH were less frequent in pregnant women compared with nonpregnant women. In exploratory analyses of subgroups of pregnant women, total CVH was more favorable in older age strata, driven by behaviors, and total CVH was least favorable among blacks compared with whites and Mexicans, driven by a combination of behaviors and factors.
To our knowledge, this is the first study to examine total CVH based on Life's Simple 7 among pregnant women in the United States. One prior study assessed CVH during early pregnancy (median, 13 weeks) using 5 metrics (no diet or physical activity) in the population‐based Generation R Study in the Netherlands.25 In 1924 mostly white and highly educated women with a mean age of 30.8 years, the median CVH score was 8.0 of 10, and ideal levels were found in 74% to 75% for smoking, 47% to 68% for BMI, 41% to 63% for blood pressure, 60% to 64% for cholesterol, and 86% to 91% for glucose (ranges combine women who did or did not develop a hypertensive disorder of pregnancy). Moreover, better CVH during early pregnancy was associated with better CVH and lower carotid intima‐media thickness 10 years later.25 Our findings for CVH among US women in their first trimester of pregnancy were somewhat less favorable for BMI (ideal in 43%), more favorable for blood pressure (92%) and total cholesterol (81%), and similar for smoking (70%) and glucose (96%).
Previous studies have examined individual CVH behaviors and factors in US women during pregnancy. Overall dietary quality among pregnant women was assessed using NHANES 2003 to 2012, and consistent with the findings reported herein, dietary quality was generally poor (mean [SEM] Healthy Eating Index‐2010: 50.7 [0.9] of 100).26 Physical activity during pregnancy has been examined in various NHANES cycles from 1999 to 2014 based on self‐report27 and accelerometer data.28 Physical activity levels were overall suboptimal,27, 28 with statistically significant declines in later trimesters for continuous physical activity measures27, 28 but not categorical measures27 (as in our study). Smoking was examined using self‐reported data from birth certificates in 2016, which indicated that 7.2% of mothers smoked at any point during pregnancy.29 Using different methods (including earlier years), we found a slightly higher prevalence (9.9%) of current smoking in pregnant women.
The 2 components of pregnancy BMI, prepregnancy BMI and gestational weight gain, have been examined in US women using self‐reported data from birth certificates. In 2014, just over half of women giving birth reported prepregnancy overweight (25.6%) or obesity (24.8%).30 In 2012 to 2013, gestational weight gain was estimated as appropriate in 32.1%, inadequate in 20.4%, and excessive in 47.5% of women giving birth to full‐term singletons.31 Our estimate of nonideal BMI during pregnancy (49%) is similar to reported prevalences for both prepregnancy overweight/obesity and excessive gestational weight gain, although our method may have underestimated true nonideal BMI prevalence (eg, overweight women with inadequate weight gain may have been labeled “ideal”). Maternal hypertension prevalence was previously estimated at 6.9%, including 1.6% with chronic hypertension and 5.3% with pregnancy‐related hypertension (including preeclampsia), using clinician‐recorded data from 2014 to 2015 birth certificates.32 By comparison, we estimated that 9.6% of women had elevated blood pressure or medication‐controlled hypertension at a single point in pregnancy. Similarly, clinician‐recorded data from 2016 birth certificates yielded a prevalence of 6.0% for gestational diabetes mellitus and 0.9% for pregestational diabetes mellitus33; we estimated that 8.4% of women had nonideal fasting glucose levels at a single point in pregnancy. In addition to obvious outcome differences (hypertension versus blood pressure, diabetes mellitus versus fasting glucose) and the lower reliability of a single measurement versus diagnostic criteria, these discrepancies may be partly related to underreporting on birth certificates.34 To our knowledge, no prior study has reported total cholesterol levels during pregnancy using nationally representative data, but prior studies of pregnant women have also shown increases in cholesterol levels across gestation.21
Currently, data on the clinical implications of total CVH during pregnancy are limited to the above‐described study, demonstrating associations with later maternal carotid intima‐media thickness.25 However, total CVH during pregnancy is likely to have important implications for health, as extensive data support the relevance of the individual CVH metrics. Gestational diet quality,35, 36, 37 physical activity,36, 38 smoking,39 BMI,6, 17 hypertension,40, 41 and diabetes mellitus2, 20, 42 have well‐established associations with pregnancy outcomes as well as longer‐term maternal and offspring health outcomes. Although less well‐studied, gestational hypercholesterolemia has been associated with preeclampsia20 and offspring atherosclerosis.21 In nonpregnant adults, similarly, each of the 7 CVH factors has independent associations with health outcomes,8 but moreover, total CVH powerfully predicts health outcomes in a way that seems to be more than the sum of its parts.43 Total CVH may similarly provide insights into health during pregnancy beyond counting traditional risk factors, such as preeclampsia and gestational diabetes mellitus. For example, nonoptimal levels of blood pressure and glucose that are below diagnostic thresholds have also been associated with adverse pregnancy outcomes,44, 45 and when gestational hypertension and diabetes mellitus are jointly present, their association with subsequent maternal diabetes mellitus, hypertension, CVD, and mortality is more than additive.46 These data, combined with our observation that <10% of pregnant women in the United States had high CVH (even when cholesterol was excluded from the score), suggest the need for future research examining the implications of the full spectrum of gestational CVH for maternal and offspring health. Currently, few data sets are available to this end, but we look to future opportunities to measure CVH in women before, during, and after gestation, along with subsequent health outcomes for mothers and offspring, to better define temporal relationships.
Conceptually, CVH provides a unifying construct for health promotion that may prove useful during pregnancy. Although women report increased motivation during pregnancy for healthful changes,47 diet or exercise counseling has generally been provided at low rates (17.9% among preventive prenatal visits in the United States in 2005–2010), even lower than for nonpregnant women of childbearing age (22.6%; P<0.02 for comparison).48 Even CVH metrics that are routinely tracked, such as weight, are not always discussed. On the basis of data from the Pregnancy Risk and Assessment Monitoring System 2010 to 2011, just 26% of women reported receiving Institute of Medicine–consistent gestational weight gain advice from a clinician and 26% reported receiving no advice.49 Moreover, clinician advice below Institute of Medicine recommendations was associated with inadequate gain, advice above Institute of Medicine recommendations was associated with excessive gain, and no advice was associated with both.49 The American College of Obstetricians and Gynecologists and AHA have recently assigned priority to comprehensive CVH promotion in women by obstetricians and gynecologists,1 and clinical use of the CVH construct may have utility in operationalizing this goal.50 Formal development of pregnancy‐specific definitions for CVH metrics (such as will be available for diet in the 2020 Dietary Guidelines for Americans35) and further development of treatment options (such as for hypercholesterolemia in pregnancy51) would also be useful.
The strengths of this study include the generalizability related to use of nationally representative data and the comprehensive assessment of all 7 CVH metrics across all 3 trimesters of pregnancy. This study also has several limitations. First, the 7 CVH metrics have not been defined by the AHA for use in pregnant women, and NHANES does not collect all data that might be relevant for CVH metrics during pregnancy (eg, prepregnancy weight versus gestational weight gain), so we used modified metric definitions. All modifications were based on established pregnancy guidelines, except for total cholesterol, for which guidelines are not available and sensitivity analyses without cholesterol were conducted. Second, although evidence supports the relevance of each individual CVH metric during pregnancy for maternal and offspring health outcomes, total gestational CVH has not been extensively studied and further investigation is required to determine its relevance to health outcomes. Third, to increase sample sizes and statistical power, we pooled data from 1999 to 2014 NHANES cycles together for analysis, and we cannot exclude an influence of secular trends on our estimates. As NHANES no longer oversamples pregnant women (as of 2007–2008) nor collects month of pregnancy data (as of 2013–2014), it is not well suited to examine such trends. Fourth, despite pooling all available data, sample sizes remained limited, especially for some subgroups. Because of this and the potential for type 2 errors related to multiple testing, subgroup analyses should be interpreted with caution.
Conclusions
Among pregnant women, aged 20 to 44 years, in the United States from 1999 to 2012, <1 in 10 had high CVH.
Sources of Funding
Dr Perak was supported in part by a National Institutes of Health (NIH)/National Heart, Lung, and Blood Institute (NHLBI) training grant (T32HL069771), a Pediatric Physician‐Scientist Research Award from the Department of Pediatrics, Northwestern University Feinberg School of Medicine, and an NHLBI K23 award (K23HL145101). Dr Khan was supported in part by an award from the NIH/NHLBI and National Center for Advancing Translational Sciences (KL2TR001424) and an award from the American Heart Association (19TPA34890060).
Disclosures
None.
Acknowledgments
Author contributions: Dr Perak conceptualized and designed the work, interpreted the data, drafted the initial manuscript, and reviewed and revised the manuscript. Dr Ning contributed substantially to design of the work, acquired and analyzed the data, contributed to interpretation of the data, and critically revised the manuscript. Drs Khan, Van Horn, and Grobman each contributed substantially to design of the work and interpretation of data and critically revised the manuscript. Dr Lloyd‐Jones contributed substantially to conceptualization and design of the work and interpretation of data and critically revised the manuscript. All authors approved the final manuscript as submitted and agree to be accountable for all aspects of the work.
(J Am Heart Assoc. 2020;9:e015123 DOI: 10.1161/JAHA.119.015123.)
References
- 1. Brown HL, Warner JJ, Gianos E, Gulati M, Hill AJ, Hollier LM, Rosen SE, Rosser ML, Wenger NK; American Heart Association, the American College of Obstetricians and Gynecologists . Promoting risk identification and reduction of cardiovascular disease in women through collaboration with obstetricians and gynecologists: a presidential advisory from the American Heart Association and the American College of Obstetricians and Gynecologists. Circulation. 2018;137:e843–e852. [DOI] [PubMed] [Google Scholar]
- 2. McSweeney JC, Rosenfeld AG, Abel WM, Braun LT, Burke LE, Daugherty SL, Fletcher GF, Gulati M, Mehta LS, Pettey C, Reckelhoff JF. Preventing and experiencing ischemic heart disease as a woman: state of the science—a scientific statement from the American Heart Association. Circulation. 2016;133:1302–1331. [DOI] [PMC free article] [PubMed] [Google Scholar]
- 3. Mosca L, Benjamin EJ, Berra K, Bezanson JL, Dolor RJ, Lloyd‐Jones DM, Newby LK, Pina IL, Roger VL, Shaw LJ, Zhao D, Beckie TM, Bushnell C, D'Armiento J, Kris‐Etherton PM, Fang J, Ganiats TG, Gomes AS, Gracia CR, Haan CK, Jackson EA, Judelson DR, Kelepouris E, Lavie CJ, Moore A, Nussmeier NA, Ofili E, Oparil S, Ouyang P, Pinn VW, Sherif K, Smith SC Jr, Sopko G, Chandra‐Strobos N, Urbina EM, Vaccarino V, Wenger NK. Effectiveness‐based guidelines for the prevention of cardiovascular disease in women—2011 update: a guideline from the American Heart Association. Circulation. 2011;123:1243–1262. [DOI] [PMC free article] [PubMed] [Google Scholar]
- 4. Grundy SM, Stone NJ, Bailey AL, Beam C, Birtcher KK, Blumenthal RS, Braun LT, de Ferranti S, Faiella‐Tommasino J, Forman DE, Goldberg R, Heidenreich PA, Hlatky MA, Jones DW, Lloyd‐Jones D, Lopez‐Pajares N, Ndumele CE, Orringer CE, Peralta CA, Saseen JJ, Smith SC Jr, Sperling L, Virani SS, Yeboah J. 2018 AHA/ACC/AACVPR/AAPA/ABC/ACPM/ADA/AGS/APhA/ASPC/NLA/PCNA guideline on the management of blood cholesterol: a report of the American College of Cardiology/American Heart Association Task Force on Clinical Practice Guidelines. Circulation. 2019;139:e1082–e1143. [DOI] [PMC free article] [PubMed] [Google Scholar]
- 5. Barker DJ. The developmental origins of chronic adult disease. Acta Paediatr Suppl. 2004;93:26–33. [DOI] [PubMed] [Google Scholar]
- 6. Godfrey KM, Reynolds RM, Prescott SL, Nyirenda M, Jaddoe VWV, Eriksson JG, Broekman BFP. Influence of maternal obesity on the long‐term health of offspring. Lancet Diabetes Endocrinol. 2017;5:53–64. [DOI] [PMC free article] [PubMed] [Google Scholar]
- 7. Lloyd‐Jones DM, Hong Y, Labarthe D, Mozaffarian D, Appel LJ, Van Horn L, Greenlund K, Daniels S, Nichol G, Tomaselli GF, Arnett DK, Fonarow GC, Ho PM, Lauer MS, Masoudi FA, Robertson RM, Roger V, Schwamm LH, Sorlie P, Yancy CW, Rosamond WD; American Heart Association Strategic Planning Task Force and Statistics Committee . Defining and setting national goals for cardiovascular health promotion and disease reduction: the American Heart Association's strategic impact goal through 2020 and beyond. Circulation. 2010;121:586–613. [DOI] [PubMed] [Google Scholar]
- 8. Benjamin EJ, Muntner P, Alonso A, Bittencourt MS, Callaway CW, Carson AP, Chamberlain AM, Chang AR, Cheng S, Das SR, Delling FN, Djousse L, Elkind MSV, Ferguson JF, Fornage M, Jordan LC, Khan SS, Kissela BM, Knutson KL, Kwan TW, Lackland DT, Lewis TT, Lichtman JH, Longenecker CT, Loop MS, Lutsey PL, Martin SS, Matsushita K, Moran AE, Mussolino ME, O'Flaherty M, Pandey A, Perak AM, Rosamond WD, Roth GA, Sampson UKA, Satou GM, Schroeder EB, Shah SH, Spartano NL, Stokes A, Tirschwell DL, Tsao CW, Turakhia MP, VanWagner LB, Wilkins JT, Wong SS, Virani SS; American Heart Association Council on Epidemiology and Prevention Statistics Committee and Stroke Statistics Subcommittee . Heart disease and stroke statistics—2019 update: a report from the American Heart Association. Circulation. 2019;139:e56–e528. [DOI] [PubMed] [Google Scholar]
- 9. Ning HY, Labarthe DR, Shay CM, Daniels SR, Hou LF, Van Horn L, Lloyd‐Jones DM. Status of cardiovascular health in US children up to 11 years of age: the National Health and Nutrition Examination Surveys 2003–2010. Circ Cardiovasc Qual Outcomes. 2015;8:164–171. [DOI] [PubMed] [Google Scholar]
- 10. Centers for Disease Control/National Center for Health Statistics . National Health and Nutrition Examination Survey (NHANES) [online]. https://www.cdc.gov/nchs/nhanes/index.htm. Accessed January 17, 2020.
- 11. National Center for Health Statistics . NHANES response rates and population totals [online]. https://wwwn.cdc.gov/nchs/nhanes/ResponseRates.aspx. Accessed August 2, 2019.
- 12. National Center for Health Statistics . NHANES 2013–2014 data documentation, codebook, and frequencies: pregnancy test—urine [online]. https://wwwn.cdc.gov/Nchs/Nhanes/2013-2014/UCPREG_H.htm. Accessed Februrary 19, 2019.
- 13. US Department of Agriculture Food and Nutrition Service . Child nutrition programs: income eligibility guidelines [online]. https://www.federalregister.gov/documents/2018/05/08/2018-09679/child-nutrition-programs-income-eligibility-guidelines. Accessed February 14, 2019.
- 14. Food Surveys Research Group, Beltsville Human Nutrition Research Center, Agricultural Research Service, US Department of Agriculture . Food patterns equivalents database: methodology and user guides [online]. https://www.ars.usda.gov/northeast-area/beltsville-md-bhnrc/beltsville-human-nutrition-research-center/food-surveys-research-group/docs/fped-methodology/. Accessed February 19, 2019.
- 15. Food and Drug Administration . Advice about eating fish, from the Environmental Protection Agency and Food and Drug Administration [online]. https://www.federalregister.gov/documents/2017/01/19/2017-01073/advice-about-eating-fish-from-the-environmental-protection-agency-and-food-and-drug-administration. Accessed January 17, 2020.
- 16. ACOG Committee Opinion No. 650: physical activity and exercise during pregnancy and the postpartum period. Obstet Gynecol. 2015;126:e135–e142. [DOI] [PubMed] [Google Scholar]
- 17. IOM (Institute of Medicine) and NRC (National Research Council) . Weight Gain During Pregnancy: Reexamining the Guidelines. Washington, DC: The National Academies Press; 2009. [PubMed] [Google Scholar]
- 18. ACOG Practice Bulletin No. 202: gestational hypertension and preeclampsia. Obstet Gynecol. 2019;133:e1–e25. [DOI] [PubMed] [Google Scholar]
- 19. Whelton PK, Carey RM, Aronow WS, Casey DE Jr, Collins KJ, Dennison Himmelfarb C, DePalma SM, Gidding S, Jamerson KA, Jones DW, MacLaughlin EJ, Muntner P, Ovbiagele B, Smith SC Jr, Spencer CC, Stafford RS, Taler SJ, Thomas RJ, Williams KA Sr, Williamson JD, Wright JT Jr. 2017 ACC/AHA/AAPA/ABC/ACPM/AGS/APhA/ASH/ASPC/NMA/PCNA guideline for the prevention, detection, evaluation, and management of high blood pressure in adults: a report of the American College of Cardiology/American Heart Association Task Force on Clinical Practice Guidelines. Hypertension. 2018;71:e13–e115. [DOI] [PubMed] [Google Scholar]
- 20. Staff AC, Redman CW, Williams D, Leeson P, Moe K, Thilaganathan B, Magnus P, Steegers EA, Tsigas EZ, Ness RB, Myatt L, Poston L, Roberts JM; Global Pregnancy Collaboration (CoLab) . Pregnancy and long‐term maternal cardiovascular health: progress through harmonization of research cohorts and biobanks. Hypertension. 2016;67:251–260. [DOI] [PubMed] [Google Scholar]
- 21. Napoli C, Palinski W. Maternal hypercholesterolemia during pregnancy influences the later development of atherosclerosis: clinical and pathogenic implications. Eur Heart J. 2001;22:4–9. [DOI] [PubMed] [Google Scholar]
- 22. American Diabetes Association . 2: Classification and diagnosis of diabetes: standards of medical care in diabetes‐2018. Diabetes Care. 2018;41:S13–S27. [DOI] [PubMed] [Google Scholar]
- 23. International Association of Diabetes Pregnancy Study Groups Consensus Panel , Metzger BE, Gabbe SG, Persson B, Buchanan TA, Catalano PA, Damm P, Dyer AR, Leiva A, Hod M, Kitzmiler JL, Lowe LP, McIntyre HD, Oats JJ, Omori Y, Schmidt MI. International association of diabetes and pregnancy study groups recommendations on the diagnosis and classification of hyperglycemia in pregnancy. Diabetes Care. 2010;33:676–682. [DOI] [PMC free article] [PubMed] [Google Scholar]
- 24. Polonsky TS, Ning H, Daviglus ML, Liu K, Burke GL, Cushman M, Eng J, Folsom AR, Lutsey PL, Nettleton JA, Post WS, Sacco RL, Szklo M, Lloyd‐Jones DM. Association of cardiovascular health with subclinical disease and incident events: the Multi‐Ethnic Study of Atherosclerosis. J Am Heart Assoc. 2017;6:e004894 DOI: 10.1161/JAHA.116.004894. [DOI] [PMC free article] [PubMed] [Google Scholar]
- 25. Benschop L, Schalekamp‐Timmermans S, Schelling SJC, Steegers EAP, Roeters van Lennep JE. Early pregnancy cardiovascular health and subclinical atherosclerosis. J Am Heart Assoc. 2019;8:e011394 DOI: 10.1161/JAHA.118.011394. [DOI] [PMC free article] [PubMed] [Google Scholar]
- 26. Shin D, Lee K, Song W. Pre‐pregnancy weight status is associated with diet quality and nutritional biomarkers during pregnancy. Nutrients. 2016;8:162. [DOI] [PMC free article] [PubMed] [Google Scholar]
- 27. Hesketh KR, Evenson KR. Prevalence of U.S. pregnant women meeting 2015 ACOG physical activity guidelines. Am J Prev Med. 2016;51:e87–e89. [DOI] [PMC free article] [PubMed] [Google Scholar]
- 28. Evenson KR, Wen F. Prevalence and correlates of objectively measured physical activity and sedentary behavior among US pregnant women. Prev Med. 2011;53:39–43. [DOI] [PubMed] [Google Scholar]
- 29. Drake P, Driscoll AK, Mathews TJ. Cigarette smoking during pregnancy: United States. NCHS Data Brief. 2016;2018:1–8. [PubMed] [Google Scholar]
- 30. Branum A, Kirmeyer S, Gregory E. Prepregnancy body mass index by maternal characteristics and state: data from the birth certificate, 2014. Natl Vital Stat Rep. 2016;65:1–11. [PubMed] [Google Scholar]
- 31. Deputy NP, Sharma AJ, Kim SY. Gestational weight gain—United States, 2012 and 2013. MMWR Morb Mortal Wkly Rep. 2015;64:1215–1220. [DOI] [PMC free article] [PubMed] [Google Scholar]
- 32. Singh GK, Siahpush M, Liu L, Allender M. Racial/ethnic, nativity, and sociodemographic disparities in maternal hypertension in the United States, 2014–2015. Int J Hypertens. 2018;2018:7897189. [DOI] [PMC free article] [PubMed] [Google Scholar]
- 33. Martin JA, Hamilton BE, Osterman MJK, Driscoll AK, Drake P. Births: final data for 2016. Natl Vital Stat Rep. 2018;67:1–55. [PubMed] [Google Scholar]
- 34. DeSisto CL, Kim SY, Sharma AJ. Prevalence estimates of gestational diabetes mellitus in the United States, Pregnancy Risk Assessment Monitoring System (PRAMS), 2007–2010. Prev Chronic Dis. 2014;11:E104. [DOI] [PMC free article] [PubMed] [Google Scholar]
- 35. Stoody EE, Spahn JM, Casavale KO. The Pregnancy and Birth to 24 Months Project: a series of systematic reviews on diet and health. Am J Clin Nutr. 2019;109:685S–697S. [DOI] [PubMed] [Google Scholar]
- 36. Muktabhant B, Lawrie TA, Lumbiganon P, Laopaiboon M. Diet or exercise, or both, for preventing excessive weight gain in pregnancy. Cochrane Database Syst Rev. 2015;CD007145. [DOI] [PMC free article] [PubMed] [Google Scholar]
- 37. Chatzi L, Rifas‐Shiman SL, Georgiou V, Joung KE, Koinaki S, Chalkiadaki G, Margioris A, Sarri K, Vassilaki M, Vafeiadi M, Kogevinas M, Mantzoros C, Gillman MW, Oken E. Adherence to the Mediterranean diet during pregnancy and offspring adiposity and cardiometabolic traits in childhood. Pediatr Obes. 2017;12(suppl 1):47–56. [DOI] [PMC free article] [PubMed] [Google Scholar]
- 38. Perales M, Artal R, Lucia A. Exercise during pregnancy. JAMA. 2017;317:1113–1114. [DOI] [PubMed] [Google Scholar]
- 39. Crume T. Tobacco use during pregnancy. Clin Obstet Gynecol. 2019;62:128–141. [DOI] [PubMed] [Google Scholar]
- 40. Mannisto T, Mendola P, Vaarasmaki M, Jarvelin MR, Hartikainen AL, Pouta A, Suvanto E. Elevated blood pressure in pregnancy and subsequent chronic disease risk. Circulation. 2013;127:681–690. [DOI] [PMC free article] [PubMed] [Google Scholar]
- 41. Thoulass JC, Robertson L, Denadai L, Black C, Crilly M, Iversen L, Scott NW, Hannaford PC. Hypertensive disorders of pregnancy and adult offspring cardiometabolic outcomes: a systematic review of the literature and meta‐analysis. J Epidemiol Community Health. 2016;70:414–422. [DOI] [PubMed] [Google Scholar]
- 42. Damm P, Houshmand‐Oeregaard A, Kelstrup L, Lauenborg J, Mathiesen ER, Clausen TD. Gestational diabetes mellitus and long‐term consequences for mother and offspring: a view from Denmark. Diabetologia. 2016;59:1396–1399. [DOI] [PubMed] [Google Scholar]
- 43. Lloyd‐Jones DM. Cardiovascular health and protection against CVD: more than the sum of the parts? Circulation. 2014;130:1671–1673. [DOI] [PubMed] [Google Scholar]
- 44. Farrar D, Simmonds M, Bryant M, Sheldon TA, Tuffnell D, Golder S, Dunne F, Lawlor DA. Hyperglycaemia and risk of adverse perinatal outcomes: systematic review and meta‐analysis. BMJ. 2016;354:i4694. [DOI] [PMC free article] [PubMed] [Google Scholar]
- 45. Wikstrom AK, Gunnarsdottir J, Nelander M, Simic M, Stephansson O, Cnattingius S. Prehypertension in pregnancy and risks of small for gestational age infant and stillbirth. Hypertension. 2016;67:640–646. [DOI] [PubMed] [Google Scholar]
- 46. Pace R, Brazeau AS, Meltzer S, Rahme E, Dasgupta K. Conjoint associations of gestational diabetes and hypertension with diabetes, hypertension, and cardiovascular disease in parents: a retrospective cohort study. Am J Epidemiol. 2017;186:1115–1124. [DOI] [PMC free article] [PubMed] [Google Scholar]
- 47. Forbes LE, Graham JE, Berglund C, Bell RC. Dietary change during pregnancy and women's reasons for change. Nutrients. 2018;10:E1032. [DOI] [PMC free article] [PubMed] [Google Scholar]
- 48. Yamamoto A, McCormick MC, Burris HH. US provider‐reported diet and physical activity counseling to pregnant and non‐pregnant women of childbearing age during preventive care visits. Matern Child Health J. 2014;18:1610–1618. [DOI] [PMC free article] [PubMed] [Google Scholar]
- 49. Deputy NP, Sharma AJ, Kim SY, Olson CK. Achieving appropriate gestational weight gain: the role of healthcare provider advice. J Womens Health (Larchmt). 2018;27:552–560. [DOI] [PMC free article] [PubMed] [Google Scholar]
- 50. Foraker RE, Shoben AB, Kelley MM, Lai AM, Lopetegui MA, Jackson RD, Langan MA, Payne PRO. Electronic health record‐based assessment of cardiovascular health: the stroke prevention in healthcare delivery environments (SPHERE) study. Prev Med Rep. 2016;4:303–308. [DOI] [PMC free article] [PubMed] [Google Scholar]
- 51. Maierean SM, Mikhailidis DP, Toth PP, Grzesiak M, Mazidi M, Maciejewski M, Banach M. The potential role of statins in preeclampsia and dyslipidemia during gestation: a narrative review. Expert Opin Investig Drugs. 2018;27:427–435. [DOI] [PubMed] [Google Scholar]