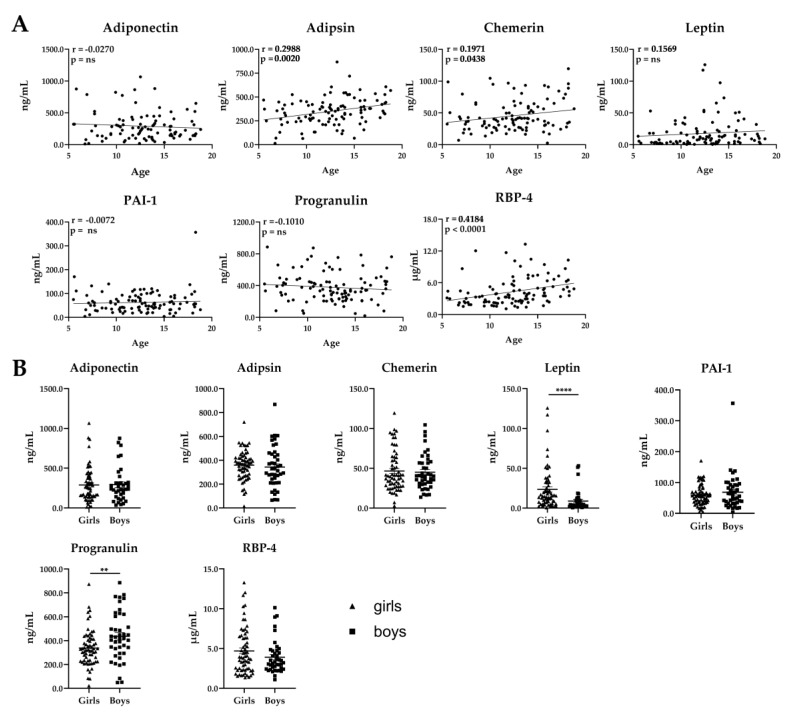
Figure 5.
Adipokine levels in serum from normal weight children (body mass index (BMI)-standard deviation score (SDS) < 1.28). (A) Correlation of adipokine concentrations with age (n = 108, age 6–18). Data show Pearson or Spearman correlation coefficients. Statistical significance was evaluated by two-tailed t-test. ns, not significant. (B) Correlation of adipokine concentrations with sex (64 girls, 44 boys). Scatter plots show mean ± SEM (standard error of the mean). Statistical significance was evaluated by Student’s t-test. * indicates statistically significant differences vs. girls: ** p-value < 0.01, **** p-value < 0.0001.

