Abstract
A highly sensitive photoacoustic (PA) microcavity gas sensor for leak detection is proposed. The miniature and low-cost gas sensor mainly consisted of a micro-electro-mechanical system (MEMS) microphone and a stainless-steel capillary with two small holes opened on the side wall. Different from traditional PA sensors, the designed low-power sensor had no gas valves and pumps. Gas could diffuse into the stainless-steel PA microcavity from two holes. The volume of the cavity in the sensor was only 7.9 μL. We use a 1650.96 nm distributed feedback (DFB) laser and the second-harmonic wavelength modulation spectroscopy (2f-WMS) method to measure PA signals. The measurement result of diffused methane (CH4) gas shows a response time of 5.8 s and a recovery time of 5.2 s. The detection limit was achieved at 1.7 ppm with a 1-s lock-in integral time. In addition, the calculated normalized noise equivalent absorption (NNEA) coefficient was 1.2 × 10⁻⁸ W·cm−1·Hz−1/2. The designed PA microcavity sensor can be used for the early warning of gas leakage.
Keywords: gas leak detection, photoacoustic spectroscopy, microcavity gas sensor, gas diffusion, wavelength modulation spectroscopy
1. Introduction
Gas leak detection plays an important role in the safety monitoring of gas pipelines, chemical plants, coal mines, and residential buildings [1,2,3,4,5]. The leakage of flammable or explosive gases, such as natural gas, can cause serious safety incidents. Trace diffuse gas detection provides an effective method for the early warning of these accidents.
Traditional methods for gas leak detection mainly include electrochemical sensing, semiconductor sensing, and tunable diode laser absorption spectroscopy (TDLAS). In recent years, electrochemical gas sensors and semiconductor gas sensors have been widely used for their low cost and small size [6,7]. However, they both have poor gas selectivity, and the former even has a short working life. In addition, if the semiconductor sensor is not sustained in the probe gas for a long time, it will enter the sleep state due to oxidation. The TDLAS-based optical measurement method can effectively solve the problems of a short working life and poor gas selectivity [8,9,10]. However, the single-pass absorption cell based TDLAS system cannot simultaneously improve the gas detection sensitivity and reduce the volume of the gas chamber. This is because the detection sensitivity is proportional to the absorption path length. As a result, a huge single-pass or a complex multi-pass absorption cell is required to improve the detection sensitivity to the ppm-level. However, the volume of the gas cell in a high-sensitivity TDLAS system is usually greater than 1 L.
Due to the characteristics of almost background-free absorption, photoacoustic (PA) spectroscopy (PAS) is one of the most sensitive trace gas detection methods [11,12,13,14,15,16]. A particular advantage is that the detection sensitivity is generally inversely proportional to the volume of the PA cell, which can effectively reduce the volume of the absorption cell [17,18]. In recent years, various PA gas sensing systems have been proposed for trace CH4 detection. Sampaolo et al. presented a compact quartz-enhanced PAS (QEPAS) sensor prototype for trace gas detection of CH4, C2H6, and C3H8 by using a mid-infrared interband cascade laser (ICL) operating in the spectral range 3.342–3.349 μm [19]. A minimum detection limit (MDL) of 90 ppb for CH4 was obtained with a 1-s integration time. However, due to the small gap between the two tuning fork prongs, the requirement for the quality of the light beam is very high. The non-resonant PA cell with an acoustic sensor (e.g., a cantilever) can also be used for trace CH4 detection. Peltola et al. demonstrated a cantilever-enhanced PAS (CEPAS) based CH4 detection system by utilizing a mid-infrared tunable optical parametric oscillator (OPO) [20]. The MDL achieved 65 ppt with a 30-s averaging time. However, gas valves and pumps, which are usually required in non-resonant PAS systems, need to be closed during the measurement. Therefore, continuous gas leak monitoring is impossible in non-resonant PAS systems. In order to improve the detection sensitivity and achieve the flow measurement, a variety of resonant PA cells with buffers were used. Zheng et al. used a 22-stage mid-infrared interband cascade light emitting device (ICLED) with an optical power of ~700 μW to emit excitation light into a differential resonant PA cell to detect CH4 [21]. When the integral time was 1 s, the assembled system showed that the MDL was ~3.6 ppm. To reduce the cost of the light source, near-infrared lasers with a wavelength around 1650 nm were utilized by Wang et al. [22] and Mao et al. [23], successively. The MDLs reached 10 ppm and 64 ppb, respectively. However, the volumes of the H-type resonant PA cells were usually larger than 200 mL. Moreover, air pumps were still required.
In this paper, we propose a highly sensitive PA microcavity sensor without gas valves and pumps for leak detection. The low-power and low-cost PA gas sensor mainly consists of a micro-electro-mechanical system (MEMS) microphone and a stainless-steel capillary with two small holes opened on the side wall. The leaking gas diffuses into the stainless-steel PA microcavity from two holes. We use the second-harmonic wavelength modulation spectroscopy (2f-WMS) method to measure PA signals. The optimized design method for the sensor is provided. Furthermore, the developed PA gas sensor is tested by detecting the diffusing CH4 gas.
2. Design of the Sensing System
2.1. Design of the PA Microcavity Sensor
The structure diagram of the PA microcavity sensor is shown in Figure 1. A single-mode fiber, a stainless-steel capillary, and a MEMS microphone mainly form the gas sensing head. From the two small holes opened by a laser marker on the side wall of the stainless-steel capillary, gas can diffuse into the stainless-steel PA microcavity. The modulated laser light is injected into the microcavity through the single-mode fiber to excite the PA pressure wave, which is detected by the MEMS microphone (ICS-40730, Invensense) with a sound sensitivity of 25 mV/Pa and a relatively flat frequency response from 25 Hz to 25 kHz.
Figure 1.
Structure diagram of the photoacoustic (PA) microcavity sensor.
In an unsealed cylindrical PA cavity, the generated PA pressure can be expressed as [24]:
| (1) |
| (2) |
| (3) |
where ω is the modulation angular frequency, ωj is the jth order resonance angular frequency of the PA cavity, Qj is the acoustic resonance quality factor at ωj, α is the gas absorption coefficient, r is the inner radius of the PA microcavity, P0 is the light power, γ is the specific heat ratio, τ1 is the thermal relaxation time, and τ2 is the relaxation time generated by gas and heat flow through the small holes. τ1 and τ2 can be expressed as:
| (4) |
| (5) |
where DT is the gas thermal diffusivity, υ is the sound velocity in the PA cavity, and Ag is the total area of the gas diffuse holes.
According to Equations (1)–(5), the magnitude of the generated PA pressure is nearly inversely proportional to the square of the inner radius of the PA cavity. To reduce the size of the PA cavity as much as possible to shorten the response time without increasing the processing difficulty, the inner radius of the stainless-steel cylindrical cavity was set to 0.5 mm.
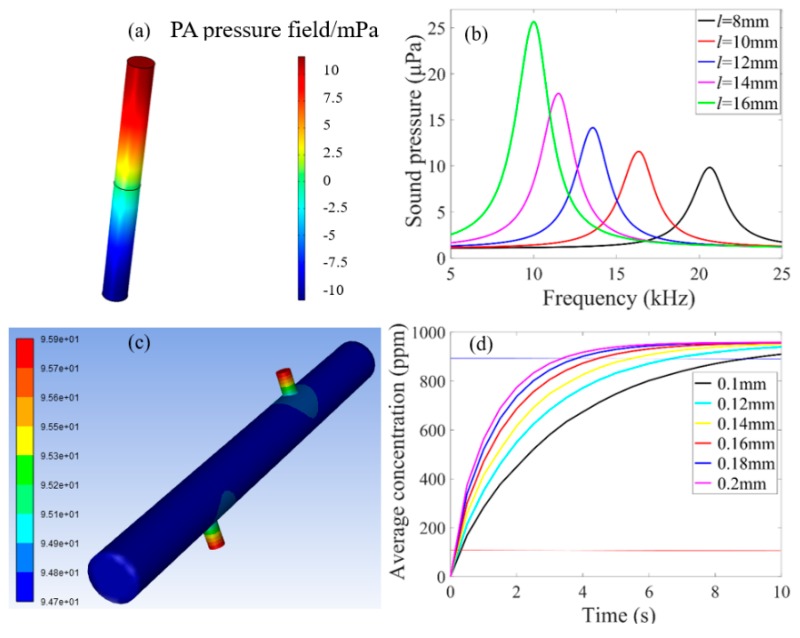
A 3D finite element model was constructed by using COMSOL Multiphysics [25,26] to evaluate the amplitude-frequency response of the PA sensor. The temperature parameter used for COMSOL simulation is 20 °C. Figure 2a shows the PA field distributions at the first-order resonance frequency of the PA sensing head. The antinodes of the acoustic standing wave are located in the dark (red or blue) areas of the two endfaces of the PA cavity, where the maximum PA pressure exists. Meanwhile, the node of the acoustic standing wave is located in the middle of the PA cavity. The boundary layers on the inner wall of the PA tube have been taken into account in the finite element simulation model. The boundary layer will cause the standing wave to lose in the energy accumulation process, which will reduce the Q-factor. It also has a small effect on the resonance frequency [27]. Figure 2b shows the simulated amplitude-frequency response of the PA sensor with different cavity lengths (l = 8, 10, 12, 14, 16 mm). The plotted function corresponds to the magnitude of PPA. A longer PA cavity length has a lower first-order resonance frequency and is beneficial to increase the PA response at the resonance frequency. However, in order to reduce the gas response time, the cavity should be small. Considering that the highest response frequency of the MEMS microphone was 20 kHz, the length of the stainless-steel PA cavity was chosen to be 10 mm. The corresponding cavity volume of the sensor was calculated to be only 7.9 μL. When the sound pressure is highest, the first-order resonance frequency is 16.344 kHz.
Figure 2.
(a) Simulated PA field distribution cloud map of the PA sensor with a length of 10 mm at the first-order resonance frequency. (b) Simulated amplitude-frequency response of the PA sensor with different cavity lengths. (c) Cloud map of simulated gas diffuse concentration in the PA microcavity with 0.15 mm radii of the small holes. (d) Simulated variation of the average concentration in the PA microcavity over time with different radii of the small holes.
The simulation of the gas diffusion process in the PA microcavity was employed by the finite element analysis software of ANSYS Fluent [28]. The response time of the sensor was analyzed when the radii of the two small holes were changed. Figure 2c shows the cloud map of simulated gas diffuse concentration in the PA microcavity. The radii of the small holes are 0.15 mm. By changing the radii of the holes in the model, the average gas concentration in the PA microcavity as a function of time was simulated, as shown in Figure 2d. The larger the radius of the hole, the shorter the response time. However, a big hole weakens the isolation of the external sound field. The radii of two small holes were chosen to be 0.14 mm in order to increase the gas concentration from 10% to 90% within 5 s.
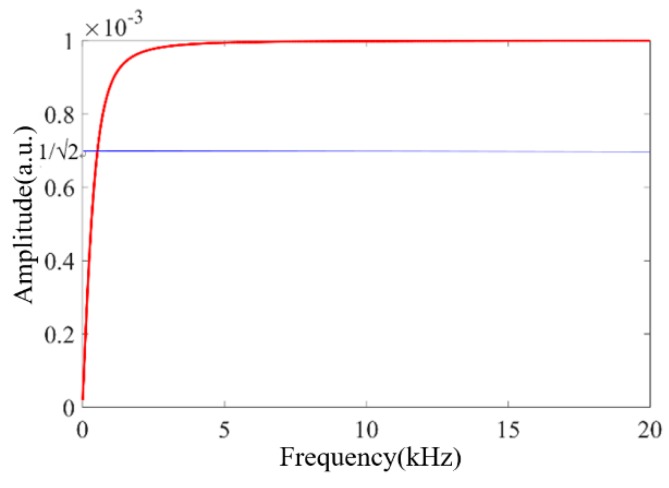
The effect of air flow and heat flow caused by the small holes on the PA response can be regarded as a high-pass filter [29,30], as shown in Equation (3). When the length of the stainless-steel capillary is 10 mm, the inner radius of the capillary is 0.5 mm and the radii of two small holes are 0.14 mm, the relationship between the amplitude of H(τ2) and the frequency is calculated, as shown in Figure 3. The cutoff frequency of H(τ2) is about 550 Hz, which is well below the first-order resonance frequency (16.344 kHz) of the PA cavity. If the sensor operates at the resonance frequency, the generated PA pressure wave is almost confined within the microcavity. At the same time, the external high-frequency disturbing sound field can also be effectively isolated. As a result, combined with the narrow-band signal detection technology, the error of the interference sound field on the PA gas concentration measurement can be greatly reduced.
Figure 3.
Calculated amplitude of H(τ2) as a function of frequency.
2.2. Experimental Setup
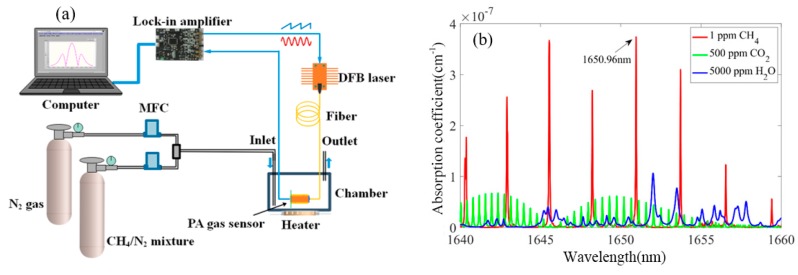
The structure of the test system for diffused CH4 gas detection is schematically shown in Figure 4a. To eliminate the interference caused by the 1f background generated by the light absorption of wavelength independent sources, such as the tube wall, the 2f-WMS technique [10,31] was applied. A distributed feedback (DFB) laser was modulated by a combined signal generated by the addition of a sine wave and a sawtooth wave to generate 2f-WMS signal. The working temperature of the laser was 24 °C. In addition, the sinusoidal modulation amplitude was set to 5.1 mA in order to maximize the 2f-signal [32]. A homemade lock-in amplifier was designed to provide sinusoidal/sawtooth excitation to the DFB laser and detect the 2f component of the PA signal. Since the lock-in amplifier is equivalent to a high-Q bandpass filter, noise can be greatly suppressed. The laser light was injected into the PA sensor through an optical fiber. The lock-in amplifier extracted the 2f component of the PA signal. The miniature PA sensor was placed in a chamber of ~150 mL volume. To study the influence of temperature, we used a heater to adjust the temperature of the aluminum chamber. The gas configuration system consisted of a CH4/N2 gas mixture, a pure N2 gas and two mass flow controllers (MFCs). Different gas concentrations of the test gas were obtained by controlling the flow ratio of the two MFCs. The outlet of the chamber was opened during gas injection. The distinguishing features of the sensor are low power and low cost. The total power consumption is approximately 1.5 W. Since there are no valves and pumps that consume a lot of power, the power consumption can thus be reduced by about 2 W [33]. The power consumption is comparable to the diffusion-type TDLAS gas sensor, which can also avoid the need of a gas valve and pump [34]. The total hardware cost of the PA gas sensor is only about $400. For multi-point gas leak monitoring, a DFB laser can provide a PA excitation source to multiple probes in order to further reduce the power consumption and the cost of a single point measurement.
Figure 4.
(a) Schematic structure of the test system for diffusing gas detection. MFC: mass flow controller; PA: photoacoustic; DFB: distributed feedback. (b) Absorption coefficients of 1 ppm CH4 and interfering gases in the spectral range from 1640 nm to 1660 nm.
In consideration of the low cost of near-infrared lasers, the preferred characteristic wavelength for detecting CH4 is selected in the near-infrared region. According to the HITRAN2012 database [35], the absorption coefficients of 1 ppm CH4, 500 ppm CO2 and 5000 ppm H2O are plotted in Figure 4b in the spectral range from 1640 nm to 1660 nm. The absorption line of CH4 at the wavelength of 1650.96 nm has a higher absorption coefficient and lower interference of H2O and CO2. Even if the water vapor concentration is as high as 50,000 ppm, the interference to the CH4 concentration measurement is still less than 1 ppm. The output power of the DFB laser was ~9 mW at a driving current of 95 mA. Since both the injection current and temperature affect the laser wavelength, the bias current was regulated by a signal generator, and the temperature was thermostatically controlled by a thermoelectric cooler (TEC).
3. Experimental Results and Discussion
3.1. Amplitude-Frequency Response
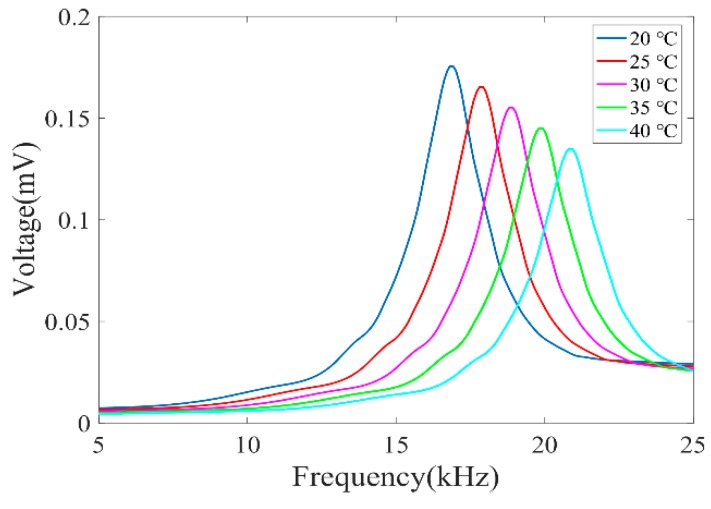
We measured the amplitude-frequency response of the PA microcavity gas sensor with different temperatures of 20 °C, 25 °C, 30 °C, 35 °C, and 40 °C. The chamber was filled with CH4/N2 gas mixture at a concentration of 1000 ppm. The lock-in integration time was 1 s. By stabilizing the bias current at 94.9 mA, the wavelength of the DFB laser was fixed at 1650.96 nm. We scanned the sinusoidal current modulation frequency from 2.5 to 12.5 kHz, and recorded the 2f-WMS signal from 5 to 25 kHz, as shown in Figure 5. With the increase of the temperature, the resonance frequency increased. This is because the sound velocity increases with the increase of temperature. Meanwhile, it indicates that the signal value at the resonance frequency decreases as the temperature increases. This is mainly because decreases as the frequency increases, when the resonance frequency increases. In order to achieve a high-precision concentration measurement, a method of peak finding after frequency scanning and temperature compensation can be used. When the temperature is 20 °C, the sensor has the highest response at 16.62 kHz, which is in good agreement with the theoretical result of 16.344 kHz. In addition, the calculated quality factor is 9.51. In the following experiment, we set the sinusoidal current modulation frequency to be 8.312 kHz in order to maximize the 2f PA pressure signal. The gas detection experiment was carried out under the conditions of an ambient temperature of ~21 °C and a relative humidity of ~17%.
Figure 5.
Measured amplitude-frequency response of the PA microcavity gas sensor filled with 1000 ppm CH4/N2 gas mixture under different temperatures.
3.2. Concentration Response
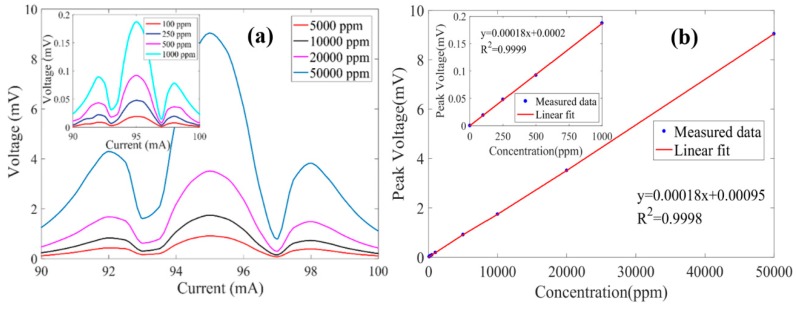
In order to measure 2f-WMS signals of different CH4 concentrations near the wavelength of 1650.96 nm, the bias current of the laser was increased from 90 mA to 100 mA. The root mean square (RMS) value of the PA signal was measured by the lock-in amplifier. The lock-in integration time was set to 1 s. Figure 6a shows the 2f-WMS signal of CH4 at concentrations of 100 ppm, 250 ppm, 500 ppm, 1000 ppm, 5000 ppm, 10,000 ppm, 20,000 ppm, and 50,000 ppm, respectively. Since the laser wavelength at the current of 94.9 mA is 1650.96 nm, which corresponds to the gas absorption peak, the 2f PA signal value is the largest. In practical applications, due to factors such as ambient temperature, the laser wavelength at a fixed current would slightly drift. Therefore, the laser current was scanned, and then the peak value of the measured 2f-WMS signal was sought. The relationship between the measured peak of the 2f-WMS signal and the concentration of CH4 is plotted in Figure 6b. By using a linear fit, the estimated concentration responsivity was obtained at 0.18 μV/ppm for CH4 gas detection. In addition, the calculated R-squared value was 0.9998, which shows that the PA microcavity gas sensor had a good linear response to CH4 concentration levels below 50,000 ppm.
Figure 6.
(a) Measured 2f-WMS signals with different concentrations of CH4. (b) Relationship between peak value and gas concentration.
3.3. Response Time and Recovery Time
The response and recovery time of the PA microcavity gas sensor were measured. A CH4/N2 gas mixture with a concentration of 1000 ppm was injected into the gas chamber. The lock-in integration time was 1 s. After about 20 s, pure N2 was then injected. The measured amplitude of the PA signal is shown in Figure 7 with a 1-s lock-in integral time. The measured voltage from 10% to 90% required a response time of 5.8 s, and a reduction of 90% to 10% required a recovery time of 5.2 s. Since the actual size of the sensor may be different from the designed parameters, the test result of response time was slightly longer than the simulation result. In addition, the stable value of 185.2 μV was basically consistent with the result of peak signal of 187.6 μV shown in Figure 6a.
Figure 7.
Continuous measurement result of 1000 ppm CH4.
3.4. Detection Limit
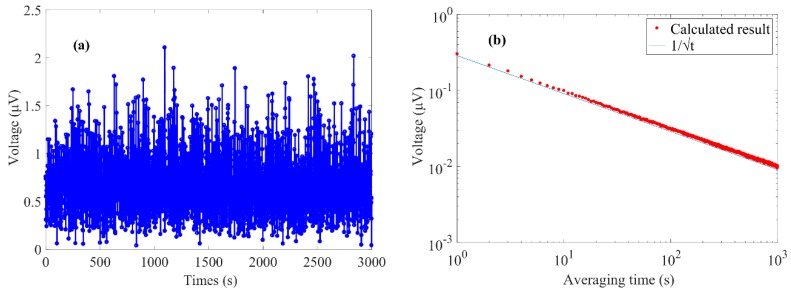
To determine the MDL of the PA microcavity gas sensor, the signal was measured with the gas chamber filled with ambient air. The amplitude of the PA signal was recorded with a 1-s lock-in integral time, as shown in Figure 8a. The calculated standard deviation (1σ) of the measurement result of ambient air was 0.31 μV. The corresponding MDL was obtained at 1.7 ppm according to the concentration responsivity of 0.18 μV/ppm. The calculated minimum detectable absorption coefficient was 6.6 × 10⁻⁷ cm−1. Meanwhile, the calculated normalized noise equivalent absorption (NNEA) coefficient was 1.2 × 10⁻⁸ W·cm−1·Hz−1/2. An Allan–Werle deviation analysis [11,36,37,38,39] was performed, and the result is shown in Figure 8b. The analyzed result almost follows a dependence of 1/t, which indicates that the PA microcavity gas sensor is affected by Gaussian noise during the 3000-s test time. The deviation is 0.03 μV with a 100-s averaging time, and the MDL can be improved to 0.17 ppm.
Figure 8.
(a) PA signal with a 1-s lock-in integral time when the chamber was filled with ambient air. (b) Allan–Werle deviation analysis result.
3.5. Discussion
For practical application, the influence of water vapor induced vibration-rotation (V-T) relaxation should be considered. Schilt [40] and Wu [41] have studied this problem in detail, successively. In addition, the calibration method has been presented by using an additional near-infrared laser to measure the concentration of H2O. In our future work, we will firstly find out the relationship between the amplitude of the PA signal and the water vapor concentration. Subsequently, the influence of the V-T relaxation can be calibrated by the vapor concentration, which is measured by a temperature/humidity sensor installed on the circuit.
4. Conclusions
In summary, a PA microcavity sensor was proposed and developed for gas leak detection with the advantages of high sensitivity, low power, and low cost. The designed PA gas sensor mainly consisted of a stainless-steel capillary and a MEMS microphone. The leaking gas could diffuse into the stainless-steel PA cavity from two small holes opened by the laser marker on the side wall of the capillary. The volume of the PA microcavity was only 7.9 μL. The optimized radius of the two holes was 0.14 mm. A DFB laser operating at 1650.96 nm was used to detect CH4. A good linearity response of the PA microcavity sensor to CH4 concentration less than 50000 ppm was demonstrated with a responsivity of 0.18 μV/ppm. The response time and recovery time were measured to be 5.8 and 5.2 s, respectively. In addition, the MDL and the minimum detectable absorption coefficient of the designed PA microcavity sensor was achieved at 1.7 ppm and 6.6 × 10⁻⁷ cm−1 with a 1-s lock-in integral time, respectively. The calculated NNEA coefficient was 1.2 × 10⁻⁸ W·cm−1·Hz−1/2. The designed PA gas sensor has the advantages of a small volume, simple structure, low cost, high sensitivity, fast response and recovery time, and no need for gas valves and pumps. By changing the laser source, it is possible to detect various trace diffused gases such as NH3, H2S, C2H2 and C2H4.
Author Contributions
Conceptualization, K.C., Y.C. and B.Z.; methodology, K.C., Y.C. and B.Z.; software, Y.C., M.G., H.D., and S.L.; validation, K.C., Y.C. and L.M.; formal analysis, Y.C. and S.L.; investigation, K.C., Y.C., Z.G., and Q.Y.; resources, K.C., Y.C. and Z.G.; data curation, Y.C. and F.M.; writing—original draft preparation, K.C., Y.C. and B.Z.; writing—review and editing, K.C., Y.C., B.Z., L.M., M.G., H.D., S.L., F.M., Z.G. and Q.Y.; visualization, Y.C.; supervision, K.C.; project administration, K.C.; funding acquisition, K.C., F.M. and Q.Y. All authors have read and agreed to the published version of the manuscript.
Funding
This work was supported in part by the National Nature Science Foundation of China (61905034), the Natural Science Foundation of Liaoning Province (2019-MS-054), the Fundamental Research Funds for the Central Universities (DUT18RC(4)040) and the Science and Technology Project of State Grid (521205190014).
Conflicts of Interest
The authors declare no conflict of interest.
References
- 1.Waleed D., Mustafa S.H., Mukhopadhyay S., Abdel-Hafez M.F., Jaradat M.A.K., Dias K.R., Ahmed J.I. An in-Pipe leak detection robot with a neural-network-based leak verification system. IEEE Sens. J. 2018;19:1153–1165. doi: 10.1109/JSEN.2018.2879248. [DOI] [Google Scholar]
- 2.Wan J., Yu Y., Wu Y., Feng R., Yu N. Hierarchical leak detection and localization method in natural gas pipeline monitoring sensor networks. Sensors. 2011;12:189–214. doi: 10.3390/s120100189. [DOI] [PMC free article] [PubMed] [Google Scholar]
- 3.Chen K., Zhang B., Liu S., Yu Q. Parts-per-billion-level detection of hydrogen sulfide based on near-infrared all-optical photoacoustic spectroscopy. Sens. Actuators B Chem. 2019;283:1–5. doi: 10.1016/j.snb.2018.11.163. [DOI] [Google Scholar]
- 4.Elia A., Franco C.D., Spagnolo V., Lugarà P.M., Scamarcio G. Quantum Cascade Laser-Based Photoacoustic Sensor for Trace Detection of Formaldehyde Gas. Sensors. 2009;9:2697–2705. doi: 10.3390/s90402697. [DOI] [PMC free article] [PubMed] [Google Scholar]
- 5.Chen K., Guo M., Liu S., Zhang B., Deng H., Zheng Y., Yu Q. Fiber-optic photoacoustic sensor for remote monitoring of gas micro-leakage. Opt. Express. 2019;27:4648–4659. doi: 10.1364/OE.27.004648. [DOI] [PubMed] [Google Scholar]
- 6.Eric B., Martin T.D. Electrochemical sensors. Anal. Chem. 2002;74:2781–2800. doi: 10.1021/ac0202278. [DOI] [PubMed] [Google Scholar]
- 7.Noboru Y., Kengo S. Theory of power laws for semiconductor gas sensors. Sens. Actuators B Chem. 2008;128:566–573. [Google Scholar]
- 8.Li C., Dong L., Zheng C., Tittel F.K. Compact TDLAS based optical sensor for ppb-level ethane detection by use of a 3.34 μm room-temperature CW interband cascade laser. Sens. Actuators B Chem. 2016;232:188–194. doi: 10.1016/j.snb.2016.03.141. [DOI] [Google Scholar]
- 9.Zhou X., Yu J., Wang L., Gao Q., Zhang Z. Sensitive detection of oxygen using a diffused integrating cavity as a gas absorption cell. Sens. Actuators B Chem. 2017;241:1076–1081. doi: 10.1016/j.snb.2016.10.033. [DOI] [Google Scholar]
- 10.Mei L., Svanberg S. Wavelength modulation spectroscopy—Digital detection of gas absorption harmonics based on Fourier analysis. Appl. Opt. 2015;54:2234–2243. doi: 10.1364/AO.54.002234. [DOI] [PubMed] [Google Scholar]
- 11.Wu H., Dong L., Zheng H., Yu Y., Ma W., Zhang L., Tittel F.K. Beat frequency quartz-enhanced photoacoustic spectroscopy for fast and calibration-free continuous trace-gas monitoring. Nat. Commun. 2017;8:15331. doi: 10.1038/ncomms15331. [DOI] [PMC free article] [PubMed] [Google Scholar]
- 12.Chen K., Yu Q., Gong Z., Guo M., Qu C. Ultra-high sensitive fiber-optic Fabry-Perot cantilever enhanced resonant photoacoustic spectroscopy. Sens. Actuators B Chem. 2018;268:205–209. doi: 10.1016/j.snb.2018.04.123. [DOI] [Google Scholar]
- 13.Ma Y., Qiao S., He Y., Li Y., Zhang Z., Yu X., Tittel F.K. Highly sensitive acetylene detection based on multi-pass retro-reflection-cavity-enhanced photoacoustic spectroscopy and a fiber amplified diode laser. Opt. Express. 2019;27:14163–14172. doi: 10.1364/OE.27.014163. [DOI] [PubMed] [Google Scholar]
- 14.Wang Z., Wang Q., Zhang W., Wei H., Li Y., Ren W. Ultrasensitive photoacoustic detection in a high-finesse cavity with Pound—Drever—Hall locking. Opt. Lett. 2019;44:1924–1927. doi: 10.1364/OL.44.001924. [DOI] [PubMed] [Google Scholar]
- 15.Chen K., Yu Z., Yu Q., Guo M., Zhao Z., Qu C., Yang Y. Fast demodulated white-light interferometry-based fiber-optic Fabry-Perot cantilever microphone. Opt. Lett. 2018;43:3417–3420. doi: 10.1364/OL.43.003417. [DOI] [PubMed] [Google Scholar]
- 16.Chen K., Gong Z., Yu Q. Fiber-amplifier-enhanced resonant photoacoustic sensor for sub-ppb level acetylene detection. Sens. Actuator A Phys. 2018;274:184–188. doi: 10.1016/j.sna.2018.02.025. [DOI] [Google Scholar]
- 17.Elia A., Lugarà P.M., Franco C.D., Spagnolo V. Photoacoustic techniques for trace gas sensing based on semiconductor laser sources. Sensors. 2009;9:9616–9628. doi: 10.3390/s91209616. [DOI] [PMC free article] [PubMed] [Google Scholar]
- 18.Chen K., Liu S., Zhang B., Gong Z., Chen Y., Zhang M., Yu Q. Highly sensitive photoacoustic multi-gas analyzer combined with mid-infrared broadband source and near-infrared laser. Opt. Laser Eng. 2020;124:105844. doi: 10.1016/j.optlaseng.2019.105844. [DOI] [Google Scholar]
- 19.Sampaolo A., Csutak S., Patimisco P., Giglio M., Menduni G., Passaro V., Spagnolo V. Methane, ethane and propane detection using a compact quartz enhanced photoacoustic sensor and a single interband cascade laser. Sens. Actuators B Chem. 2019;282:952–960. doi: 10.1016/j.snb.2018.11.132. [DOI] [Google Scholar]
- 20.Peltola J., Vainio M., Hieta T., Uotila J., Sinisalo S., Metsälä M., Halonen L. High sensitivity trace gas detection by cantilever-enhanced photoacoustic spectroscopy using a mid-infrared continuous-wave optical parametric oscillator. Opt. Express. 2013;21:10240–10250. doi: 10.1364/OE.21.010240. [DOI] [PubMed] [Google Scholar]
- 21.Zheng H., Lou M., Dong L., Wu H., Ye W., Yin X., Canedy C.L. Compact photoacoustic module for methane detection incorporating interband cascade light emitting device. Opt. Express. 2017;25:16761–16770. doi: 10.1364/OE.25.016761. [DOI] [PubMed] [Google Scholar]
- 22.Wang J., Wang H., Liu X. A portable laser photoacoustic methane sensor based on FPGA. Sensors. 2016;16:1551. doi: 10.3390/s16091551. [DOI] [PMC free article] [PubMed] [Google Scholar]
- 23.Mao X., Zheng P., Wang X., Yuan S. Breath methane detection based on all-optical photoacoustic spectrometer. Sens. Actuators B Chem. 2007;239:1257–1260. doi: 10.1016/j.snb.2016.09.132. [DOI] [Google Scholar]
- 24.Kuusela T., Kauppinen J. Photoacoustic gas analysis using interferometric cantilever microphone. Appl. Spectrosc. Rev. 2007;42:443–474. doi: 10.1080/00102200701421755. [DOI] [Google Scholar]
- 25.Bauer R., Stewart G., Johnstone W., Boyd E., Lengden M. 3D-printed miniature gas cell for photoacoustic spectroscopy of trace gases. Opt. Lett. 2014;39:4796–4799. doi: 10.1364/OL.39.004796. [DOI] [PubMed] [Google Scholar]
- 26.Parvitte B., Risser C., Vallon R., Zéninari V. Quantitative simulation of photoacoustic signals using finite element modelling software. Appl. Phys. B. 2013;111:383–389. doi: 10.1007/s00340-013-5344-2. [DOI] [Google Scholar]
- 27.Duggen L., Lopes N., Willatzen M., Rubahn H.G. Finite element simulation of photoacoustic pressure in a resonant photoacoustic cell using lossy boundary conditions. Int. J. Thermophys. 2011;32:774–785. doi: 10.1007/s10765-010-0828-3. [DOI] [Google Scholar]
- 28.Greifzu F., Kratzsch C., Forgber T., Lindner F., Schwarze R. Assessment of particle-tracking models for dispersed particle-laden flows implemented in OpenFOAM and ANSYS FLUENT. Eng. Appl. Comp. Fluid Mech. 2016;10:30–43. doi: 10.1080/19942060.2015.1104266. [DOI] [Google Scholar]
- 29.Chen K., Gong Z., Guo M., Yu S., Qu C., Zhou X., Yu Q. Fiber-optic Fabry-Perot interferometer based high sensitive cantilever microphone. Sens. Actuator A. Phys. 2018;279:107–112. doi: 10.1016/j.sna.2018.06.010. [DOI] [Google Scholar]
- 30.Chen K., Yu Z., Gong Z., Yu Q. Lock-in white-light-interferometry-based all-optical photoacoustic spectrometer. Opt. Lett. 2018;43:5038–5041. doi: 10.1364/OL.43.005038. [DOI] [PubMed] [Google Scholar]
- 31.Schilt S., Thévenaz L. Wavelength modulation photoacoustic spectroscopy: Theoretical description and experimental results. Infrared Phy. Technol. 2006;48:154–162. doi: 10.1016/j.infrared.2005.09.001. [DOI] [Google Scholar]
- 32.Chen K., Liu S., Mei L., Jin F., Zhang B., Ma F., Yu Q. Auto-correction laser photoacoustic spectrometer based on 2f/1f wavelength modulation spectroscopy. Analyst. 2020 doi: 10.1039/C9AN01799B. [DOI] [PubMed] [Google Scholar]
- 33.Chen K., Zhang B., Liu S., Jin F., Guo M., Chen Y., Yu Q. Highly sensitive photoacoustic gas sensor based on multiple reflections on the cell wall. Sens. Actuator A Phys. 2019;290:119–124. doi: 10.1016/j.sna.2019.03.014. [DOI] [Google Scholar]
- 34.Carvalho J.P., Lehmann H., Bartelt H., Magalhães F., Amezcua-Correa R., Santos J.L., Knight J.C. Remote system for detection of low-levels of methane based on photonic crystal fibres and wavelength modulation spectroscopy. J. Sens. 2019 doi: 10.1155/2009/398403. [DOI] [Google Scholar]
- 35.Rothman L.S., Gordon I.E., Babikov Y., Barbe A., Benner D.C., Bernath P.F., Campargue A. The HITRAN2012 molecular spectroscopic database. J. Quant. Spectrosc. Radiat. Transf. 2013;130:4–50. doi: 10.1016/j.jqsrt.2013.07.002. [DOI] [Google Scholar]
- 36.Werle P., Mücke R., Slemr F. The limits of signal averaging in atmospheric trace-gas monitoring by tunable diode-laser absorption spectroscopy (TDLAS) Appl. Phys. B. 1993;57:131–139. doi: 10.1007/BF00425997. [DOI] [Google Scholar]
- 37.Liu K., Mei J., Zhang W., Chen W., Gao X. Multi-resonator photoacoustic spectroscopy. Sens. Actuators B Chem. 2017;251:632–636. doi: 10.1016/j.snb.2017.05.114. [DOI] [Google Scholar]
- 38.Zhou S., Slaman M., Iannuzzi D. Demonstration of a highly sensitive photoacoustic spectrometer based on a miniaturized all-optical detecting sensor. Opt. Express. 2017;25:17541–17548. doi: 10.1364/OE.25.017541. [DOI] [PubMed] [Google Scholar]
- 39.Chen K., Deng H., Guo M., Luo C., Liu S., Zhang B., Yu Q. Tube-cantilever double resonance enhanced fiber-optic photoacoustic spectrometer. Opt. Laser Technol. 2020;123:105894. doi: 10.1016/j.optlastec.2019.105894. [DOI] [Google Scholar]
- 40.Schilt S., Besson J.P., Thévenaz L. Near-infrared laser photoacoustic detection of methane: The impact of molecular relaxation. Appl. Phys. B. 2006;82:319–328. doi: 10.1007/s00340-005-2076-y. [DOI] [Google Scholar]
- 41.Wu H., Dong L., Yin X., Sampaolo A., Patimisco P., Ma W., Jia S. Atmospheric CH4 measurement near a landfill using an ICL-based QEPAS sensor with VT relaxation self-calibration. Sens. Actuators B Chem. 2019;297:126753. doi: 10.1016/j.snb.2019.126753. [DOI] [Google Scholar]


