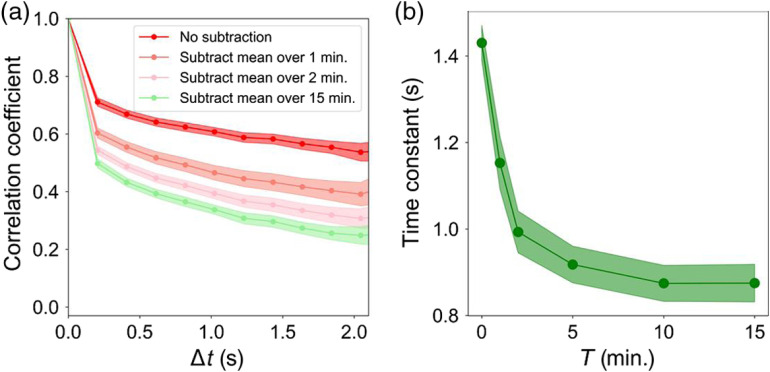
Fig. 11.
Effectiveness to remove structural correlation from the NFL correlation coefficient and time constant improves with increased averaging time period, . (a) Full-layer (window #1) temporal correlation coefficient and (b) corresponding time constant for , 1, 2, 5, 10, and 15 min. Shaded colored bands about each trace denote 95% confidence intervals.

