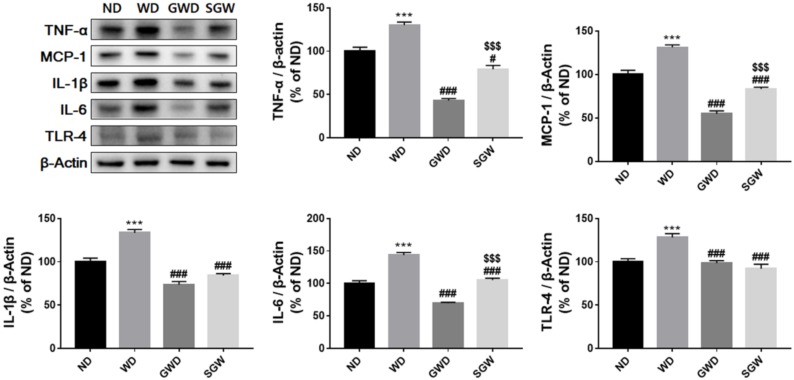
Figure 5.
Diet-induced change of inflammatory cytokines’ expression in the liver. Band intensities were normalized to those of β-actin and bar values are presented as the mean percentage of ND ± SEM of three independent experiments (* p < 0.05, *** p < 0.001 vs. ND; # p < 0.05, ### p < 0.001 vs. WD; $$$ p < 0.001 vs. GWD).

