Figure 3.
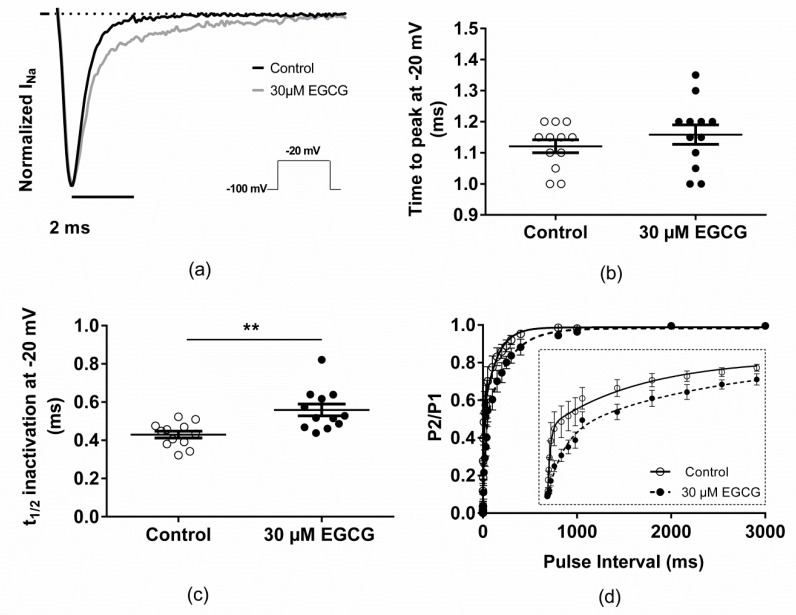
Effect of EGCG on INa kinetics. (a) Representative traces of normalized INa current in the presence or the absence of 30 µM of EGCG. INa currents were normalized to the maximal peak current measured, in each condition, at −20 mV. EGCG effect on INa time to peak (b), inactivation kinetics (c), and recovery from fast inactivation (d; inset, zoom on the interval between 0 and 300 ms).

