Abstract
We conducted a field test at a potential Mars analog site to provide insight into planning for future robotic missions such as Mars 2020, where science operations must facilitate efficient choice of biologically relevant sampling locations. We compared two data acquisition and decision-making protocols currently used by Mars Science Laboratory: (1) a linear approach, where sites are examined as they are encountered and (2) a walkabout approach, in which the field site is first examined with remote rover instruments to gain an understanding of regional context followed by deployment of time- and power-intensive contact and sampling instruments on a smaller subset of locations. The walkabout method was advantageous in terms of both the time required to execute and a greater confidence in results and interpretations, leading to enhanced ability to tailor follow-on observations to better address key science and sampling goals. This advantage is directly linked to the walkabout method's ability to provide broad geological context earlier in the science analysis process. For Mars 2020, and specifically for small regions to be explored (e.g., <1 km2), we recommend that the walkabout approach be considered where possible, to provide early context and time for the science team to develop a coherent suite of hypotheses and robust ways to test them.
Keywords: Mars, Science operations, Rover, Analog, GHOST field test
1. Introduction
A major step toward reaching the goal of understanding whether life ever arose on Mars is performing astrobiologically relevant investigations on the martian surface. Such investigations include determining the habitability of ancient martian environments and searching for materials with high biosignature preservation potential; roving assets are unique tools for conducting this remote geological work (e.g., Stoker, 1998). However, there are unique challenges in meeting these objectives when using robotic avatars, as they yield far less contextual information compared with what is typically available for terrestrial sites, and interpreting the resulting geological clues is not always straightforward based on limited data. In addition, geologists on Earth can typically return to field sites, but remote geological fieldwork suffers from the problem of never being able to definitively determine what was missed, thereby making it difficult to assess the efficiency and success of the field methods used.
A common approach used to assess the efficacy of various methods of remote geological exploration and sampling is to study a terrestrial site that is analogous to the pertinent characteristics of the target extraterrestrial site, using rovers, communication systems, and other equipment similar to that used in remote exploration (Greeley et al., 1994; Whittaker et al., 1997; Arvidson et al., 2000; Stoker et al., 2001, 2002; Lee et al., 2007; Fong et al., 2010; Eppler et al., 2013; Graham et al., 2015; Lim et al., 2018; Osinski et al., 2019). Although this method has shown success when the goal is to test technology (e.g., Zacny et al., 2011; Mueller et al., 2013; Sanders and Larson, 2015), it has proven more difficult when testing the decision-making process of conducting science remotely. This difficulty stems from the dependence on the use of technology that, if not performing nominally, causes breaks in the science decision-making process that compromise test fidelity for science operations (Cohen, 2012; Eppler et al., 2013; Graham et al., 2015; Yingst et al., 2015). The GeoHeuristic Operational Strategies (GHOST) field tests are designed to isolate and test science-driven landed and rover operations scenarios, to determine best practices for maximizing the science return from planetary missions. This is accomplished by choosing to use the simplest technology possible to enable science, so that the science process itself can be isolated and studied. Such a testing strategy illuminates best practices for a wide variety of science scenarios, instrument configurations, spacecraft types, and mission goals. In the field test reported here, the GHOST team compared two approaches to collecting geological data remotely using a semiautonomous rover, where the mission goal was to choose the highest priority locations to acquire samples that might contain evidence of biosignatures. Our objective was to assess the benefits and drawbacks of each data acquisition method in terms of resources expended, science returned, and quality of samples chosen.
2. Methods
2.1. Approaches to data acquisition
We tested two approaches to acquiring data with a rover: “linear” and “walkabout” (also referred to as “walkabout-first”). The linear approach is the one most commonly used in remote robotic exploration. In this approach, all sites are examined as they are encountered, and the rover rarely covers the same ground twice. The walkabout approach is the one most consistent with that employed by field geologists on Earth. In remote analysis, the method is utilized by first examining the field site with instruments that do not require direct contact with the surface (e.g., images and remote chemical analysis). This allows scientists to build a contextual understanding of the region of interest (ROI) before deploying time- or power-intensive contact and sampling instruments. The same ground is then traversed again, with a similar or modified pathway, and contact and sampling instruments are used to interrogate a subset of locations—chosen for their science value by the science team—in more detail. Thus, the first loop provides remotely acquired data, which are used to make decisions about which subset of sites to examine in more detail during subsequent loops through the same terrain.
Each of the two science operations approaches has perceived benefits and drawbacks. The linear approach may have the benefit of covering the most new terrain, but it requires that scientists make decisions regarding next steps with sparse knowledge of the rest of the site, and specifically whether upcoming features along the traverse path are of higher science value than those in the current workspace (the meter-scale area in front of the rover, in which arm-mounted contact instruments can be deployed). The walkabout approach provides an overview of the entire site that can then be used to choose among previously examined sites for more detailed work (Arvidson et al., 2014; Vasavada et al., 2014). The primary benefit of this approach is that more comprehensive information about the entire ROI is fed into the science system earlier, before deploying contact and sampling instruments. The concern is that fewer different sites can be examined and less new ground can be covered over the lifetime of the mission, thus limiting the rate at which the rover can progress toward other strategically determined targets, and potentially losing information crucial to mission objectives.
Our objective was to compare the relative efficiency and efficacy of both approaches in terms of time expended by the science system, rover and personnel resource use, knowledge gleaned, and the impact of the two approaches on the decision-making process in choosing sites with the greatest chance of containing evidence of biosignatures. This objective was chosen to support the upcoming (as of this writing) Mars 2020 rover mission. For this mission, the science operations process, though originally based on that for the Mars Science Laboratory (MSL) Curiosity rover (Vasavada et al., 2014), will differ in crucial ways from previous missions. First, unlike earlier Mars rovers, a key goal of the Mars 2020 mission is to select and cache high-priority samples that may inform the search for biosignatures on Mars. Thus, it is important to explore best practices in the process of choosing which samples to cache. Second, for MSL, much of the science decision-making process is accomplished off the official planning timeline, through informal meetings of scientists in self-selecting disciplinary groups (e.g., sedimentology–stratigraphy; clay working group) or groups with interest in a specific location (e.g., Vera Rubin ridge working group). These groups discuss salient observations, define science priorities for the discipline or location in question, and feed their findings into the regular tactical process, in part by staffing representatives at each planning meeting, to ensure their science decisions result in appropriate observations being acquired. The current Mars 2020 plan formalizes an adaptation of this scenario by dividing science planning into campaigns within each ROI, and tasking groups of scientists to choose and strategically plan the important observations in those campaigns months before the rover arrives. Third, MSL sets an exploration schedule driven by strategic science goals and targets within Gale crater, but its timeline has the flexibility to respond to discoveries made along the strategic path when such investigation contributes to the science goals of the mission. The Mars 2020 operations process permits changes to the strategic plan for a given ROI or campaign, but changes must be accommodated within the duration strategically allotted for that particular campaign or ROI. Thus, for Mars 2020, ROIs will have an added importance in the science operations process, and how they are interrogated will determine how efficient and efficacious the science process will be. One purpose of this study is to provide insight into what effects—either positive or negative—these adaptations will have on the science decision-making process.
In prior field tests (Yingst et al., 2011, 2014, 2016), we explored the linear and walkabout strategies in locations in east-central Utah, at a field location containing a number of rock layers of varying thickness in a medium-sized ROI (∼1 km2), and where potential locations of past habitability were subtly expressed or present in very narrow discrete locations. In the most recent test, the team found that the walkabout approach saved time and improved confidence in interpretations (Yingst et al., 2016). By contrast, the ROI in the test reported here is only 500 × 500 m and composed of compact repetitive geological rock packages. This narrowed the focus of the test to permit assessment of how the size of the area to be explored might affect the efficacy of each approach in using resources and facilitating data collection and analysis, and the decision-making process. Furthermore, because potential habitable environments were more varied at this field site than at previous sites, sampling decisions had to be made more frequently, allowing us to better examine the impact of differences in the decision-making process between teams.
2.2. Testing rover science operations without a rover
GHOST adopts a “roverless roving” approach that isolates science-driven protocols from those driven by the requirements of the engineering or operations systems (Yingst et al., 2011, 2014, 2016). We use a generalized suite of commercial off-the-shelf instruments that provides commonly used visual and compositional data similar to flight instruments. The humans who provide mobility and run the instruments do not allow their geological knowledge to inform data acquisition. This method works because testing science decision-making protocols (which instruments to use, when and how often to use them), and assessing the science results, require as input only the instrument-acquired data, rather than the data acquired through engineering operations (e.g., rover mobility and arm use). Acquisition of meaningful results, however, requires defining reasonable facsimiles of Mars-specific operation scenarios. Variables that must be addressed include the type of instruments to be used, the number and type of observations that can be acquired in a single planning period (where each martian day is referred to as a “sol” and a single planning period usually includes 1–4 sols), traversability, including estimates of driving distance per sol, and the trade-off between mobility and science observations. Many of these variables can be summarized as estimates of which, and how many, science activities can reasonably be completed within a single sol. We note that the data-acquisition process adopted by the field team (the rover acquires and then returns data as directed by the team, who decides what the rover should do next and communicates these instructions to the rover) represents the downlink-science/planning-uplink process that occurs on 1–3 day cycles on missions such as MSL. Thus, our scenario specifically uses a timeline for interpretation of downlinked results that is used in applicable mission science.
2.3. Estimating activities per sol
In current and past rover mission scenarios (Mars exploration rovers [MERs], MSL), limited power, time, and data volume constrain the number and type of science observations that may fit into a single rover planning cycle of one or more sols. To estimate a cadence of observations and driving for our field test that might be reasonable for the Mars 2020 mission, we estimated the resources employed by the MSL mission (as averaged over the past 6 years of operations [Vasavada et al., 2014]) to execute common observations and mobility commands. That is, the field team worked at a normal (human) pace to make the most efficient use of limited field time. We then translated those field activities into an estimated number of sols that would be required to execute the same activities on Mars. Based on MSL averages, we assumed that one sol's activities could include ∼1 h of active remote data acquisition (imaging, whole-rock multispectral data from Mastcam or ChemCam) and one choice of either a drive (50–100 m was considered the maximum distance the rover might drive in 1 sol) or multiple observations using the instruments mimicking those that come into contact with the surface (e.g., Mars Hand Lens Imager [MAHLI], Alpha Particle X-ray Spectrometer [APXS]; with such a sol also referred to as contact science).
2.4. Instruments
The crucial characteristic of an instrument for this field test is its ability to reproduce science data similar to what might be acquired by current or future mission instruments. We thus chose instruments that could yield the general data type and resolution that might be expected to be useful for a number of Mars missions, including MSL. We chose a digital single-lens reflex camera with a macro lens to cover the range of resolutions produced by Mastcam/Mastcam-Z on MSL/Mars 2020 (Malin et al., 2010; Bell et al., 2016) and MAHLI/WATSON (Wide Angle Topographic Sensor for Operations and eNgineering) on MSL/Mars 2020 (Edgett et al., 2012; Beegle et al., 2015). The Mars 2020 SHERLOC/PIXL (Scanning Habitable Environments with Raman and Luminescence for Organics and Chemicals/Planetary Instrument for X-ray Lithochemistry) instruments (Beegle et al., 2007, 2015) were assumed to be crucial to the actual sampling process, rather than the process of choosing samples, and were thus not mimicked in this test. A handheld spectrometer (TerraSpec HALO field-portable imaging spectrometer generously furnished by Malvern Panalytical) (Black and Hynek, 2018) yielded rapid hyperspectral whole-rock mineralogy in the visible-near infrared (VNIR) wavelengths (similar to Mastcam/Mastcam-Z's multiple filters, and SuperCam's VNIR reflectance spectroscopy). Spectral samples were collected in situ from specific locations in outcrops and float rocks identified by using the cameras. No additional sample preparation (e.g., powdering and sieving) was needed, as the HALO is a contact probe and only needs the sampling window to be placed against the sample surface for collection. Spectra were analyzed with the Environment for Visualizing Images (ENVI) software from Harris Geospatial Solutions. Absorptions in individual field spectra were manually fit to library spectra by using the USGS splib07 and CAT Compact Reconnaissance Imaging Spectrometer for Mars (CRISM) mineral libraries.
Where a whole-rock composition is noted by one of the teams, the data were acquired by TerraSpec, and when elemental components (derived from mineral abundances) are mentioned, samples were powdered in a mortar and pestle and analyzed on site with the field portable Olympus Terra X-ray diffractometer (XRD) instrument, a commercial CheMin analog instrument. A mineral was considered positively identified when a pattern matched all strong and moderate diffraction lines on the appropriate American Society for Testing and Materials cards. XPowder software was used for pattern matching and quantitative analysis along with the “difdata” library from the American Mineralogist Crystal Structure Database for phase identification, which we customized to include additional sulfate phases. Diffractograms were analyzed from 5° to 55° in 2-theta space. After that, quantitative mineralogy was reduced to elemental oxide abundances (equivalent to APXS data from Mars) from the elemental weight percentages derived from the minerals identified in each XRD sample. When requested by the field science teams, mantling dust was removed by hand, mimicking a dust removal tool as found on MSL, and resolutions were adjusted to mimic those of Mastcam/Mastcam-Z and ChemCam/SuperCam.
Finally, as a technology demonstration, we used a small commercial drone to test potential operational strategies of a small scout rotocopter, which could provide traverse reconnaissance or follow-on science analysis to a surface rover mission. A dual use of a drone-type vehicle and a rover could represent a future approach, in which the drone could provide context and reconnaissance for the rover. All instrument observations are listed in Supplementary Tables S1 and S2 in the Supplementary Data.
2.5. Personnel and data acquisition
We utilized the same division of team members as in similar field analog tests (Yingst et al., 2016). In this case, our field team divided into five teams: a two-person Linear Team, a two-person Walkabout Team, a Rover Crew for each of these two teams, and a two-person Tiger Team to examine the site using standard terrestrial geological practices. In addition, one individual served as the Site Expert. The Site Expert reconnoitered the site before fieldwork, to allow the rest of the team to approach the site blind. She then provided the rest of the field team with “orbital” data similar to what might be produced for a rover mission (e.g., Mars Reconnaissance Orbiter [MRO] Context Camera [CTX] and High-Resolution Imaging Science Experiment [HiRISE] visible-wavelength images, CRISM spectroscopic data). Using only these data, the three science teams developed hypotheses for the depositional history of the site, to be tested during fieldwork. The Linear Team planned a traverse and potential sites for data acquisition based on a linear approach, whereas the Walkabout Team did the same, based on a walkabout approach. The Tiger Team also used orbital data to preplan how they would approach the site based on standard geological field methods; their work thus served as a baseline set of decisions and results that facilitated direct comparison between results using rover-driven methods and those achieved by a traditional terrestrial field exercise (e.g., Osinski et al., 2019). The Linear, Walkabout, and Tiger Teams each were composed of one individual with significant rover operations experience and one individual with expertise in sedimentology. The teams were small for the sake of efficiency and cost-effectiveness; however, because they were small, we were required to accept the risk that differences in specific areas of expertise among the team members would allow one team to assess the site more quickly, or with more in-depth understanding, than another. To offset potential bias, we conducted a debrief after fieldwork had concluded, wherein each team member was asked to present his or her findings in comparison to those of others with similar expertise. Although there were some differences in the speed and thoroughness with which the teams reached conclusions, the entire team agreed that the outcomes of the test would not have changed had the team members been switched.
The Rover Crews each consisted of two students, the first equipped with a camera, playing the role of rover (one each for the Linear and Walkabout Teams), and a second who supported instrument maintenance and operated the TerraSpec and XRD (since there was only a single TerraSpec and portable XRD, these were handled by one student expert each, who provided commanded data to each team as requested). The Rover Crews followed the planned traverses and acquired data for the appropriate science team, whereas the science teams remained at a location several kilometers from the field site during operations and, therefore, did not see the field area during operations except for the data acquired by the rovers. These data were used in the decision-making process for choosing and prioritizing samples, as well as adjusting the traverse when it was deemed necessary. Concurrently, the Tiger Team executed their field site analysis.
To mimic science decision-making for a spacecraft mission, this test included a mission science objective that formed the framework for the investigation. Drawing on the Mars 2020 mission objectives, we defined the science objective of this fieldwork as identifying, characterizing, and sampling targets with the highest paleoenvironmental habitability potential (texture, morphology, composition, and lithology all contribute to interpreting habitability potential), within an appropriately understood geological context. The site was chosen with this objective in mind. Each team (Linear, Walkabout, and Tiger) was limited to collecting three samples. The decision to sample a location was made by each team based on their interpretation of the local and regional geology, and their assessment of the likelihood that high-value biosignatures would be contained within the sample. The resulting sample suite was then judged based on three criteria: (1) whether biosignatures were preserved in the sample; (2) whether the sample provided sufficient environmental context to interpret any biosignatures present; and (3) to what extent the suite of three samples allowed the depositional environment of those biosignatures to be interpreted.
3. Field Site
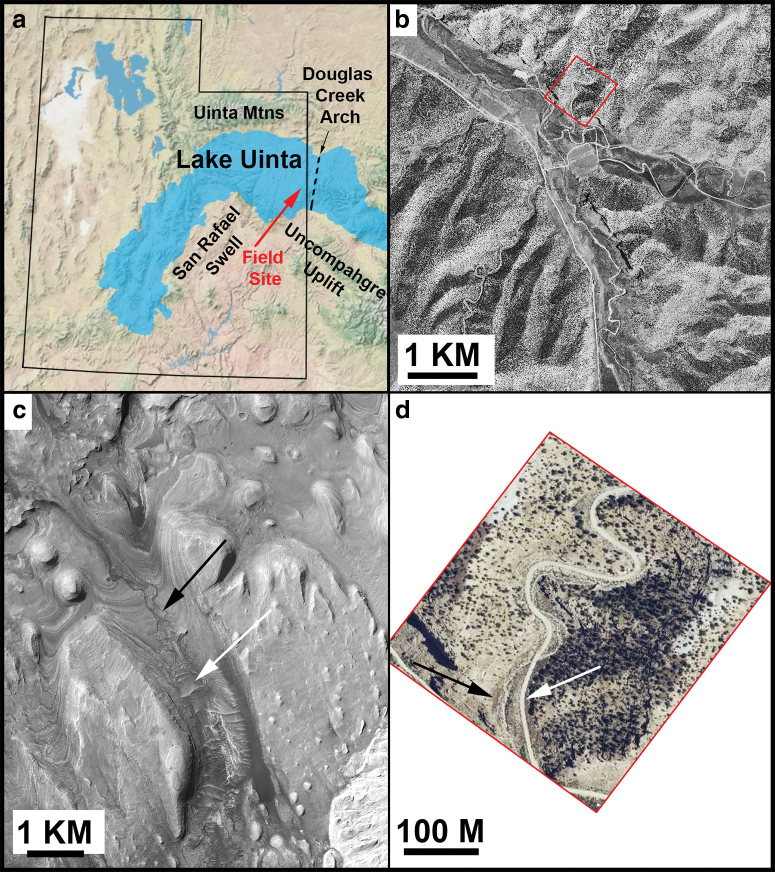
Consistent with the current goals of the NASA Mars Exploration program (Hamilton et al., 2015), we chose a Mars analog site with evidence of past habitability detectable from in situ measurements. Lacustrine environments have long been recognized as having excellent potential for both habitability and preservation (e.g., Summons et al., 2011). As a lacustrine/deltaic analogue, the “Gray Huts” field site (Fig. 1) was selected because most recent, current, and future Mars landing sites are proposed locations of former lacustrine environments. In addition, at a smaller scale, the field site resembles Gediz Valles in Gale crater, in that both represent erosion through shallowly dipping strata (Fig. 1b). Strata at the field site also preserve a terminal distributary channel and fluvial mouth bar system (Rosenberg et al., 2015) similar to the inferred depositional environment at several martian candidate landing sites such as Eberswalde, Holden, Jezero and Gale craters, and Melas Chasma (e.g., Grant et al., 2010; Schon et al., 2012; Rice et al., 2013; Williams and Weitz, 2014; Grotzinger et al., 2015).
FIG. 1.
(a) Paleogeological map of Utah during the Eocene, showing the approximate boundary of Lake Uinta marked; red arrow indicates the field site. (b) Orthorectified panchromatic 1 m/pixel image from Utah Geological Survey showing context of field site; field site is in red box. (c) Gediz Vallis, Mars; white arrow indicates valley floor, at higher elevation, whereas black arrow indicates incised channel (HiRISE image PSP_009294_1750 with the subscene centered near 4.796 S, 137.413 E). (d) Area in red box in (b); black arrow indicates a wash, white arrow indicates a road at higher elevation. Both Gray Huts canyon and Gediz Vallis are characterized by gently dipping layered sedimentary rocks (USDA Farm Service Agency National Agriculture Imagery Program aerial survey image, 1 m/pixel). North is up in all images. HiRISE, High-Resolution Imaging Science Experiment. Color images are available online.
In addition, our field site contains a range of micro- and macroscopic biosignatures, including chemical and fossil records (Eby et al., 2012; Rosenberg et al., 2015). Microbialite packages (up to 1 m thick) observed in outcrop include a variety of thinly laminated to clotted stromatolite and thrombolite heads, thinly laminated digitate stromatolites, and centimeter-scale oncolites, as well as associated carbonate grainstone facies.
The field site is located ∼40 km south-southeast of the town of Vernal, near the Utah–Colorado state border, in the Uinta Basin of the Colorado Plateau province, on land administered by the State of Utah and the Bureau of Land Management (39.8058°N, 109.0759°W). The Laramide-age Uinta Basin is an intermontane low bounded by the Uinta uplift to the north, the San Rafael and Uncompahgre uplifts to the south, and the Douglas Creek arch, an anticline, to the east (Fig. 1a). Strata in the southern Uinta Basin dip gently to the northwest, resulting in extensive Eocene outcrops of the Green River Formation along the eastern and southern flanks of the Uinta Basin. The field site is situated within an unnamed tributary gully in the Evacuation Creek drainage basin. Widely spaced vegetation in the canyon terrain includes sage brush in the wash, and slopes dotted with pine and juniper trees. Canyon slopes are generally steep (>45°) and the total relief within the study site is 120 m. Strata are well exposed at the field site, with some outcrops exposed in three dimensions.
The Green River Formation in the Uinta Basin records deposition within ancient Lake Uinta (Fig. 1a), which occupied portions of northeastern Utah between 57 and 43 Ma (million years ago). Exposed strata were deposited in fresh to hypersaline depositional environments (Vanden Berg and Birgenheier, 2017). The GHOST exercise examined rocks from the uppermost Douglas Creek Member, which includes a combination of fluvial–deltaic and carbonate facies (Rosenberg et al., 2015). A more detailed treatment of the field site is included in the Supplementary Data. We note that science team members were not provided with age constraints for the strata, or any lithological information other than what could be deciphered from processed orbital data.
4. Fieldwork
4.1. Site assessment before fieldwork
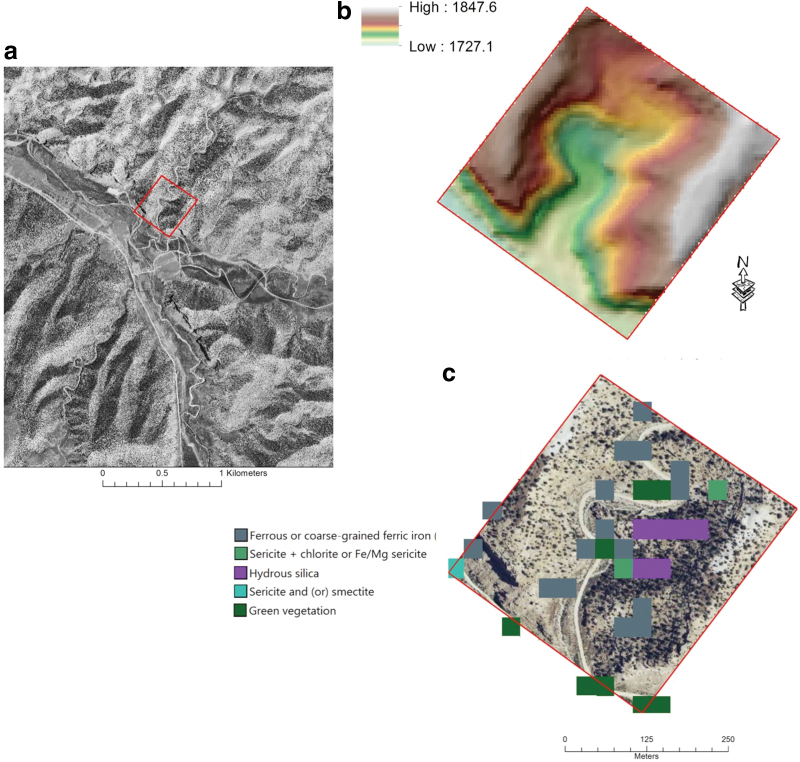
The Site Expert provided the field team with “orbital” data similar to what have been acquired for landed missions (Fig. 2). Orthorectified panchromatic 1 m/pixel images of the site were acquired from the Utah Geologic Survey to simulate color images from the HiRISE on the MRO. To mimic CTX resolution, visible wavelength images were provided over broader regions, coarsened to 5 m/pixel, and presented in grayscale (Fig. 2a). For elevation data, we used a US Geological Survey 30 m/pixel digital elevation model (DEM) degraded to 70 m/pixel over the region to simulate the digital terrain models from the High Resolution Stereo Camera. A high-resolution DEM and hillshade were created from HiRISE stereo pairs (images were provided by the Utah Geological Survey [UGS]). This DEM has a spatial resolution of 5 m/pixel and was overlain on a derived hillshade map with illumination from the northwest (Fig. 2b). Landsat 7 Thematic Mapper multispectral data were provided for the ROI to simulate CRISM spectroscopic data (Fig. 2c). These data were synthesized into a site map with multiple overlays; the field team utilized overlays to choose traverses that they believed would best meet the science objective of finding biologically relevant sampling locations. Initial hypotheses were limited by the nature of the data and the physical and compositional homogeneity of the site as well as its overall environs. The full GHOST team interpreted the stair-stepped patterns shown in Fig. 2b to be layers of differing erodibility. They agreed that the layered sequence of outcrops preserved a significant amount of history, but that the available data were not sufficient to limit the responsible formation processes (sedimentary or volcanic layers, impact ejecta, etc.). Traverses were thus designed to sample as many layers as possible, to construct a contextual understanding of the site, and to specifically identify and characterize layers produced by lacustrine (i.e., biologically supportive) versus other processes. The Linear and Walkabout Teams chose potential stations (locations where their “rover” would stop and acquire more detailed data) and designated notional traverses that connected those stations. Because each team chose different points at which to stop and acquire measurements, each team used different nomenclature to differentiate results.
FIG. 2.
Data of field site mimicking orbital data. (a) Visible wavelength, grayscale mosaic, coarsened to 5 m/pixel. CTX resolution. (b) Five meters per pixel DEM overlain on a derived hillshade with illumination from the northwest; high and low in meters. (c) Landsat 7 Thematic Mapper multispectral data simulating CRISM spectroscopic data; color key is to the left of the image. CRISM, Compact Reconnaissance Imaging Spectrometer for Mars; CTX, Context Camera; DEM, digital elevation model. Color images are available online.
4.2. Data acquisition and analysis in the field
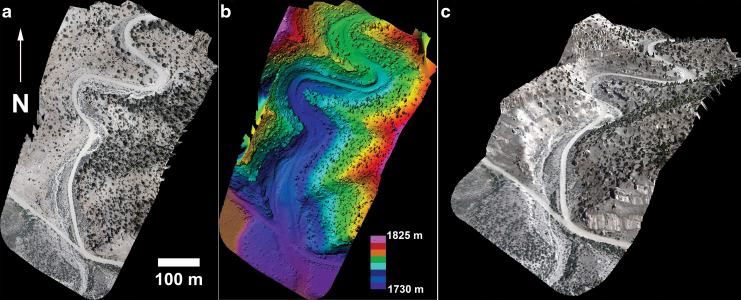
We utilized the data acquisition procedures, communications, and test fidelity protocols outlined by Yingst et al. (2016). The single adaptation to those protocols was the addition of the drone pilot to our science team, who took commands from both Science Teams, executing flights to test various potential uses of a rotocopter, including pretraverse reconnaissance and post-traverse detailed imaging (El-Maarry et al., 2018). Those results will be reported in a separate publication, but for this study, we note that the data products acquired of the site (Fig. 3) would have provided support for traverse planning had they been available during the fieldwork, thereby freeing up time and data volume for planning other observations.
FIG. 3.
(a) Georeferenced image mosaic for the field site at ∼3 cm/pixel, captured by the drone from an elevation of 100 m (with respect to starting point elevation). (b) Colorized elevation for the mapped region as derived from the produced DEM. (c) 3D view of the site. 3D, three-dimensional. Color images are available online.
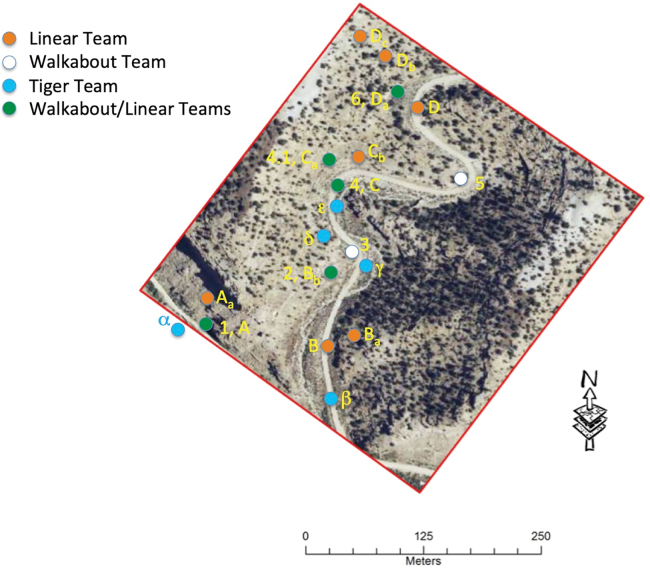
The Linear and Walkabout Teams initially followed their preplanned traverses, and data acquired during the traverse informed decisions to either maintain the planned traverse or to alter that plan, including adding previously unplanned stops or drive deviations. The final traverses followed by each team are shown in Fig. 4.
FIG. 4.
Stations where each team gathered data (colored circles). The number or letter for each station is also noted, as follows: Linear Team = letters; Walkabout Team = numbers; Tiger Team = Greek letters. Color images are available online.
Each team acquired imaging before and after every drive sol, with a single drive sol defined as traversing to the farthest point visible on previously acquired images, or 50–100 m, whichever was shorter. The Science Teams made an effort to determine whether the requested terrain would be reasonably traversable by a semiautonomous rover. However, without the data that would normally be provided by the engineers each sol, it was difficult to tell when terrain was untraversable until the rovers actually returned data, meaning that the rovers would need to traverse back and forth multiple times for one command cycle. Instead, to make the most efficient use of field time, if the rovers determined the terrain to be untraversable, the two Science Teamse accepted their judgment. Each team acquired additional imaging to choose areas for data collection and analysis by the TerraSpec and XRD instruments. The teams then used data from both these sources to infer the lithology of sampled rocks.
The number of estimated sols used by each team is described in Supplementary Tables S1 and S2 of the Supplementary Data. Sol cost was estimated based on the number of sols each set of observations would commonly require if run on Mars by MSL. Real time spent was highly variable, based on the terrain the “rovers” were required to cover and where in the traverse they were (thus feeding in to walk-back time); however, we note that ∼15–20 sols of activities were executed by the Rover Teams per day.
4.3. Baseline: Tiger Team results
The Tiger Team assessed the ROI using traditional field geology methods, unrestricted by the rover traversibility and the time-limited constraints faced by the Linear and Walkabout Teams. Their results provide a baseline against which the Linear and Walkabout Team results may be compared.
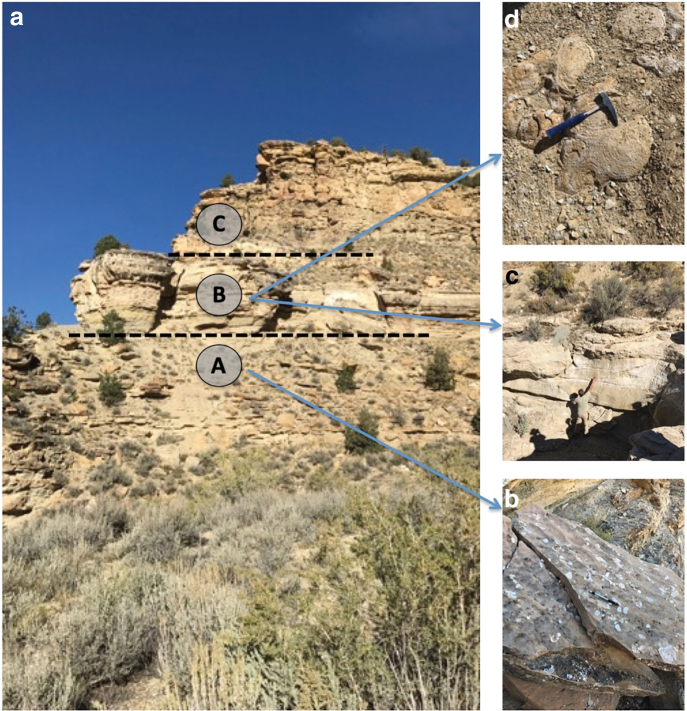
With the available remotely sensed orbital data, the Tiger Team first made reconnaissance observations to characterize the entire stratigraphic section. Additional stops were made along the way to acquire detailed outcrop- and hand lens-scale observations. Initial observations at Station α (Fig. 4) indicated the beds were approximately horizontal and laterally continuous, with frequent alternations between erosionally recessive and prominent resistant layers. At Station β, the Tiger Team separated the stratigraphic section into three primary zones (Zone A, Zone B, and Zone C) based on outcrop expressions (Fig. 5a). Basal Zone A was a reddish-brown package, composed of interbedded sandstone and shale horizons. Massive ∼1 m-thick sandstone beds were present at the base of the section. Sandstone lithologies were well sorted, well rounded, and grain supported. Upon closer inspection of in situ and float blocks near Station β, sedimentary structures including cross-bedding, channel cuts, ripple marks, and desiccation cracks were observed (Fig. 5b). A lack of effervescing from HCl testing indicated that beds did not contain carbonate. Beds fined upward and transitioned into shale that exhibited a variety of surface colors. XRD data on clay horizons indicated the presence of goethite/zeolite in red horizons and mixed compositions of phyllosilicates (likely jarosite, illite, smectite, and montmorillonite) in yellow horizons.
FIG. 5.
Tiger Team Station β. (a) Initial characterization of field site into three stratigraphic zones, as noted in Table 2. (b) Ripples and mudcracks in a float rock derived from Zone B above; pen for scale. (c) Well-sorted sandstone beds from Zone B, interpreted to be formed in a foreshore environment; person for scale. (d) Well-laminated dome from upper Zone B; rock hammer for scale. Color images are available online.
Based on the combination of outcrop lithologies and sedimentary structures, the Tiger Team interpreted Zone A to reflect fluvial to lacustrine environmental conditions with episodic subaerial exposure. The dominance of siliciclastic material in Zone A led to the interpretation that biosignature preservation at this locality was likely low.
Overlying Zone A, Zone B (Fig. 5c) was observed to contain multiple depositional cycles. These cycles were dominated by 2 to 3 m-thick massive gray-to-white cliff-forming beds at the base that transitioned into thinner <0.5 m-thick beds containing abundant microbialite structures. Investigations at Stations γ and δ led to further division of Zone B into three intervals.
Interval B1 was characterized at Station γ, a dissecting canyon just east of the main road. At its base, interval B1 contained thick planar laminated quartz sandstone beds (Fig. 5c). Grains within sandstone beds were well sorted and well rounded, and beds contained ripple laminations, interpreted as a foreshore (beach) environment. A distinct undulatory surface containing coarse chaotic siliciclastic material was observed along the top of the uppermost sandstone bed, indicating surface exposure, or a potential storm deposit. Just above this surface, thin laminations composed of ooids were observed.
At the top of the dissecting canyon and making up part of the road base, distinct laminated domes were observed (Fig. 5d) and interpreted as microbialite structures. These structures and overlying layers along the outcrop exposure comprised Interval B2, observed in detail at Station δ. Interval B2 microbialites exhibited a variety of morphologies, from massive and domal to digitate and columnar. Microbialite horizons were commonly truncated and filled in by ostracode grainstones, suggesting episodes of rapid burial by detrital input.
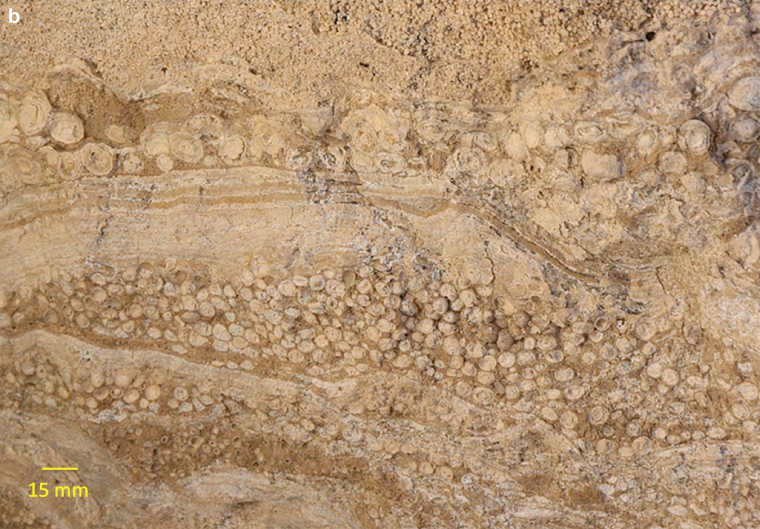
Interval B3 contained additional microbialite layers as well as interbedded mudstone and shale horizons. Interval B3 was best observed at Station ɛ. Repetitive microbialite–siliciclastic horizons were observed in the following sequence: (1) at the base, coarse horizons were present, overlain by thin laminated microbialites overlain by (2) columnar digitate microbialites, followed by (3) massive domal microbialites, and capped by (4) ooid horizons (Fig. 6, acquired up the road from Station ɛ).
FIG. 6.
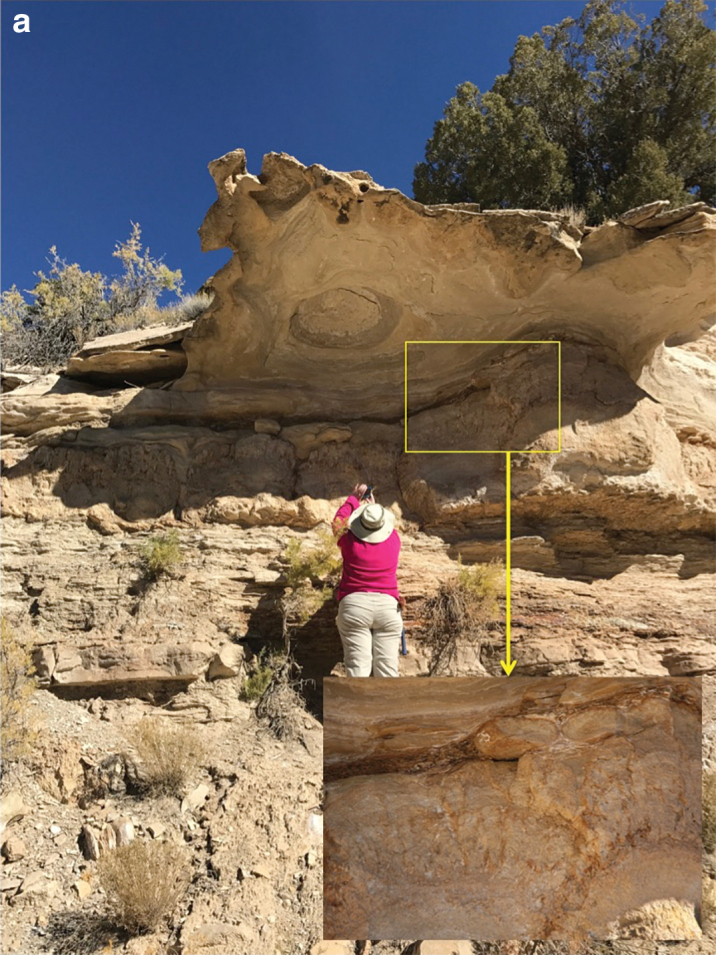
Tiger Team, Zone B horizon. (a) Domal microbialites, with remnant dome visible in the overhanging rock; person for scale. Inset shows a closeup of the area in the yellow box. (b) Ooids. Sizes range from <1 mm at the top of the image to ∼3 mm in the central portion, and 7–8 mm pisoids in the big layer. Color images are available online.
In general, the Tiger Team interpreted Zone B to represent a fluctuating lacustrine environment. The transition from sandstone lithologies near the base to muds at the top suggests transgressive/deepening events, affected locally by siliciclastic inputs. They interpreted coarse clastic horizons as storm events that ripped material up. This material likely served as a fresh growth substrate for microbialite communities that, over time, developed a diversity of growth morphologies that may have reflected changing environmental conditions (chemistry, salinity, etc.).
Zone C extends to the top of the section and the boundary of the ROI. In general, Zone C was a noticeably redder package of sandstone and mudstone beds, with several interbedded gray horizons. Bedding is generally thicker near the base of these packages, and thin upwards; beds are commonly discontinuous and difficult to trace laterally. Zone C was poorly accessible on foot and was primarily viewed from the road, so it was difficult to resolve fine-scale details. Obvious microbialites were not identified in Zone C, perhaps suggesting changing environmental conditions that did not favor their development.
4.4. Linear Team results
Before fieldwork, the team identified four key stations within the ROI, at the base of a steep cliff near the southwest edge (Station A), and at three evenly spaced spots along the valley floor (Stations B, C, and D). Station C was considered a particularly high priority for its potential for a panoramic view of the ROI. The team also identified points of interest near each station, such as outcrops or potentially accessible paths into the valley walls that would yield opportunities to divert from the original stations. The team chose to divert to such areas seven times (shown in Fig. 4 as stations with subscript letters, e.g., Ba).
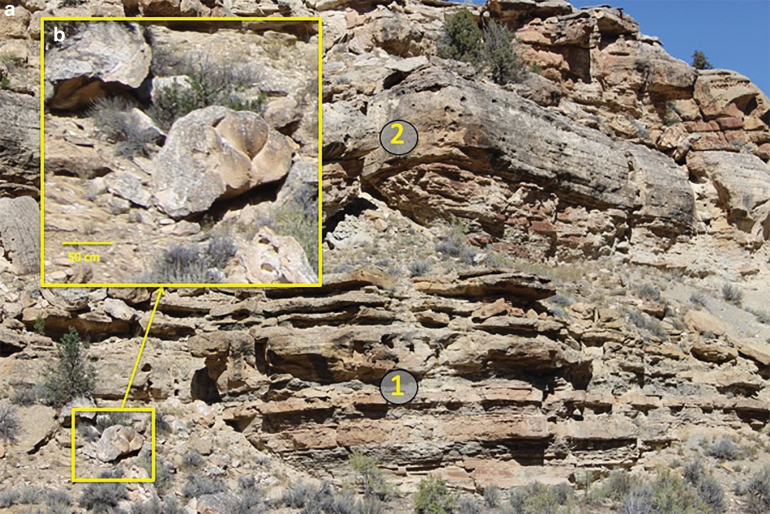
At Station A, a single-column ground-to-sky mosaic captured three units (Fig. 7a): a lower slope-forming unit with internal layering (unit 1); a middle gray massive unit with large vugs and purple staining on weathered surfaces (unit 2); and an upper tan cliff-forming unit with thin layers (unit 3). The units appeared to consist of detrital materials with layering and possible low-angle cross-beds, indicating traction deposition, and the team chose to approach the base of unit 2 to attempt to identify its lithology and examine the layered cliff-forming unit 3 above it.
FIG. 7.
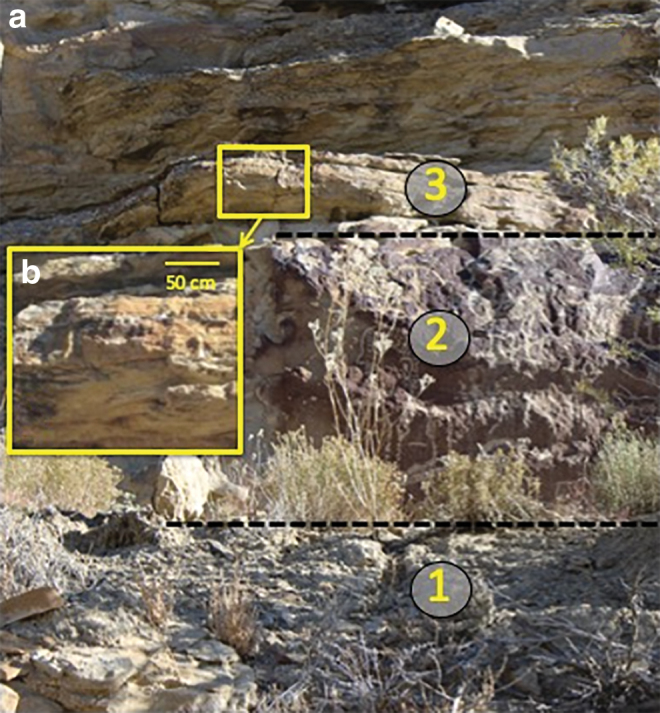
Linear Team Station A, corresponding to Zone A of Fig. 5. (a) Three units of Station A, numbered as noted in Section 4.4. (b) Centimeter-scale close-up of the boxed area at the interface of units 2 and 3. The vegetation in (a) is low scrub standing ∼30 cm high. Color images are available online.
Imaging at the base of unit 2 (Station Aa; Fig. 4) revealed similarities between units 2 and 3 (Fig. 7). Unit 2 exhibited lamination, at times wavy, throughout. Both units 2 and 3 had granular textures and contained oxyhydroxide and phyllosilicate materials, as determined from remote spectra. This led the team to tentatively identify strata as sandstone with thinner and thicker lamination, and perhaps intervals of coarser and finer grain size or greater or lesser cementation. These characteristics were interpreted as environments with low likelihood of habitability or preservation potential; thus, the team did not acquire further data or sample at this station.
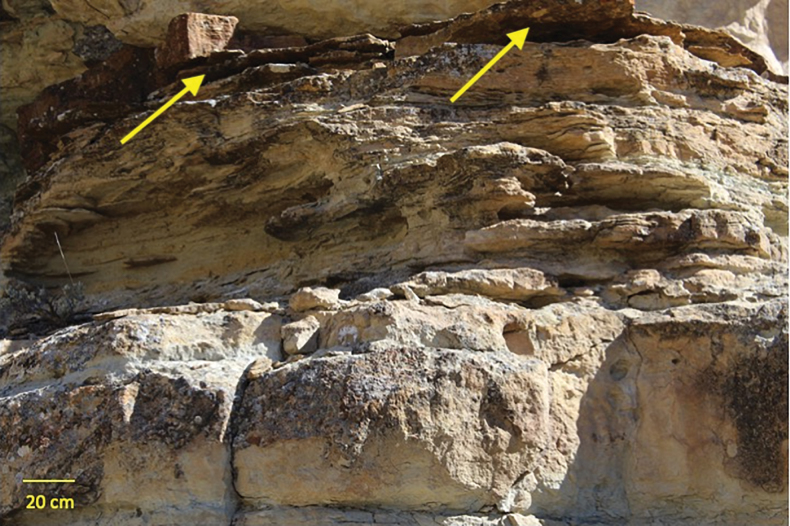
At Station B (Fig. 8), the team observed the same basic stratigraphy identified at Station A with some additional units. Unit 1 from Station A was more clearly exposed at Station B, exhibiting alternating resistant red/brown layers and recessive gray layers (Fig. 8a). On both sides of the valley, a dark thin apparently wavy layer was observed on top of unit 3 (Fig. 9). The team also identified float blocks along the valley walls with intriguing bulbous structures (Fig. 8b). The latter two features were visited for more in-depth investigation as Station Ba and Station Bb, respectively. Station Bb was located across the canyon from Station Ba; although the images were of sufficient resolution to note similar structures, the location was less accessible, so investigation occurred at Station Ba.
FIG. 8.
(a) Linear Team units 1 and 2 exposed at Station Bb as noted in Section 4.4, corresponding to Zone B in Fig. 5; vegetation is low scrub ∼30–40 cm high. (b) Station Bb: centimeter-scale close-up of boxed area in (a) showing bulbous structure and texture. Color images are available online.
FIG. 9.
Station Ba; dark thin apparently wavy layer (yellow arrows) atop unit 3, imaged at centimeter scale. Color images are available online.
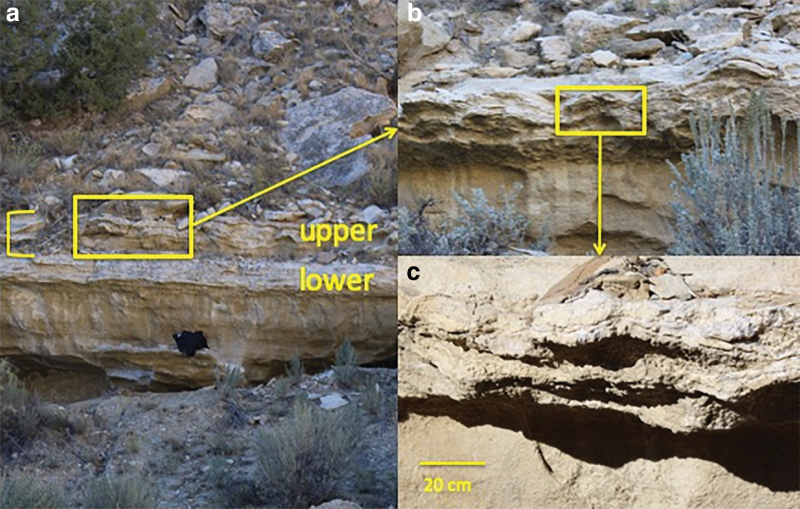
Upon closer examination at Station Ba, an example of the thin dark apparently wavy layer proved to be the same lithology as the rest of unit 3, but with greater induration (possibly resulting from enhanced cementation) and platy layering (Fig. 9). Its mineralogy (montmorillonite, goethite, and magnesium hydroxide) also resembled that measured from unit 3 at Station Aa. The darker color was imparted by a surface coating of varnish and lichen, which was ignored as a biogenic feature, similar to the treatment of grass, shrubs, and trees. Higher resolution imaging of an example of the bulbous structure and its grainy texture, similar to bedded and cross-bedded material (Fig. 8b), suggested it was a sandstone with potential spheroidal weathering, consistent with the siliciclastic textures and mineralogies examined elsewhere. This hypothesis turned out to be incorrect—the float rock was a carbonate microbialite. The granularity of the weathered surface mimicked the grainy appearance of sandstone, leading to the misdiagnosis. As at Station A, the lithologies investigated did not motivate the team to acquire a sample.
The team proceeded to Station C, where the team targeted two new lithologies that occurred stratigraphically above those at Stations A and B, as two new stops, Stations Ca and Cb. The first lithology was a chalky white horizon ∼1 m thick with no layering apparent in the lower half, but wavy layering in the upper half. The second was a gray-brown layered domal structure immediately above the chalky white horizon. Both contained calcite and gypsum.
The team moved closer to an outcrop in the Station C panorama as Station Ca, where the panorama showed that the “upper lithology” was more easily accessible. They acquired a mosaic along the chalky white horizon (Fig. 10) that included both the wavy layered and massive halves. The lower half exhibited little clear structure, with a potentially tufted or clotted texture, whereas the upper half was well laminated with a repetitive low domal structure and very fine laminations (at or <10 s of micrometer thick) (Fig. 10b). These observations led the team to hypothesize that the chalky white horizon represented a facies change from the predominantly detrital siliciclastic rocks at Stations A and B. The texture of the lower half was consistent with a tufa-like structure, whereas the layering of the upper half was plausibly a microbialite structure. Their mineralogy was consistent with these origins and might reflect a hot spring or lacustrine evaporite association.
FIG. 10.
Linear Team Station C, corresponding to Zone B of Fig. 5. (a) Two layers of Station C as noted in Section 4.4. The yellow brackets indicate the thickness of the layer that contains Station Ca. Black backpack for scale. (b) Station Ca: centimeter-scale close-up of boxed area in (a), showing wavy lamination; the different lighting conditions are due to the fact that the image was captured later in the day than (a). (c) Submillimeter-scale close-up of boxed area in (b) showing laminated texture. Color images are available online.
Given these promising observations, the team chose to conduct contact science focused on the laminated portion of the chalky white horizon. Images at centimeter to millimeter scale (mimicking Mastcam) and submillimeter scale (mimicking MAHLI or WATSON) provided detailed views of wavy and domal structures across the thin horizon, with multiple scales of domes present (Fig. 10c). Laminated textures with eggshell-like structures were interpreted as the tops of domes. The team judged this horizon to have high potential for biosignature preservation and hypothesized that the finely layered structure might, itself, be a microbialite; the mineralogy (calcite, dolomite, and quartz, with calcite > dolomite) supported a microbialite origin of the sample. Thus, the team chose to acquire its first sample from this horizon.
The team then moved laterally from Station Ca to Station Cb. The upper lithology at this station was distinct in its resistance and form compared with underlying beds, exhibiting repetitive laminated low domes within a larger composite domal structure. The weathering pattern of the structure (etched with laminae picked out by weathering) was different from the clastic rocks at Stations A and B, and it contained dolomite and Fe-smectite. A higher resolution mosaic captured another distinct layer above the domal structure, with high reflectivity, a clotted or tufa-like texture, and vertical fabric. The top of this layer was composed of bulbous structures like those at Station Bb. Its mineralogy included calcite, gypsum, goethite, and phyllosilicates (likely montmorillonite).
The team viewed the shape, weathering pattern, and reflectivity of the lithologies at Station Cb as consistent with chemical sedimentary rock, and the occurrence of dolomite more specifically potentially indicative of a microbialite facies. The team chose to sample the dolomite-bearing horizon at Station Cb to contrast with the more calcite-rich sample collected at Station Ca. The dolomite-bearing domal structure itself was not reachable by the rovers, but the panorama from Station C was used to identify where a laterally equivalent structure could be accessed by the rover for sampling.
The team then drove to Station D; this station showed alternating intervals of vuggy rock interpreted to be a sandstone similar to that recorded at Station Aa, and more resistant layered rock with wavy laminations. The latter were interpreted as microbialites given the nature of the wavy-laminated rocks at Station C. The repeating intervals and continuity of bedding suggested cyclical changes in environments associated with a standing body of water such as a lake or shallow sea, with sandstones and shales representing less shallow waters or intervals of higher detrital sediment supply, and microbialites representing potentially shallow-water intervals of lower sediment supply. The team considered this sufficient reason to bump to additional stations at this location, where the wavy layer might be accessible.
The team chose a float rock with multiple domes, apparently sourced from one of the wavy laminated layers (Station Da), acquiring a submillimeter-scale mosaic along two of the rock's faces in addition to remote mineralogy. These images revealed domes of varied morphologies (some flatter, some arcuate) with internal layering at multiple scales. Remote mineralogy indicated the presence of dolomite (±calcite) and phyllosilicate. The team chose not to acquire its third sample from this float rock, given its mineralogical similarity to the samples acquired at Station C, and with the promise of in-place examples in the stratigraphy above Station D.
To gain access to an in-place stromatolite horizon, the team acquired a vertical mosaic on the west side of the canyon. Two horizons were selected for further study, one approximately midway up the section (Station Db) and the other near the top of the section (Station Dc; Fig. 11). Mastcam workspace imaging at Station Db contained macroscale bulbous structures in the foreground and wavy laminated layers with smaller dome structures in the background. Observed textures resembled the dolomite-bearing horizon at Station Cb. Submillimeter-scale imaging and remote mineralogy confirmed the connection to Station Cb, showing a pitted etched texture and the presence of dolomite. With a dolomitic sample already in hand, the team elected to move to Station Dc.
FIG. 11.
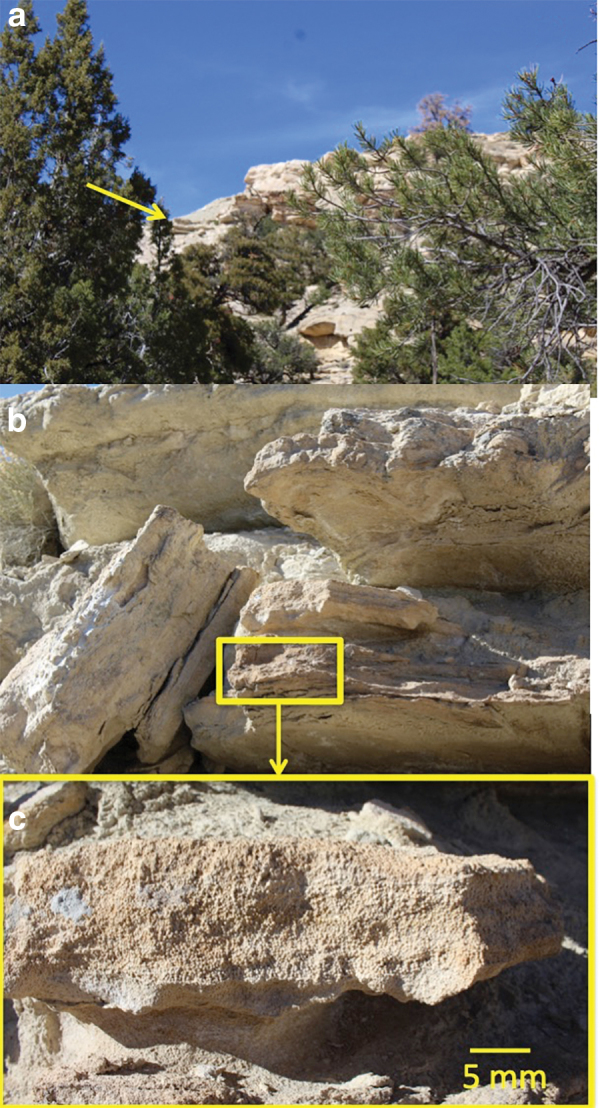
Linear Team Station Dc, corresponding to Zone B of Fig. 5. (a) Position of Station Dc, the highest accessible stromatolite-bearing layer. (b) Sequence of more- and less-resistant layers within Station Dc. (c) Submillimeter close-up of boxed area in (b), showing closely packed millimeter-scale calcite- and dolomite-bearing spheres (ooids). Color images are available online.
Millimeter-scale workspace imaging at Station Dc revealed alternating intervals between laminated (both wavy and flat) more resistant layers and more massive less resistant layers, exposing the bottoms of the wavy layers (Fig. 11b). These exposed surfaces exhibited multiple concavities. The massive layer had smooth tan-colored zones, which were hypothesized as clay-rich areas. The team acquired a submillimeter-scale image from one of the more resistant horizontally bedded horizons, which comprised smaller scale lamina of closely packed submillimeter-scale spheres (Fig. 11c). Intermittent flat-lying laminae were observed among the spheres. Remote mineralogy indicated the sphere-bearing bed contained calcite, dolomite, Fe-saponite, and gypsum. The team interpreted the spheres as within the family of oolitic, oncolitic, and pisolitic features, with the laminae representing either pauses in deposition or potential dissolution of layers. The only way to assess biogenicity of the spheres would be in thin section; thus, the team chose to acquire their final sample from this horizon.
4.5. Walkabout Team results
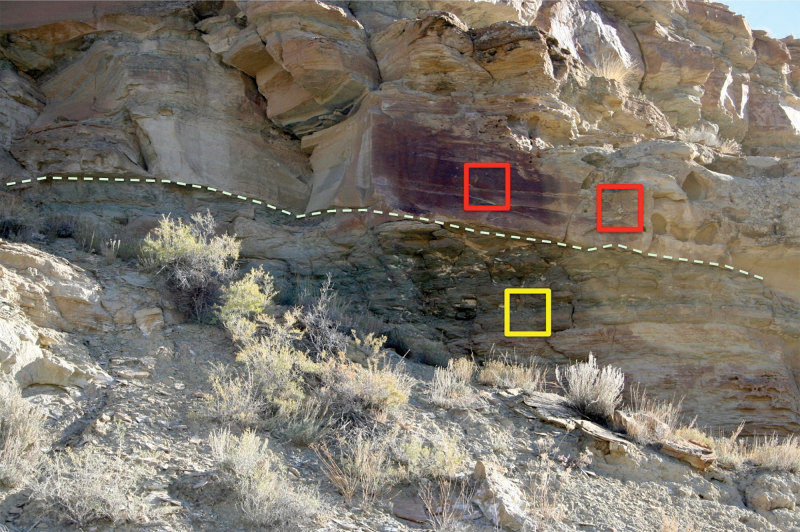
The Walkabout Team visited seven stations on their first loop through the planned traverse (Fig. 4). Six of these were initially planned using orbital data, and one (Station 4.1) was added based on data acquired during fieldwork. Station 1 was initially chosen as a vantage point that would allow close imaging of the vertical face of the canyon wall, as well as down the entire canyon. This allowed the team to immediately assess many of the layers in context as broad laterally consistent strata, alternating between more massive and more thinly bedded. Remotely acquired compositional data indicated that the beds contained goethite and phyllosilicate species (likely montmorillonite and illite), with other minerals. The team initially assessed these layers as fluvial sand bodies, with channel sands cutting into shaley deposits that may represent overbank muds. The team hypothesized that the shaley deposits were more likely than the cross-bedded sandstone to yield biosignatures (Fig. 12).
FIG. 12.
Walkabout Team Station 1, corresponding to Zone A of Fig. 5, showing massive (red boxes) and bedded (yellow box) layers, with the facies boundary shown as a dotted line. Boxes show locations where compositional data were acquired. Fine layers are cross cut by the massively bedded material. Vegetation is low scrub standing ∼20–30 cm high. Color images are available online.
The team then moved on to assess Station 2 (higher up section on the west side of the canyon) and Station 3 (near the base of the canyon), which added additional details to this initial assessment, including the presence of undulating surfaces that appeared to be traction bedforms, interbedded, decimeter-scale resistant sandstone units, and finely bedded friable shale. Compositions of goethite and phyllosilicate species indicated the continued presence of secondary minerals through the strata. Traction bedforms were consistent with the hypothesis of fluvial-channel overbank succession.
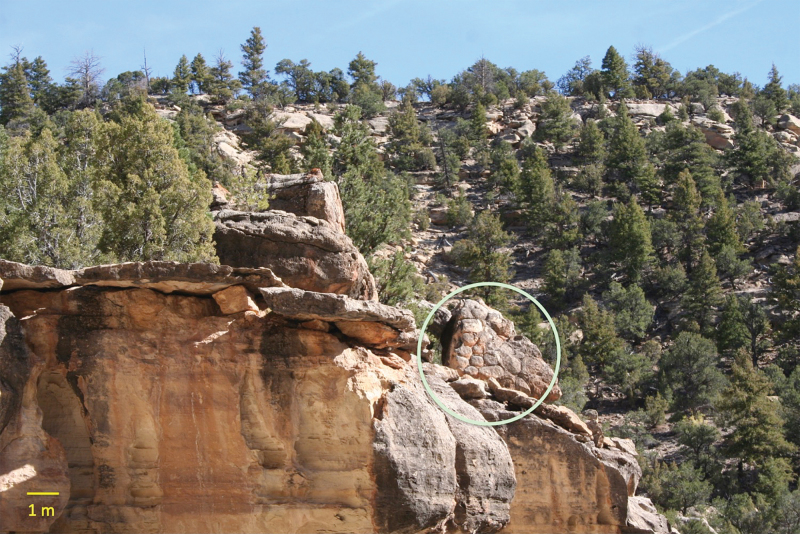
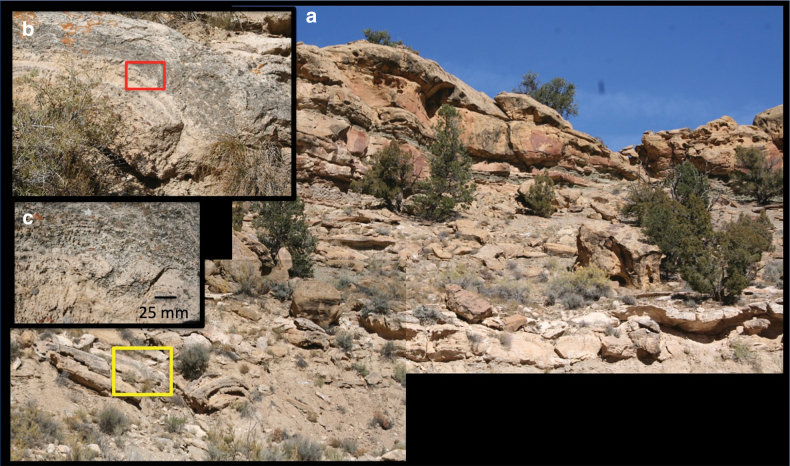
Images at Station 4 showed what appeared to be polygonal or rounded surface texture high on the canyon's west side and in float blocks; these were hypothesized to be either exhumed tops of microbialte features or potentially exhumed basal load structures (Fig. 13). These were confirmed by additional imaging on the east side of the canyon to be laterally linked domal features in individual layers, composed of dolomite. These layers became high-priority targets for contact science and sampling, and the observations led the Walkabout Team to add Station 4.1 to the Loop 1 itinerary. Domal features near the rover were investigated at this station; images showed 1 to 5 mm-thick laminae and a highly weathered surface texture, with a primarily dolomite composition (Fig. 14). The team hypothesized that these structures may have had finer-scale lamination, but the primarily dolomite mineralogy suggested that it experienced at least one stage of diagenesis that destroyed some of the primary fabric (though chemical details could potentially be preserved). The team had similar observations at Station 5, noting a stratigraphically higher bed with similar texture and composition as the domal beds observed at Station 4.1, but substantially browner.
FIG. 13.
Image from Walkabout Team Station 4 panorama. Features identified by the team as part of a potential microbialite facies are circled. Color images are available online.
FIG. 14.
(a) Partial mosaic of Walkabout Team Station 4.1, corresponding to Zone B of Fig. 5. The yellow box indicates the location where higher resolution images were acquired in loop 2. Vegetation stands ∼1 m high. (b) Close-up of part of the area in the yellow box in (a), showing millimeter-scale domal layered structures and millimeter-scale laminae. (c) Close-up of area in red box in (b), showing submillimeter-scale detail of laminae. Color images are available online.
At Station 6, the team observed thicker beds showing differential erosion and the presence of cavernous weathering in sandstone (e.g., tafoni). The team attempted to acquire compositional data, as a way to determine whether there were chemical differences present that could inform the erosive differences, but the instrument faulted out. However, the data acquired from Stations 3–5 provided the Walkabout Team with enough information to adjust their original plan of data acquisition, and their initial hypothesis. The team decided to move away from a detailed sampling of the entire stratigraphic package, toward carefully sampling those units where biological features (identified by morphology) were likely to be present and preservation potential was high. In terms of a facies model, the data did not contain as many channels as might be expected from a purely fluvial system. Instead, the site was increasingly dominated by alternating shale and sand facies of uniform thickness and generally flat lamination. The team thus changed their working hypothesis to a fluvial system that emptied into a persistent body of water, such as a lake or sea. In such a system, channels provide sediment and energy from outside the basin, but deposition occurs under dominantly lower energy environments, as the flow loses energy when reaching a body of water. In such an environment, clay-dominated deposition would represent persistent quiescent water and would have reasonable preservation potential for organic materials. Based on this new assessment of the data from loop 1, the Walkabout Team chose Stations 2, 3, 4.1, and 5 for contact science (loop 2), and adopted a sampling protocol that would include choosing from loop 2 at least two locations where the domal structures could be sampled, and at least one location where the team could sample the shaley unit. For the sake of efficiency, as soon as analysis of loop 2 data was completed for a given station, the Walkabout Team made a determination as to whether to acquire a sample there. This negated the need to physically execute a loop 3, although the number of sols required to execute loop 3 was book-kept in the sol path (Supplementary Table S2). In executing loop 2, progress was hindered because slopes on both sides were very steep. It was not feasible for the rover to reach many of the layers, meaning targeted stratigraphic analysis of most or all individual layers was precluded. However, little variation in mineralogy was indicated between stratigraphic horizons, so the team inferred from this that one layer would be relatively indicative of similar appearing layers in the sequence.
On loop 2, the team reassessed Station 2 with additional high-resolution imaging of surficial textures of the beds present; these were interpreted to be ripple marks, supporting the presence of at least some beds that represented aqueous deposition. Mineralogical data indicated a composition of >95% silica (quartz sand). The coarser grain size of this sandstone bed was determined to be of lower preservation potential than shale beds, and with no clear evidence of physical biosignatures, no sample was acquired.
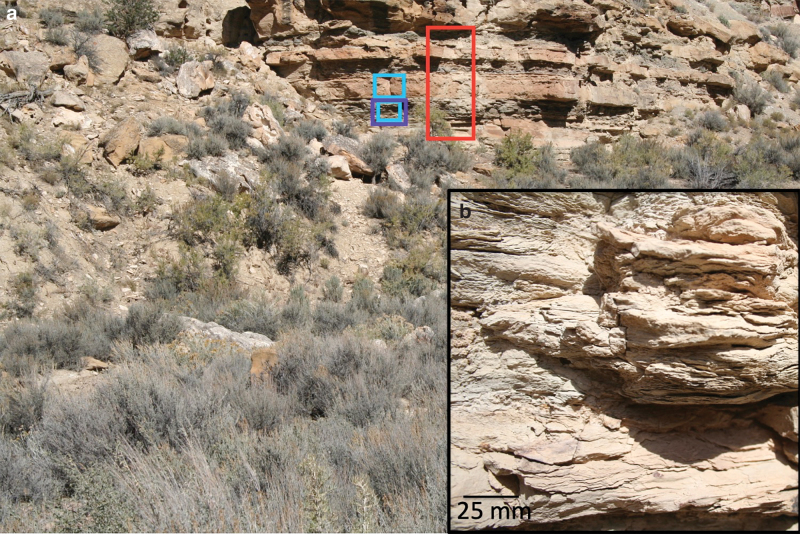
For Station 3, submillimeter-scale imaging showed thin flaky tan materials with millimeter-scale laminations, clearly indicative of shale, alternating with sandstone beds (Fig. 15). A composition primarily of quartz and albite with minor to trace zeolite (analcime) was consistent with this interpretation. A sample was acquired of this layer.
FIG. 15.
Walkabout Team Station 3, corresponding to Zone B of Fig. 5. (a) Alternating layers of shale and sandstone. Boxes indicate where spectroscopic data (red box) and compositional data (blue boxes) were acquired. The purple box indicates the area where images at submillimeter scale were acquired. (b) Close-up of shaley horizon in the purple box, showing detail of laminae. Color images are available online.
Stations 4.1 (Fig. 14) and 5 both showed finely laminated (submillimeter to millimeter-scale) domal structures of a primarily dolomite or mixed dolomite and calcite mineralogy (with some surficial gypsum). There may have been finer-scale lamination, but the primarily dolomite mineralogy may indicate the layer experienced at least one stage of diagenesis that could have destroyed some of the primary fabric. The mesoscale structure, the micromorphology of laminae, and the composition, all supported the interpretation that these formations are microbial features. The team acquired samples of both layers; the team felt this variety was important to allow interpretation of the layers and understand them in the context of temporal environmental changes.
4.6. Summary of results
The general findings of each team are compared in Table 1. Both the Linear and Walkabout Teams identified the ancient environment as an aqueous environment that experienced diagenetic change; both identified and sampled biosignatures. The two key differences between team findings flow from the strategy chosen for sampling, and the understanding of how each layer fits into a coherent whole; both of these differences stem from the fact that the Walkabout Team had more contextual information to utilize early in the process when determining follow-on contact science, and more time in which to analyze and integrate that information into a more nuanced geological story.
Table 1.
Team Findings
| Findings of the Linear Team | Findings of the Walkabout Team | Findings of the Tiger Team |
|---|---|---|
| Environment sampled was aqueous | Environment sampled was aqueous | Environment sampled was aqueous |
| Diagenetic change occurred | Diagenetic change occurred | Diagenetic change occurred |
| Biosignatures (microbialites) identified | Biosignatures (microbialites and shales) identified | Biosignatures (microbialites, shales, and fossils) identified |
| Sampled oolitic grainstone, stromatolite, stromatolite with ooids | Sampled weathered shale, stromatolite, oolite | n/a |
| Contextual understanding focused on the stromatolitic period | Contextual understanding focused on periods before, during, and after the stromatolitic period | Contextual understanding focused on periods before, during, and after the stromatolitic period |
5. Results
A consistent difficulty in assessing the effectiveness of science operations methods is defining quantitative ways to judge the results of those methods. This is because the assumption that there is one right answer—or in this case, one ideal set of samples—is at odds with the open-ended nature of the scientific process. To provide meaningful results within these fundamental constraints, we divided our rating of each team's results into a more quantitative and a more qualitative appraisal. Specifically, we compared the estimated time spent by each team in attaining their results, and then assessed qualitatively how effectively that time was spent.
For quantitative assessment, we compared the estimated sol cost for the Linear and Walkabout Teams' activities. Both methods allowed similar characterization and interpretation of the general geological history of the site, as enumerated in Table 1, thus suggesting direct comparison is valid. Such comparison shows that, although each team covered approximately the same ground, the walkabout method yielded a >25% savings in sols, taking 37 sols to execute compared with the 50 sols required by the linear approach. This time saving is consistent with the results from similar previous tests (Yingst et al., 2014, 2016). In the study presented here however the region of study was half the size of the previous sites. We surmise that this is the reason the ratio of walkabout to linear sols is even lower for this test (0.74) than for the previous test (0.81); the smaller area meant that the Walkabout Team required fewer sols to retrace steps in multiple loops.
In terms of qualitative assessment of our activities, in comparison with previous sites studied (Yingst et al., 2014, 2016), the point of tension was not whether biosignatures could be found (as they were abundant), but how the decision-making process impacted the science products, including interpretations of the site and the samples, and the value of the sample suites themselves. Thus, to assess the effectiveness of how each team used their time, we estimated science productivity by answering the following questions: (1) To what extent did each team recognize the paleoenvironmental habitability potential and history of water at the site? (2) How did this information influence the decision of where to collect samples? (3) How did this information influence the observational plan as executed?
To answer the first question, we compared the summary observations and interpretations of each team with that of the Tiger Team (Table 2). Each team was able, with the data they gathered, to identify the lowest two of three facies identified by the Tiger Team; the third highest facies remained unexplored by both teams due to time constraints and traversibility challenges. Both teams were also able to identify and sample two biosignature-bearing layers (carbonate grainstone and microbialite layer), whereas the Walkabout Team also sampled a potentially organic-bearing shaley layer in facies 2. We note that both teams approached the site with the same initial observation—a 360° panorama. This underlines the importance both teams placed on context as the starting point for all other observations and analyses.
Table 2.
Comparison of Team Observations and Interpretations
| Geological history of site | Tiger Team designation | Stations associated with facies | Linear Team | Walkabout Team |
|---|---|---|---|---|
| Facies 1: Medium- to fine-grained sandstone | Zone A | A, Aa, B; 1, 2 (lower) | Identified in the field, not sampled | Identified in the field, not sampled |
| Facies 2: Organic-poor and organic-rich claystone and mudstone, carbonate grainstone (ooids, peloids, and oncolites), microbialite (stromatolites to thrombolites) | Zone B | Ba, Bb, C, Ca, Cb, D, Da, Db, Dc; 2 (upper), 3, 4, 4.1, 5, 6 | Sampled carbonate grainstone, two microbialites | Sampled organic-rich shale, carbonate grainstone, microbialite |
| Facies 3: Organic-rich carbonate mudstone with hypersaline precipitate minerals | Zone C | None | Not identified, not sampled | Not identified, not sampled |
With regard to the second question, how the data influenced the decision of where to collect samples, the Walkabout Team acquired a broader diversity of sample types by design than the Linear Team. Both the Linear and Walkabout Teams encountered a shale bed early in the traverse. Although the Linear Team spent several sols gathering data to determine whether and how to spend resources on this unit before moving on, the Walkabout Team was able to gather imaging and spectroscopic data and study them while moving to the next stop, knowing that they would be able to return later if a return was warranted. While data were being gathered at other stops, the Walkabout Team noted the lack of strong variation in mineralogy among stratigraphic horizons and found convincing evidence of microbially driven activities. With the conclusion that it would be unlikely that life would flourish in a single bed and nowhere else given the overall geological history of the site, the team changed their sampling strategy to sample both regions that they interpreted as macroscopically revealing biological activity, and to also sample places that had other promising lithologies, even though no macroscopic evidence was observed, specifically the potentially organic-rich dark shale. This provided an additional dimension of the sequence of facies, yielding environmental and biosignature context as a function of time. As a result, the Walkabout Team's sample collection could be more confidently extrapolated to past regional as well as local history.
With respect to the third question, how data influenced the observational plan as executed, both teams executed all planned stations, and both teams added additional stations, deciding to do so based on contextual information gathered from prior stations. Both teams also chose their initial stations, in part, based on where they believed they would be able to gather the most salient data to inform the choice of additional stations diverging from their original planned traverse. However, although the amount and extent of contextual information provided by each method were similar, that contextual information was acquired earlier in the process for the walkabout approach, so those team members had more time to discuss results before having to make sampling decisions. This led to greater confidence in choosing when, as well as where, to acquire a sample. By contrast, the team executing the linear approach was hard-pressed to make sample/no-sample decisions with the data in hand. In the example already noted, the Walkabout Team made the determination much earlier that biosignatures were abundant throughout multiple facies, so they were comfortable sampling both layers containing clear biosignatures, plus a layer that was more ambiguous but provided a richer picture of the geological context of habitability in the location. By contrast, the Linear Team acquired samples each time they detected a confirmed biosignature, because each time they were uncertain if it would be the last time they would see them. Similarly, the Walkabout Team chose to spend far less time at Station 6, their last stop, than did the Linear Team, because the data in hand were felt to be sufficient to indicate it would not yield significant new information regarding habitability. The Linear Team, in contrast, added three substations associated with Station D, more than at any other of their originally planned stations, despite the fact that Station D was also their last stop and so their contextual knowledge of the site would presumably have been similar. By comparison, the Tiger Team providing the standard results did not stop at Station D/6 at all. This result suggests that either the linear approach provided inadequate context to make a decision about this station similar to the decision that would have been made using standard geological field methods, or the linear approach promoted more significance being applied to a last station because of its order in the traverse rather than its scientific value. Specifically, the linear approach may have fostered the perception or concern that something had been missed.
Finally, we note that, in this particular field location, strata were encountered by both teams in stratigraphic order—oldest horizons first—and we speculate that a walkabout approach might be particularly important if localities were either structurally complex or if they were encountered in a nonstratigraphic sequence.
6. Conclusions
Results from this comparison of the linear and walkabout data acquisition approaches fully confirm previous results showing that geological context, provided as early as possible during the mission, saves mission time, yields more time for the science team to perform in-depth analysis of data in-hand, and conserves resources associated with contact science and sampling. We make the following recommendations for using the walkabout approach efficiently in a smaller ROI.
-
(1)
Context remains the most crucial factor in the ability of a science team to make rapid, efficient, and scientifically robust observation decisions. More efficient tools and better record keeping were employed in this study compared with previous efforts (Yingst et al., 2011, 2014, 2016), but although these were judged by the teams to add convenience in choosing observations and strategies, all were perceived to be secondary to the ability to gain a contextual understanding of the site as early in the process as practicable. In this study, as in others, more comprehensive context yielded more time, and more data, to feed into science discussions, making them more meaningful as well as more efficient. Thus, we continue to recommend that where practical, missions invest the resources in time, technology, and personnel to formally organize rover operations around ROIs in which the walkabout method is employed.
-
(2)
As a corollary to this, we note that in determining sample acquisition locations in particular, the teams agreed that the two most important (and related) variables were context, and time for the science team to develop reasonable hypotheses that improved confidence in the nature and significance of the samples required. In the former case, a lack of contextual information in the form of remotely acquired data early in the process impacted the breadth of samples acquired (samples had to be acquired by the Linear Team without knowing the likelihood of a more biologically relevant sample being available further along the traverse). In the latter case, the Walkabout Team had time during loop 1 data acquisition to refine sampling strategies based on maturing hypotheses, whereas the Linear Team did not. Thus, we recommend that for rover missions where choosing biologically relevant samples is a high priority, the walkabout method should be given particular consideration for its ability to free up time for hypotheses to be debated, and sample selection strategies to be refined.
-
(3)
One unavoidable time sink of the walkabout method is the time spent retracing steps in multiple loops. Employing the walkabout method in smaller ROIs (a few hundred square meters or so) may improve science return to a greater extent than employing it in a larger ROI, since a smaller ROI requires fewer sols to traverse in multiple loops or to survey initially. We thus recommend the size of the ROI be taken into account when determining the exploration approach to be used.
Supplementary Material
Acknowledgments
The authors thank Drs. Irene Antonenko, Liz Rampe, and an anonymous reviewer for their thoughtful and careful reviews of this article. Figures for the Supplementary Data were drafted by Cheryl Gustin and Lori Steadman of the Utah Geological Survey (UGS). The Supplementary Data were reviewed by Stephanie Carney and Michael Hylland of the UGS.
Abbreviations Used
- APXS
Alpha Particle X-ray Spectrometer
- CRISM
Compact Reconnaissance Imaging Spectrometer for Mars
- DEM
digital elevation model
- GHOST
GeoHeuristic Operational Strategies
- HiRISE
High-Resolution Imaging Science Experiment
- MAHLI
Mars Hand Lens Imager
- MRO
Mars Reconnaissance Orbiter
- MSL
Mars Science Laboratory
- ROI
region of interest
- UGS
Utah Geological Survey
- WATSON
Wide Angle Topographic Sensor for Operations and eNgineering
- XRD
X-ray diffractometer
Author Disclosure Statement
No competing financial interests exist.
Funding Information
This study was funded by the National Aeronautics and Space Administration Planetary Science and Technology from Analog Research program (Grant No. NNX15AI89G) and the National Science Foundation (SNSF Grant No. P300P2_164628). Additional support was provided by the Utah Geological Survey.
Supplementary Material
References
- Arvidson R.E., Squyres S.W., Baumgartner E.T., Schenker P.S., Niebur C.S., Larsen K.W., Seelos F.P., IV, Snider N.O., and Jolliff B.L. (2000) FIDO prototype Mars rover field trials, Black Rock Summit, Nevada, as test of the ability of robotic mobility systems to conduct field science. J Geophys Res 107:FIDO 2-1–FIDO 2-16 [Google Scholar]
- Arvidson R.E., Squyres S.W., Bell J.F. III, Catalano J.G., Clark B.C., Crumpler L.S., de Souza P.A. Jr., Fairén A.G., Farrand W.H., Fox V.K., Gellert R., Ghosh A., Golombek M.P., Grotzinger J.P., Guinness E.A., Herkenhoff K.E., Jolliff B.L., Knoll A.H., Li R., McLennan S.M., Ming D.W., Mittlefehldt D.W., Moore J.M., Morris R.V., Murchie S.L., Parker T.J., Paulsen G., Rice J.W., Ruff S.W., Smith M.D., and Wolff M.J. (2014) Ancient aqueous environments at Endeavour crater, Mars. Science 343:6169. [DOI] [PubMed] [Google Scholar]
- Beegle L.W., Wilson M.G., Abilleira F., Jordan J.F., and Wilson G.R. (2007) A concept for NASA's Mars 2016 astrobiology field laboratory. Astrobiology 7:545–577 [DOI] [PubMed] [Google Scholar]
- Beegle L., Bhartia R., White M., DeFlores L., Abbey W., Moore J., Fries M., Burton A., Edgett K.S., Ravine M.A., Hug W., Reid R., Nelson T., Clegg S., Wiens R., Asher S., and Sobron P. (2015) SHERLOC, scanning habitable environments with Raman and luminescence for organics and chemicals. In Institute of Electrical and Electronics Engineers Aerospace Conference Proceedings, IEEE, Big Sky, MT, March 7–14, 2015 [Google Scholar]
- Bell J.F. III, Maki J.N., Mehall G.L., Ravine M.A., and Caplinger M.A.; Mastcam-Z Team. (2016) Mastcam-Z: designing a geologic, stereoscopic, and multispectral pair of zoom cameras for the NASA Mars 2020 rover [abstract 4126]. In 3rd International Workshop on Instrumentation for Planetary Missions Abstracts, Pasadena, CA [Google Scholar]
- Black S.R. and Hynek B.M. (2018) Characterization of terrestrial hydrothermal alteration products with Mars analog instrumentation: implications for current and future rover investigations. Icarus 307:235–259 [Google Scholar]
- Cohen B.A. (2012) Science operations during planetary surface exploration: desert-RATS tests 2009–2011. In 3rd Conference on Terrestrial Mars Analogues Proceedings, Tangiers, Morocco [Google Scholar]
- Eby D.E., Chidsey T.C. Jr., and Vanden Berg M.D. (2012) Microbial carbonates from core and outcrop, Tertiary (Eocene) Green River Formation, Uinta Basin, Utah. In American Association of Petroleum Geologists Annual Convention and Exhibition Proceedings, Long Beach, CA, April 22–25, 2012 [Google Scholar]
- Edgett K.S., Yingst R.A., Ravine M.A., Caplinger M.A., Maki J.N., Ghaemi F.T., Schaffner J.A., Bell J.F., Edwards L.J., Herkenhoff K.E., Heydari E., Kah L.C., Lemmon M.T., Minitti M.E., Olson T.S., Parker T.J., Rowland S.K., Schieber J., Sullivan R.J., Sumner D.Y., Thomas P.C., Jensen E.H., Simmonds J.J., Sengstacken A.J., Willson R.G., and Goetz W. (2012) Curiosity's Mars Hand Lens Imager (MAHLI) Investigation. Space Sci Rev170:259–317 [Google Scholar]
- El-Maarry M.R., Black S.R., Hynek B.M., and Yingst R.A. (2018) Testing operational strategies for a potential Mars helicopter using a commercial drone [abstract 2326]. In 49th Lunar and Planetary Science Conference Abstracts, Lunar Planetary Institute, Houston [Google Scholar]
- Eppler D.B., Adams B., Archer D., Baiden G., Brown A., Carey W., Cohen B., Condit C., Evans C., Fortezzo C., Garry B., Graff T., Gruener J., Heldmann J., Hodges K., Hörz F., Hurtado J., Hynek B., Isaacson P., Juranek C., Klaus K., Kring D., Lanza N., Lederer S., Lofgren G., Marinova M., May L., Meyer J., Ming D., Monteleone B., Morisset C., Noble S., Rampe E., Rice J., Schutt J., Skinner J., Tewksbury-Christle C., Tewksbury B.J., Vaughan A., Yingst A., and Young K. (2013) Desert Research and Technology Studies (DRATS) 2010 science operations: operational approaches and lessons learned for managing science during human planetary surface missions. Acta Astronaut 90:224–241 [Google Scholar]
- Fong T., Abercromby A., Bualat M.G., Deans M.C., Hodges K.V., Hurtado J. Jr., Landis R., Lee P., and Schreckenghost D. (2010) Assessment of robotic recon for human exploration of the Moon. Acta Astronaut 67:9–10 [Google Scholar]
- Graham L.D., Yingst R.A., Graff T., ten Kate I.L., and Russell P. (2015) Moon Mars analog mission activities on Mauna Kea, Hawai'i. Adv Space Res 55:2405–2413 [Google Scholar]
- Grant J.A., Irwin R.P., and Wilson S.A. (2010) Aqueous depositional settings in Holden crater, Mars. In Lakes on Mars, edited by Cabrol N. and Grin E.A., Elsevier Science, Amsterdam, Netherlands, pp 323–346 [Google Scholar]
- Greeley R., Basilevsky A.T., Kuzmin R.O., Stoker C.R., and Taylor G.J. (1994) Science results from the Marsokhod tests, Amboy lava field, California. Paper presented at the International Planetary Rover Symposium, Moscow, Russia, May 1994 [Google Scholar]
- Grotzinger J.P., Gupta S., Malin M.C., Rubin D.M., Schieber J., Siebach K., Sumner D.Y., Stack K.M., Vasavada A.R., Arvidson R.E., Calef F. III, Edgar L., Fischer W.F., Grant J.A., Griffes J., Kah L.C., Lamb M.P., Lewis K.W., Mangold N., Minitti M.E., Palucis M., Rice M., Williams R.M.E., Yingst R.A., Blake D., Blaney D., Conrad P., Crisp J., Dietrich W.E., Dromart G., Edgett K.S., Ewing R.C., Gellert R., Hurowitz J.A., Kocurek G., Mahaffy P., McBride M.J., McLennan S.M., Mischna M., Ming D., Milliken R., Newsom H., Oehler D., Parker T.J., Vaniman D., Wiens R.C., and Wilson S.A. (2015) Deposition, exhumation, and paleoclimatology of an ancient lake deposit, Gale Crater, Mars. Science 350:aac7575. [DOI] [PubMed] [Google Scholar]
- Hamilton V.E., Hoehler T., Eigenbrode J., Rafkin S., Withers P., Ruff S., Yingst R.A., Lim D., Whitley R., Beaty D.W., Diniega S., Hays L., and Zurek R. (2015) Mars Scientific Goals, Objectives, Investigations, and Priorities: Mars Exploration Program Analysis Group (MEPAG) White Paper. Available online at http://mepag.nasa.gov/reports/MEPAG_Goals_Document_2010_v17.pdf Last accessed January16, 2020. [Google Scholar]
- Lee P., Braham S., Boucher M., Schutt J.W., Briggs G., Glass B., Gross A., Hine B., McKay C.P., Hoffman S.J., Jones J.A., Berinstain A., Comtois J.-M., Hodgson E., and Wilkinson N. (2007) Haughton-Mars Project: 10 years of science operations and exploration systems development at a Moon/Mars analog site on Devon Island, High Arctic [abstract 2426]. In 38th Lunar and Planetary Science Conference Abstracts, Lunar Planetary Institute, Houston [Google Scholar]
- Lim D.S.S., Abercromby A.F.J., Kobs Nawotniak S.E., Lees D.S., Miller M.J., Brady A.L., Miller M.J., Marmalek Z., Sehlke A., Payler S.J., Stevens A.H., Haberle C.W., Beaton K.H., Chappell S.P., Hughes S.S., Cockell C.S., Elphic R.C., Downs M.T., and Heldmann J.L.; the BASALT Team. (2018) The BASALT research program: designing and developing mission elements in support of human scientific exploration of Mars. Astrobiology 19:245–259 [DOI] [PMC free article] [PubMed] [Google Scholar]
- Malin M.C., Caplinger M.A., Edgett K.S., Ghaemi T.F., Ravine M.A., Schaffner J.A., Baker J.M., Bardis J.D., DiBiase D.R., Maki J.N., Ghaemi F.T., Wilson R.G., Bell J.F., Dietrich W.E., Edwards L.J., Hallet B., Herkenhoff K.E., Heydari E., Kah L.C., Lemmon M.T., Minitti M.E., Olson T.S., Parker T.J., Rowland S.K., Schieber J., Sullivan R.J., Sumner D.Y., Thomas P.C., and Yingst R.A. (2010) The Mars Science Laboratory (MSL) Mast-mounted cameras (Mastcams) flight instruments [abstract 1123]. In 41st Lunar and Planetary Science Conference Abstracts, Lunar Planetary Institute, Houston [Google Scholar]
- Mueller R.P., Cox R.E., Ebert T., Smith J.D., Schuler J.M., and Nick A.J. (2013) Regolith Advanced Surface Systems Operations Robot (RASSOR). In Institute of Electrical and Electronics Engineers Aerospace Conference Proceedings, IEEE, Big Sky, MT, March 2–9, 2013 [Google Scholar]
- Osinski G., Battler M., Caudill C.M., Francis R., Haltigin T., Hipkin V.J., Kerrigan M., Pilles E.A., Pontefract A., Tornabene L.L., Allard P., Bakambu J.N., Balachandran K., Beaty D.W., Bednar D., Bina A., Bourassa M., Cao F., Christoffersen P., Choe B.-H., Cloutis E., Cote K., Cross M., D'Aoust B., Draz O., Dudley B., Duff S., Dzanba T., Fulford P., Godin E., Goordial J., Galofre A.G., Haid T., Harrington E., Harrison T., Hawkswell J., Hickson D., Hill P., Hinnis L., King D., Kissi J., Laughton J., Li Y., Lymer E., Maggiori C., Maloney M., Marion C.L., Maris J., Mcfadden S., McLennan S.M., Mittelholz A., Morse Z., Newman J., O'Callaghan J., Pascual A., Patel P., Picard M., Pritchard I., Poitras J.T., Ryan C., Sapers H., Silber E.A., Simpson S., Sopoco R., Svensson M., Tolometti G., Uribe D., Wilks R., Williford K.H., Xie T., and Zylberman W. (2019) The CanMars Sample Return analogue mission. Planet Space Sci 166:110–130 [Google Scholar]
- Rice M.S., Bell J.F. III, Gupta S., Warner N.H., Goddard K., and Anderson R.B. (2013) A detailed geologic characterization of Eberswalde crater, Mars. Mars 8:15–59 [Google Scholar]
- Rosenberg M.J., Birgenheier L.P., and Vanden Berg M.D. (2015) Facies, stratigraphic architecture, and lake evolution of the oil shale bearing Green River Formation, Eastern Uinta Basin, Utah. In Stratigraphy and Paleolimnology of the Green River Formation, Western USA, edited by Smith M.E., and A.R. Carroll, Springer Nature, Switzerland, pp 211–249 [Google Scholar]
- Sanders G.B. and Larson W.E. (2015) Final review of analog field campaigns for In Situ Resource Utilization technology and capability maturation. Adv Space Res 55:2381–2404 [Google Scholar]
- Schon S.C., Head J.W. III, and Fassett C.I. (2012) An overfilled lacustrine system and progradational delta in Jezero crater, Mars: implications for Noachian climate. Planet Space Sci 67:28–45 [Google Scholar]
- Stoker C. (1998) The search for life on Mars: the role of rovers. J Geophys Res 103:28557–28575 [Google Scholar]
- Stoker C.R., Cabrol N.A., Roush T.R., Moersch J., Aubele J., Barlow N., Bettis E.A. III, Bishop J., Chapman M., Clifford S., Cockell C., Crumpler L., Craddock R., De Hon R., Foster T., Gulick V., Grin E., Horton K., Hovde G., Johnson J.R., Lee P.C., Lemmon M.T., Marshall J., Newsom H.E., Ori G.G., Reagan M., Rice J.W., Ruff S.W., Schreiner J., Sims M., Smith P.H., Tanaka K., Thomas H.J., Thomas G., and Yingst R.A. (2001) The 1999 Marsokhod rover mission simulation at Silver Lake, California: mission overview, data sets, and summary of results. J Geophys Res 106:7639–7663 [Google Scholar]
- Stoker C.R., Roush T.L., Arvidson R.E., Bresina J.L., Bualat M.G., Edwards L.J., Flueckiger L.J., Washington R.M., Nguyen L.A., Thomas H., and Wright A.R. (2002) Two dogs, new tricks: a two-rover mission simulation using K9 and FIDO and Black Rock Summit, Nevada. J Geophys Res 107:FIDO 8-1–FIDO 8-13 [Google Scholar]
- Summons R.E., Amend J.P., Bish D., Buick R., Cody G.D., and Des Marais D.J. (2011) Preservation of martian organic and environmental records: final report of the Mars Biosignature Working Group. Astrobiology 11:157–181 [DOI] [PubMed] [Google Scholar]
- Vanden Berg M.D. and Birgenheier L.P. (2017) Chapter 4: evaluation of the Upper Green River Formation's Oil Shale Resource in the Uinta Basin, Utah. In Utah Oil Shale: Science, Technology, and Policy Perspectives, edited by Spinti J.P., Press CRC, Boca; Raton, FL, pp 59–86 [Google Scholar]
- Vasavada A.R., Grotzinger J.P., Arvidson R.E., Calef F.J., Crisp J.A., Gupta S., Hurowitz J., Mangold N., Maurice S., Schmidt M.E., Wiens R.C., Williams R.M.E., and Yingst R.A. (2014) Overview of the Mars Science Laboratory mission: Bradbury landing to Yellowknife Bay and beyond. J Geophys Res 119:1134–1161 [Google Scholar]
- Whittaker W., Bapna D., Maimone M.W., and Rollins E. (1997) Atacama Desert trek: a planetary analog field experiment. In Proceedings of the 7th International Symposium on Artificial Intelligence, Robotics, and Automation for Space, Tokyo, Japan [Google Scholar]
- Williams R.M.E. and Weitz C.M. (2014) Reconstructing the aqueous history within the southwestern Melas Basin: clues from stratigraphic and morphometric analyses of fans. Icarus 242:19–37 [Google Scholar]
- Yingst R.A., Cohen B.A., Crumpler L., Schmidt M.S., and Schrader C.M. (2011) Testing Mars-inspired operational strategies for semi-autonomous rovers on the Moon: the GeoHeuristic Operational Strategies Test in New Mexico. Mars 6:13–31 [DOI] [PMC free article] [PubMed] [Google Scholar]
- Yingst R.A., Cohen B.A., Crumpler L., Schmidt M.S., and Schrader C.M. (2014) Testing Mars-inspired operational strategies for semi-autonomous rovers on the Moon: the GeoHeuristic Operational Strategies Test in Alaska. Acta Astronaut 99:24–36 [DOI] [PMC free article] [PubMed] [Google Scholar]
- Yingst R.A., Russell P., ten Kate I.L., Noble S., Graff T., Graham L.D., and Eppler D. (2015) Designing remote operations strategies to optimize science mission goals: lessons learned from the Moon Mars Analog Mission Activities Mauna Kea 2012 field test. Acta Astronaut 113:120–131 [Google Scholar]
- Yingst R.A., Berger J., Cohen B.A., Hynek B., and Schmidt M. (2016) Determining best practices in reconnoitering sites for habitability potential on Mars using a semi-autonomous rover: a GeoHeuristic Operational Strategies Test. Acta Astronaut 132:268–281 [DOI] [PMC free article] [PubMed] [Google Scholar]
- Zacny K., Paulsen G., and Szczesiak M. (2011) Challenges and methods of drilling on the Moon and Mars. In Institute of Electrical and Electronics Engineers Aerospace Conference Proceedings, IEEE, Big Sky, MT, March 5–12, 2011 [Google Scholar]
Associated Data
This section collects any data citations, data availability statements, or supplementary materials included in this article.


