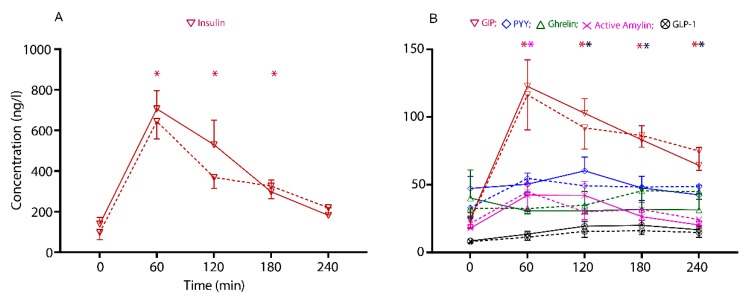
Figure 3.
The circulatory concentration of gastrointensinal (GI) hormones across the intervention period in response to the two treatment arms, SV: Sous-vide (solid lines); PF: pan-fried (dashed lines). The values are presented as mean ± SEM of: (A) Insulin (ng/L), and (B) GIP: gastric inhibitory protein, PYY: peptide tyrosine-tyrosine, ghrelin, active amylin and GLP-1: glucagon-like protein-1 (ng/L). Comparisons between the two cooking methods and interactions with time points (time × cooking methods) were conducted with linear mixed-effects model analysis. * The times at which the hormone concentrations significantly differed from the baseline (p < 0.05, posthoc is relevant to the main time effect only).

