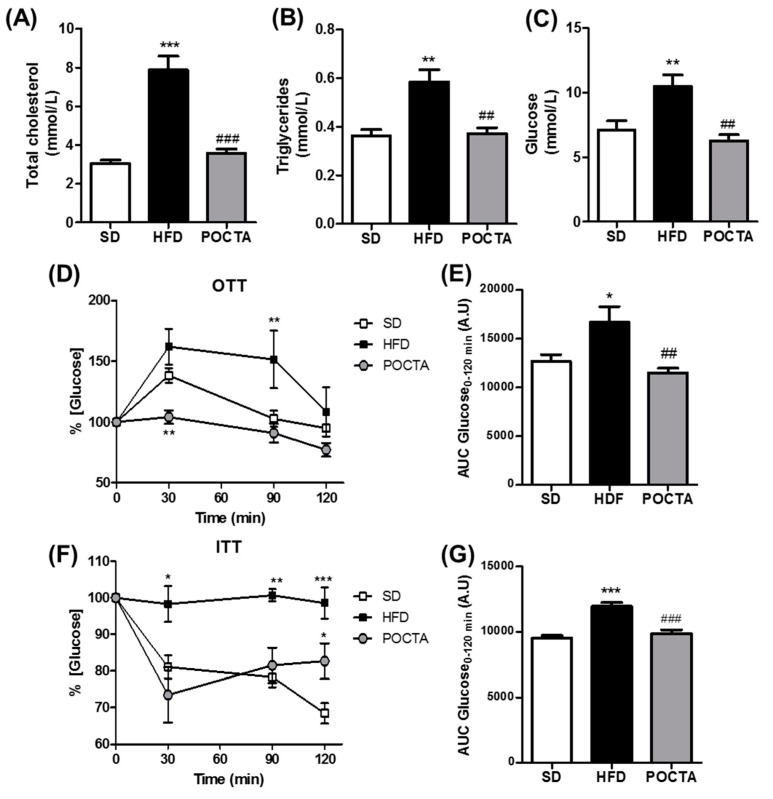
Figure 2.
The effect of a POCTA diet on serum cholesterol, triglycerides, glucose, and insulin resistance. Levels of total cholesterol (A), triglycerides (B), and glucose (C) in serum of mice fed the SD, HFD, or POCTA diet. Profile of serum glucose changes obtained from oral glucose tolerance test (GTT) (D), and insulin tolerance test (ITT) (F), at 20 weeks of treatment. Area under the curve (AUC) results of serum glucose concentrations in the OTT (E), and the ITT (G). Values are mean ± SEM (n = 5–7) and are normalized relative to the control group. * p < 0.05, ** p < 0.01, *** p < 0.001 vs. SD; ## p < 0.01, ### p < 0.001 vs. HFD.

