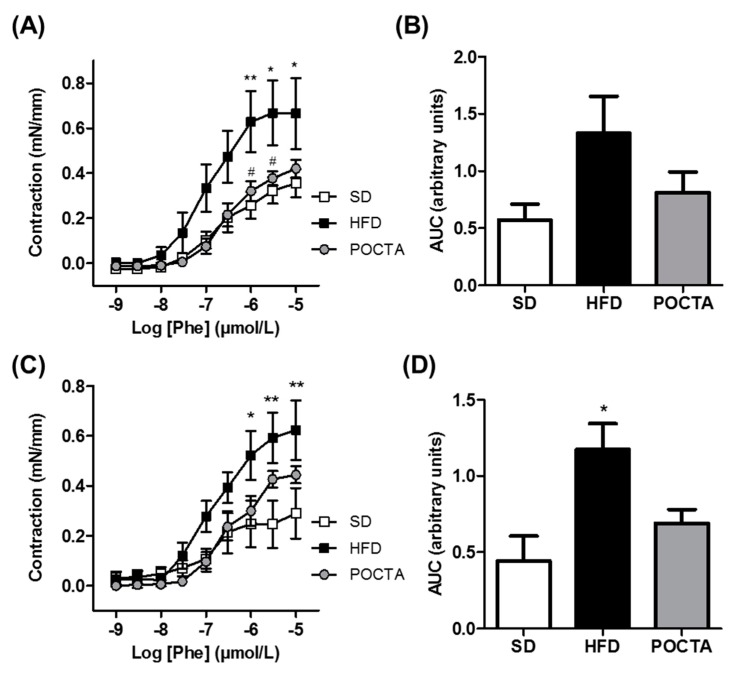
Figure 5.
The effect of a POCTA diet on vasoconstriction in the aorta. Concentration-response curves to phenylephrine (Phe) in the absence of inhibitors (A, B), or in the presence of the inducible NO synthase inhibitor 1400W (C, D), in aortic rings of mice fed the SD, HFD, or POCTA diet. Area under the curves (AUC) obtained from cumulative curves to Phe in the absence (B), or presence of the inhibitor (D). Values are mean ± SEM (n = 5) and are normalized relative to the control group. * p < 0.05, ** p < 0.01 vs. SD; # p < 0.05 vs. HFD.

