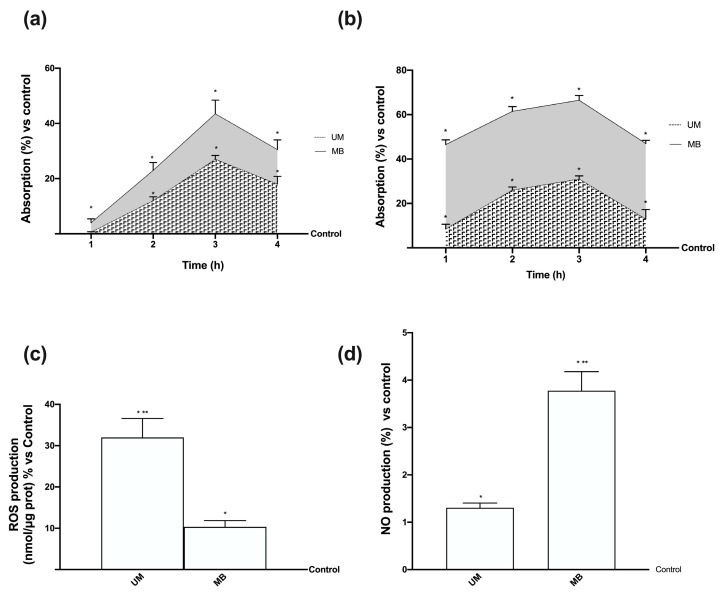
Figure 5.
Magnesium quantification and ROS/NO balance produced on PHM1-41 cells. (a) Total Mg absorbed in co-culture model measured at the basolateral level over time (ranging from 1 h to 4 h). (b) Total Mg absorbed at the intracellular level over time (ranging from 1 h to 4 h). Data are means ± SD (%) compared to control values (line 0%) of four independent experiments produced in triplicate. * p < 0.05 vs. control; p < 0.05 between UM and MB at the same time point across all time points. (c) ROS analysis measured at 3 h expressed as means ± SD (%) of cytochrome C reduced/µg of protein normalized to control (line 0%) of five independent experiments produced in triplicate. * p < 0.05 vs. control; ** p < 0.05 vs. MB. (d) NO production measured at 3 h normalized to control (line 0%) and expressed as means ± SD (%) of five independent experiments produced in triplicate. * p < 0.05 vs. control; ** p < 0.05 vs. MB. The abbreviations are the same as reported in Figure 1.

