Figure 6.
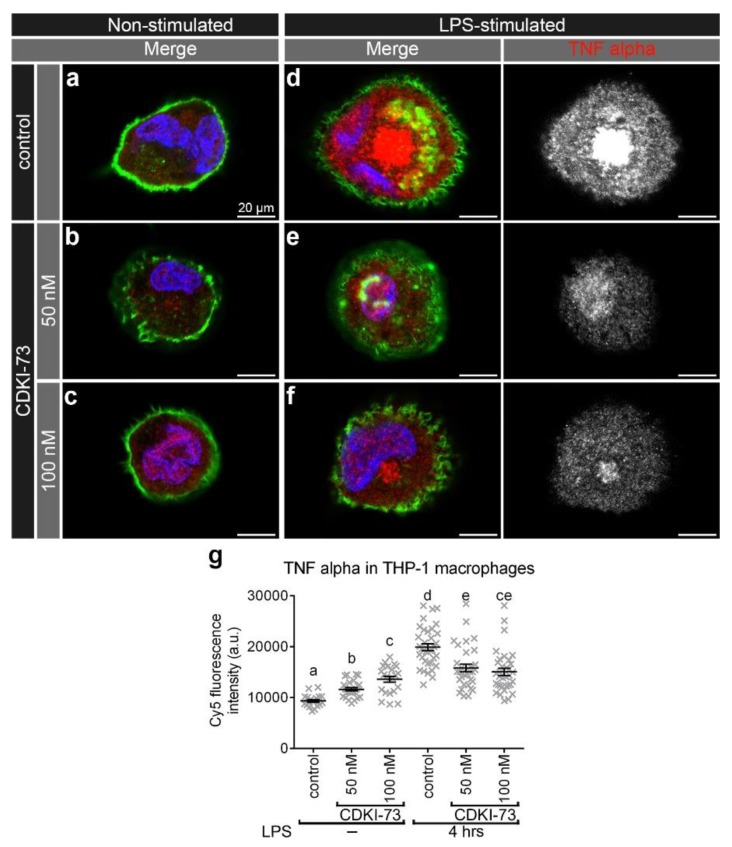
CDKI-73 depletes tumour necrosis factor alpha (TNFα) in LPS-stimulated THP-1 macrophages. (a–f) Confocal micrographs showing TNFα detected with anti-TNFα antibody (red) in relation to the plasma membrane outlined with Alexa Fluor® 488 Phalloidin (green). The nucleus was depicted by staining with Hoechst 33,258 DNA stain (blue). Representative images were from control THP-1 macrophages (a,d), and THP-1 macrophages treated either with CDKI-73 at 50 nM (b,e) or 100 nM (c,f) for four hours. The visualised macrophages were non-stimulated (a–c) and LPS-stimulated for six hours (d–f). Scale bars: 20 μm. (g) Histogram showing comparative analysis of TNFα-Cy5 signal in the designated samples. One-way ANOVA and Tukey’s multiple comparison test showed significant differences between the means in designated groups (depicted by different letters on the bars, p < 0.0001). Data are represented as mean ± SEM.

