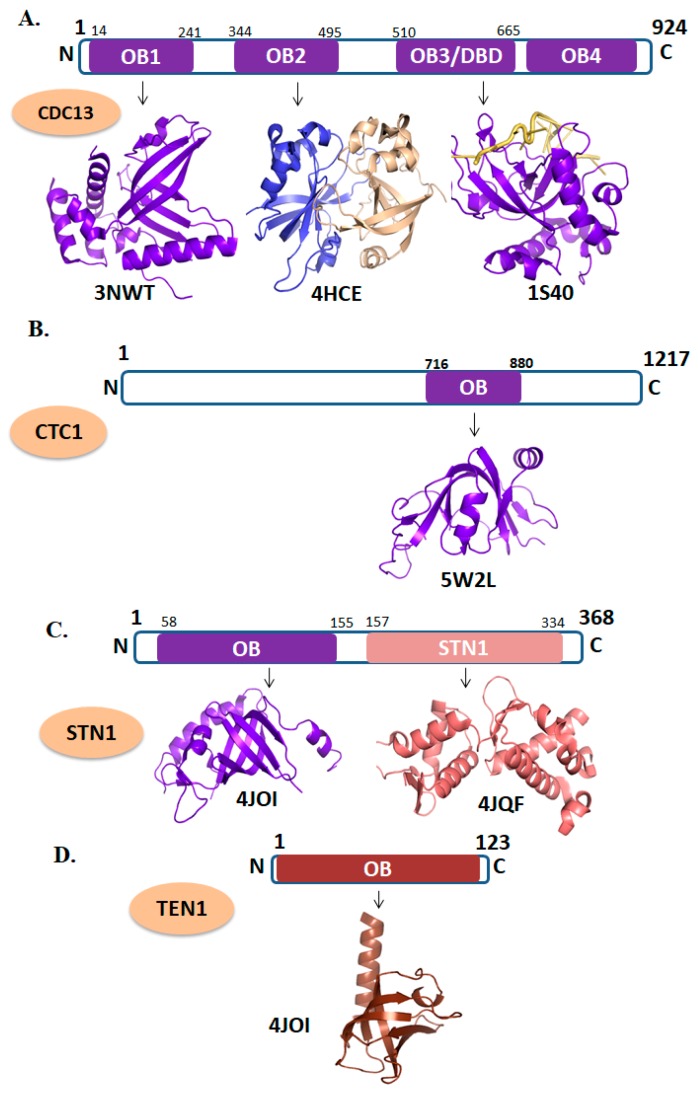
Figure 3.
Domain organizations and tertiary structures of CST (CTC1-STN1) complex. (A) CDC13 (PDB ID: 3NWT; OB1 domain shown in purple, 4HCE; represents the dimer of OB2 domain, 1S40; depicts the DNA-binding domain of CDC13 in complex with telomeric DNA). (B) CTC1 (PDB ID: 5W2L; represent the OB-fold domain of CTC1 in purple. (C) STN1 (PDB ID: 4JOI; cartoon representation of N-terminal OB-fold domain of STN1and 4JQF depicts the N-terminal domain of STN1 in salmon color). (D) TEN1 (PDB ID: 4JOI; depicts the OB-fold domain of TEN1 in chocolate color).

