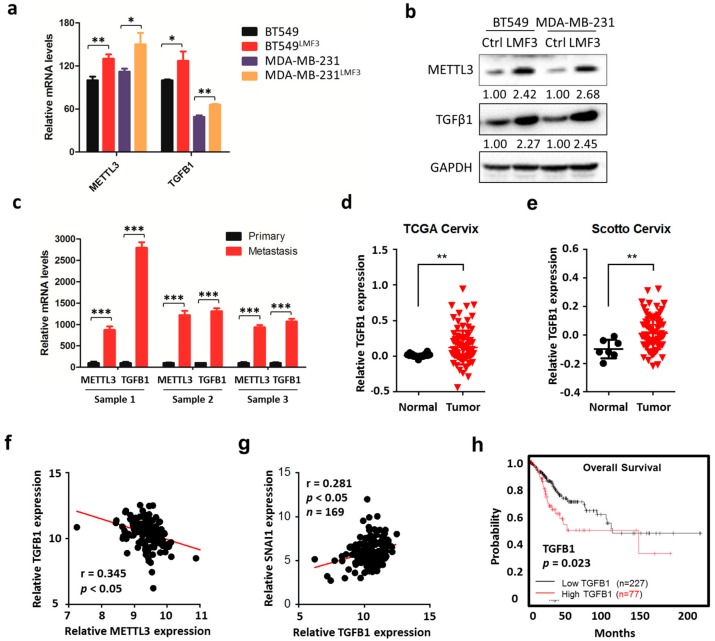
Figure 7.
METTL3/ TGFβ1/Snail axis regulates the in vivo progression of cancer. (a) Expression levels of METTL3 and TGFB1 mRNA in MDA-MB-231LMF3 or BT-549 LMF3 cells and their corresponding parental cells were measured by qRT-PCR; (b) expression levels of METTL3 and TGFβ1 in MDA-MB-231LMF3 or BT-549 LMF3 cells (LMF3) and their corresponding parental cells (Ctrl) were measured by Western blot. Band intensities of METTL3 and TGFβ1 were analyzed by ImageJ and are listed at the bottom of target bands; (c) expression levels of METTL3 and TGFB1 mRNA in primary tumors and metastasized tumors in lungs isolated from three MMTV-PyMT mice were measured by qRT-PCR. Data are presented as means ± SD from three technical replicates. (d) Expression of TGFB1 in cervical tumor tissues and normal tissues from Oncomine database: Ma Breast 4; (e) Expression of TGFB1 in cervical tumor tissues and normal tissues from Oncomine database: Cluck Breast; (f) Pearson correlation between TGFB1 and METTL3 in 169 cervical cancer tissues from the TCGA database; (g) Pearson correlation between TGFB1 and SNAI1 in 169 cervical cancer tissues from the TCGA database; (h) Overall survival (OS) in patients with high (n = 227) versus low (n = 77) levels of TGFB1 in cervical cancer patients plotted by the Kaplan–Meier method. Data in Figure 7a are presented as means ± SD from three independent experiments. Student’s t-test, *, p < 0.05; **, p < 0.01 compared with control.

