Figure 1.
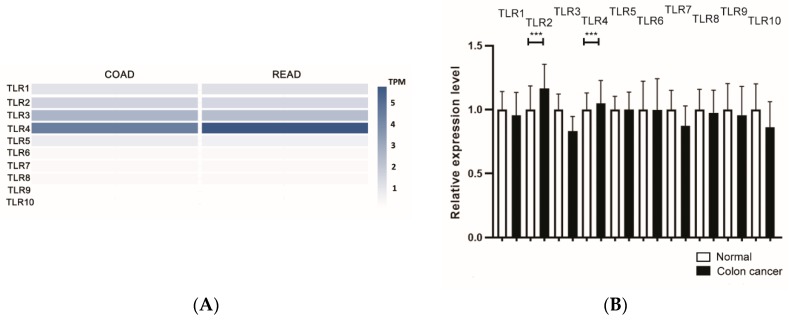
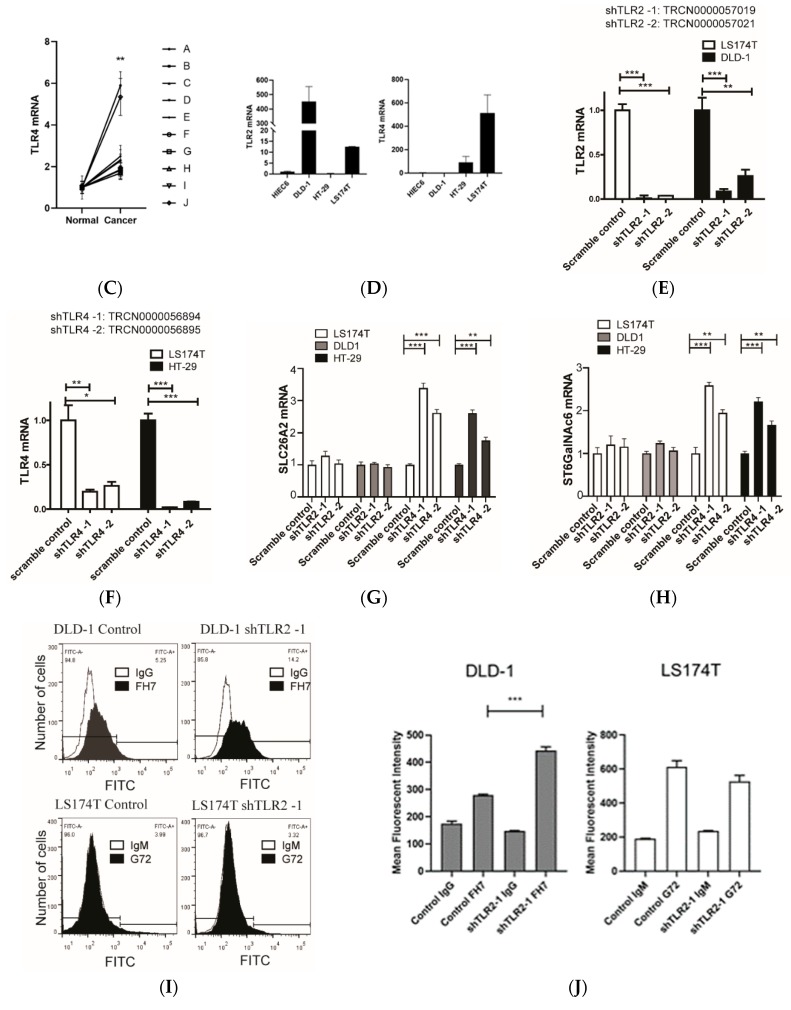
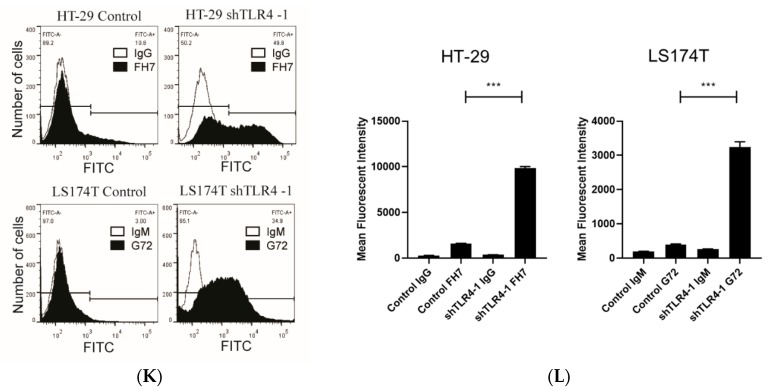
Toll-like receptor 4 (TLR4) mediates the suppression of immunosuppressive Siglec-7 glycan ligands in colorectal cancers. (A) Comparison of TLR1–TLR10 amount expression in COAD (Colon adenocarcinoma) and READ (Rectum adenocarcinoma) by Gene Expression Profiling Interactive Analysis (GEPIA2). Gene expression level was calculated by transcript per million (TPM). (B) TLR1–TLR10 expression level in normal (n = 397) and colon cancer samples (n = 3775) from the GENT2 database. *** p < 0.001. Results are shown as the relative fold increase compared with normal colon control. (C) Gene expression analysis of TLR4 in human colon cancer cells (Ca) and non-malignant colonic epithelial cells (N) prepared from same patients (n = 10). ** p < 0.01. (D) Gene expression analysis of TLR2 or TLR4 in normal intestinal cells (HIEC6), DLD-1, HT29, and LS174T cells. (E) Gene expression analysis of TLR2 in DLD1 and LS174T after the introduction of shRNAs for TLR2. (F) Gene expression analysis of TLR4 in HT-29 and LS174T after the administration of shRNAs for TLR4. (G) SLC26A2 expression in colon cancer cells after the administration of shRNAs for TLR2 and TLR4. (H) ST6GalNAc6 expression in colon cancer cells after the administration of shRNAs for TLR2 and TLR4. (I) Flow cytometry analysis of expression of disialyl Lewisa (top panels) and sialyl 6- sulfo Lewisx (bottom panels) on DLD-1 and LS174T cells, respectively, after the administration of shRNAs for TLR2. (J) Fluorescence intensity results of flow cytometry analysis in (I) are shown. The relative expression levels of disialyl Lewisa stained with FH7 antibody or sialyl 6-sulfo Lewisx stained with G72 antibody are shown as mean fluorescence intensity (MFI) compared with the staining of control IgG or IgM. *** p < 0.001. (K) Flow cytometry analysis of expression of disialyl Lewisa (top panels, FH7) or sialyl 6- sulfo Lewisx (bottom panels, G72) on HT-29 or LS174T cells, respectively, after the administration of shRNAs for TLR4. (L) Fluorescence intensity results of flow cytometry analysis in (K) are shown. The relative expression levels of disialyl Lewisa and sialyl 6-sulfo Lewisx are shown as mean fluorescence intensity (MFI) compared with the staining of control IgG or IgM. *** p < 0.001.


