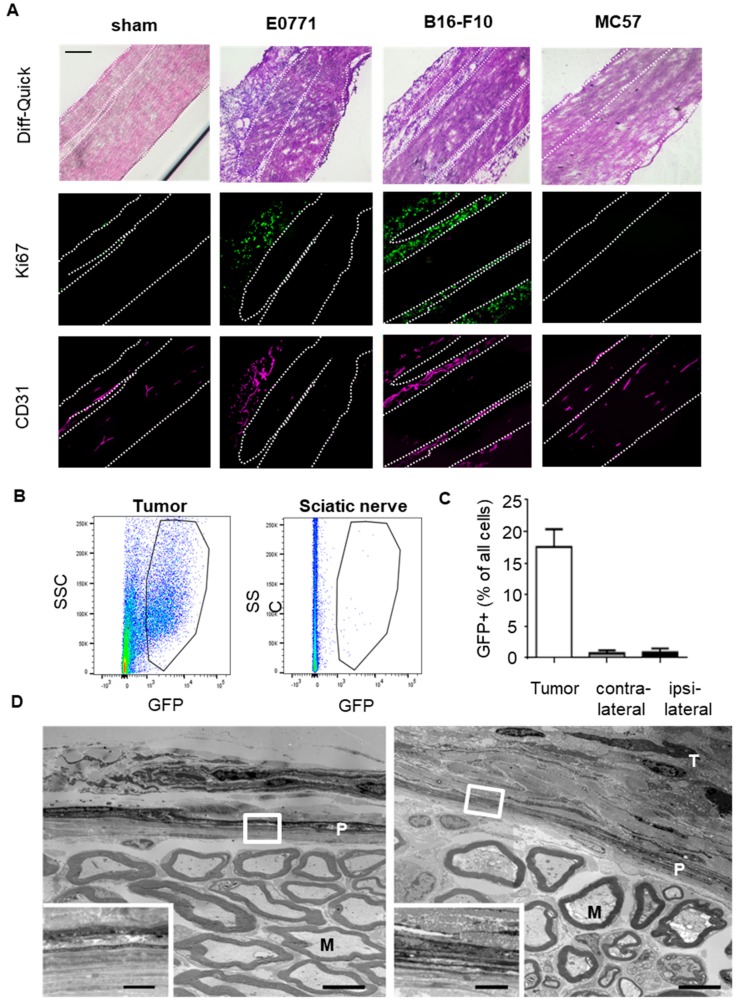
Figure 3.
Tumor cell invasion of sciatic nerves is not seen for any of the three tumor types. (A) Immunohistological MELC staining of sciatic nerves from sham operated mice and mice with E0771 (d14), B16-F10 (d13) or MC57 (d19) tumors. Shown in false colors are marker for proliferating cells (Ki67) and endothelial cells (CD31). White dotted lines depict borders of the sciatic nerve. All areas are distal of splitting to nervus tibialis, peroneus and suralis. The black bar represents 100 µm. (B,C) FACS analysis of tumors and sciatic nerves from mice injected with GFP-overexpressing E0771 cells (d14). Number of GFP-expressing cells in tumor, ipsilateral and contralateral nerves shown as mean ± S.E.M. (n = 5). (D) Electron microscopic image of ultrathin cross-sections of sciatic nerves from sham-operated mice (left panel) and 14 days after implantation of E0771 cells (right panel). Scale bars 5 µm. The white squares depict the area magnified in the lower left corners (scale bars 1 µm). M, example of a myelinated axon; P, perineurium; T, tumor area.

