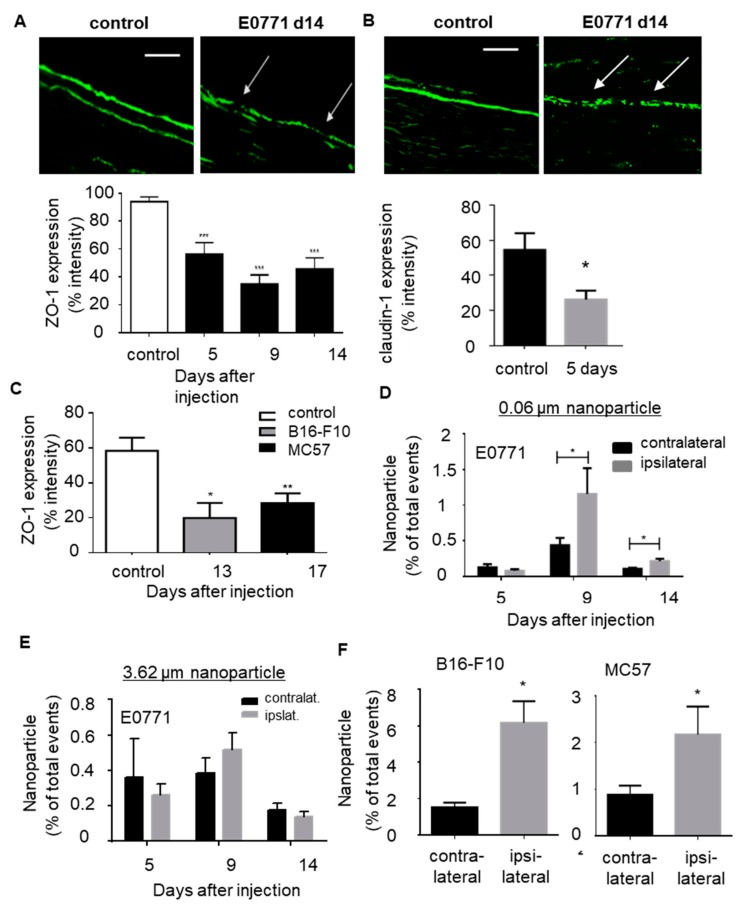
Figure 4.
Tumor growth induces microlesions in the sciatic nerves. (A,B) Immunohistological staining for tight junction marker ZO-1 (panel A) and claudin-1 (panel B) in sciatic nerves from naïve mice and 14 days after E0771 cell injection. White arrows depict ZO1 downregulation in an ipsilateral nerve. Scale bar 100 µm. Quantification of ZO-1 and claudin-1 staining in sciatic nerves at different time points (panel A) or claudin-1-staining 5 days after E0771 injection (panel B). Data are shown as mean ± S.E.M. (control n = 12, 5 days n = 4, 9 days n = 4 and 14 days n = 4). One way ANOVA, *** p < 0.001. (C) Quantification of ZO-1 staining in sciatic nerves after B16-F10 (14 days) and MC57 (18 days) injection. Data are shown as mean ± S.E.M. Control n = 12, B16-F10 n = 4 and MC57 n = 8. One way ANOVA, * p < 0.05, ** p < 0.01. (D,E) FACS analysis of fluorescent labeled particles with an average size of 0.06 µm (panel E) or 3.6 µm (panel F) in contralateral and ipsilateral sciatic nerves at different time points after E0771 tumor cell injection. Data are shown as mean ± S.E.M. (n = 6). Two-tailed Students T-test * p < 0.05. (F) Same as panel E except that the amount of particles in sciatic nerves 14 days after B16-F10 or 18 days after MC57 cell injection. Data are shown as mean ± S.E.M. (n = 6) * p < 0.05.

