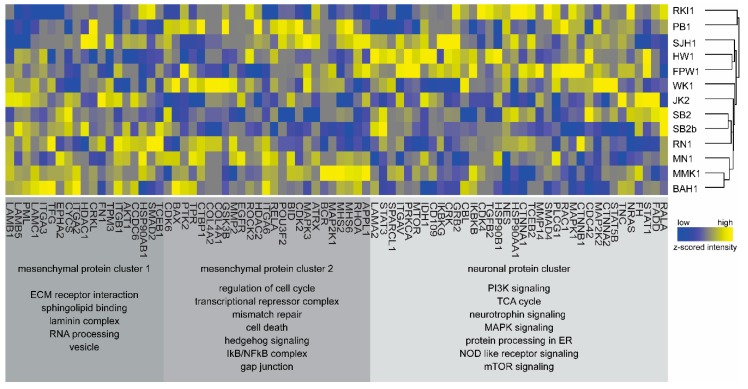
Figure 5.
Functional analysis of the expressed proteome. Heatmap of proteins (z-scored intensities) belonging to the KEGG cancer pathway. The proteins segregate into three clusters: mesenchymal cluster 1, mesenchymal cluster 2, and neuronal cluster listing the pathways that proteins represent. Dendrogram depicts the similarity in protein profiles among the 13 cell lines. Colour legend: blue, low expression; and yellow, high expression.

