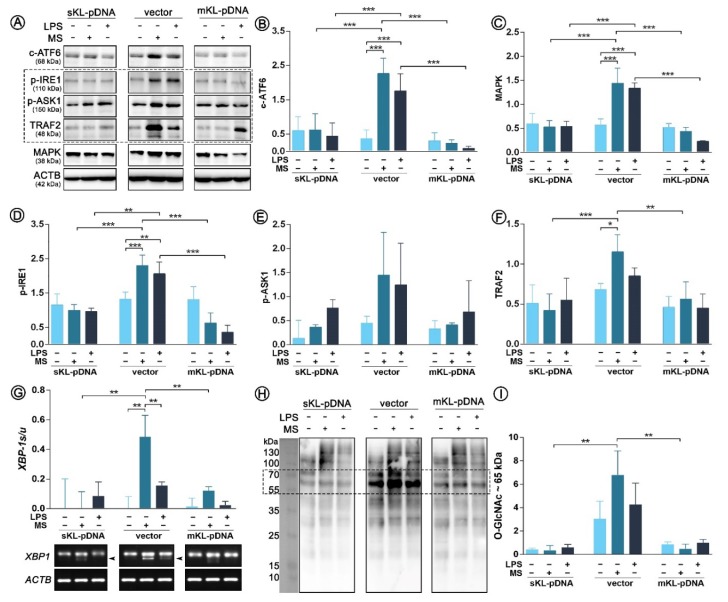
Figure 4.
Expression of factors involved in ER stress response. Klotho expression was upregulated with pDNA, cells were treated for 72 h with monensin sodium or 168 h with LPS and expression of proteins involved in ATF6- and IRE1-mediated pathways was evaluated with Western Blot method (A), i.e.,: c-ATF6 (B), MAPK (C), p-IRE1 (D), p-ASK1 (E), and TRAF2 (F). XBP-1 splicing was evaluated by RT-PCR (G) and O-GlcNAc levels by WB (H,I). The bands were quantified and normalized to their corresponding β-actin bands. Bars indicate SD, n = 3, *** p < 0.001, ** p < 0.01, * p < 0.05, no indication – no statistical significance (one-way ANOVA and Dunnett’s a posteriori test).

