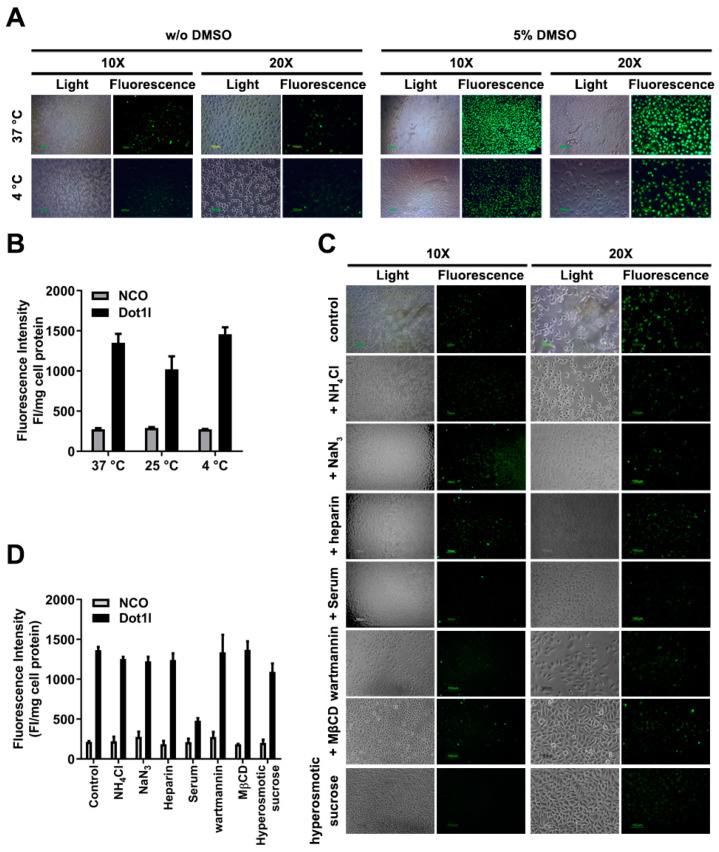
Figure 3.
Effects of Dot1l peptide penetration under different conditions. (A) Fluorescence microscopy of FITC-labeled Dot1l peptide at 37 °C and 4 °C. (B) Quantization of Dot1l peptide penetration in MCF7 cells at different temperatures. Data are presented as means ± SEM (n = 3). The statistical analysis is shown in Supplementary Figure S1D. (C) Fluorescence microscopy of different inhibitors’ exposure on Dot1l peptide penetration. (D) Suppression of different inhibitors’ exposure on Dot1l peptide penetration. Data are presented as means ± SEM (n = 3). The statistical analysis is shown in Supplementary Figure S1E. Cell lysate fluorescence intensity was adjusted by protein concentration examined by Bradford assay.

