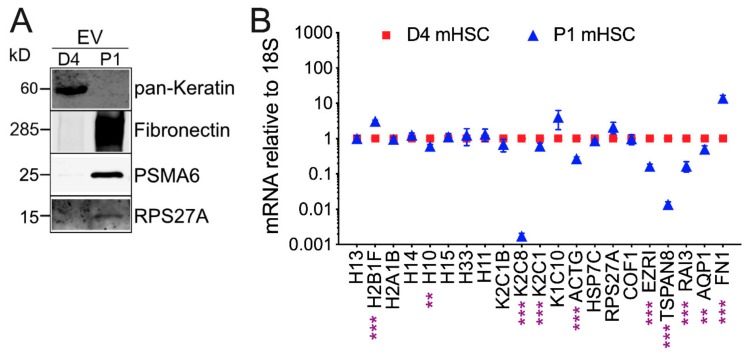
Figure 4.
EV Western blot and cellular transcript levels for differentially expressed EV proteins. (A) Western blots of EVs from D4 mHSC or P1 mHSC to verify differential levels of representative proteins identified by MS. (B) qRT-PCR was performed on RNA from D4 or P1 mHSC using primers designed to amplify mRNA corresponding to proteins that were more highly expressed in EVs from D4 mHSC than in EVs from P1 mHSC (see Figure 3C,D). Data are mean ± S.E.M. for duplicate determinations performed twice individually. **, p < 0.01, ***, p < 0.005.

