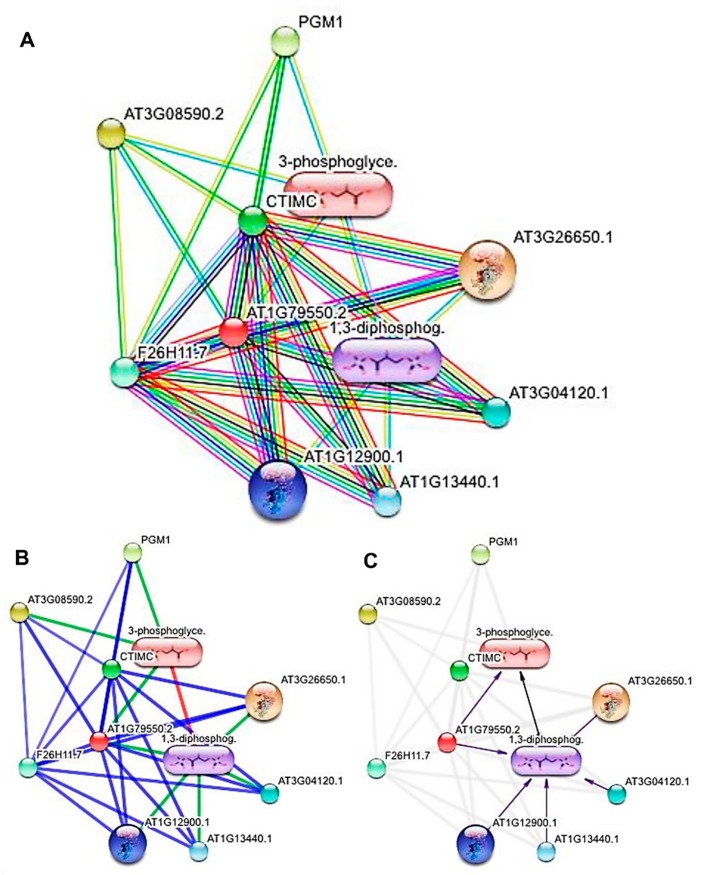
Figure 8.
The evidence view showing the binding affinities of Q9SAJ4 domain with other biochemicals (A). Different line colors represent the types of evidence for the association, as shown in Table S6; Supplementary Data Set 1. The confidence view representing the strength of ligand associations (protein–protein, chemical–protein, and chemical–chemical interactions), using different weight lines (B). Stronger associations are shown by thicker lines. Protein–protein interactions are shown in blue, chemical–protein interactions in green, and interactions between chemicals in red. Actions view depicting the modes of action in different colors (C).

