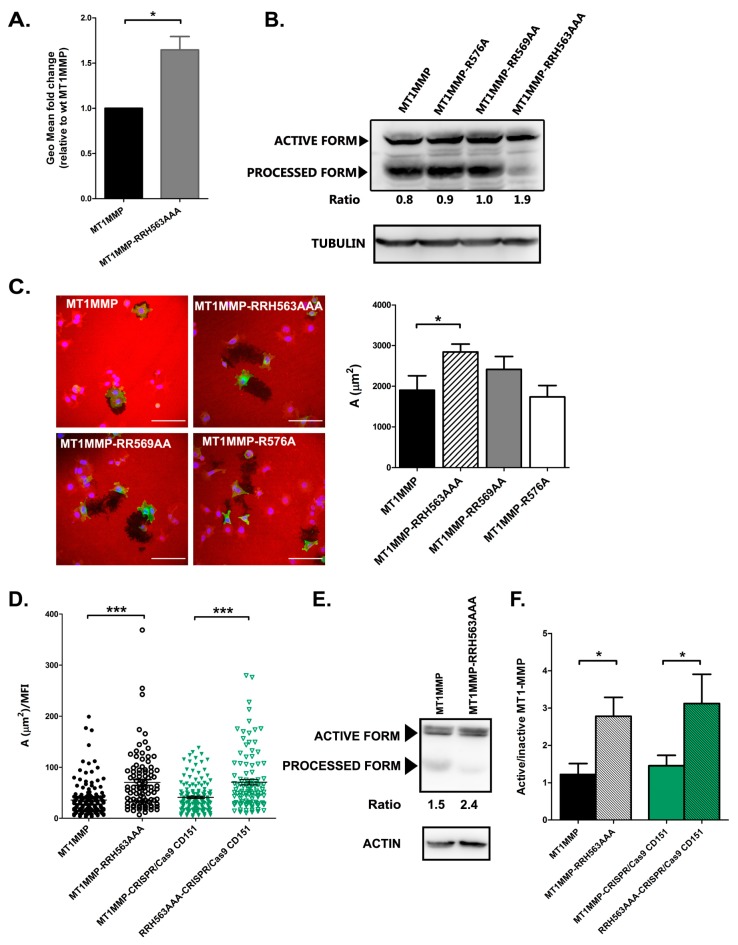
Figure 5.
Connection to ERMs regulate MT1-MMP autoprocessing and activity. (A) Flow cytometry analysis of MT1-MMP surface expression represented as the mean fold change ± SEM of the fluorescence geometric mean comparing to MT1-MMP in three independent experiments, * p < 0.05 in a two-tailed paired Student t-test. (B) Western blot revealed with anti-GFP antibody was used to analyse the relative abundance of autoprocessed MT1-MMP form in total cell lysates. The ratio between full active molecule versus the inactive autoprocessed form is depicted below. Tubulin was used as loading control. (C) A fluorescent gelatin matrix was used as a substrate to measure MT1-MMP activity. MCF-7 cells were transiently transfected with the different mEGFP-tagged MT1-MMP constructions and plated onto 2 mg/mL gelatin for 6 h, fixed and the degraded area was quantified. Bars 100 µm. Data represent mean ± SEM of n ≥ 25 cells. Data was by Kruskal–Wallis test, * p < 0.05. (D) MCF-7 wt or CRISPR/Cas9 CD151 cells were transfected with mEGFP-tagged MT1-MMP constructs (wt or RRH563AAA) and plated onto 2 mg/mL fluorescent gelatin for 6 h before fixation. Degradation area was measure with Image J and normalized to the Mean Fluorescent mEGFP Intensity of each cell. Data are represented as the mean ± SEM of 100–150 cells from 3 independent experiments and by one-way ANOVA with Dunn’s post-test *** p < 0.001. (E) Autocatalytic cleavage reduction is also detected when the RRH563AAA mutant is transfected in CRISPR/Cas9 CD151 cells. Western blot with anti-GFP antibody was used to analyse the expression of MT1-MMP (wt or RRH563AAA) in MCF-7 CRISPR/Cas9 CD151 cells. The ratio between the active enzyme versus the processed form is calculated. Actin was used as loading control. (F) Graph depicts the autocatalytic activity of MT1-MMP as the ratio between the active enzyme versus the processed form obtained by western-blot. Data represent the mean ± SEM of five independent experiments analysed by one way ANOVA and Bonferroni’s multiple comparison test, * p < 0.05.

