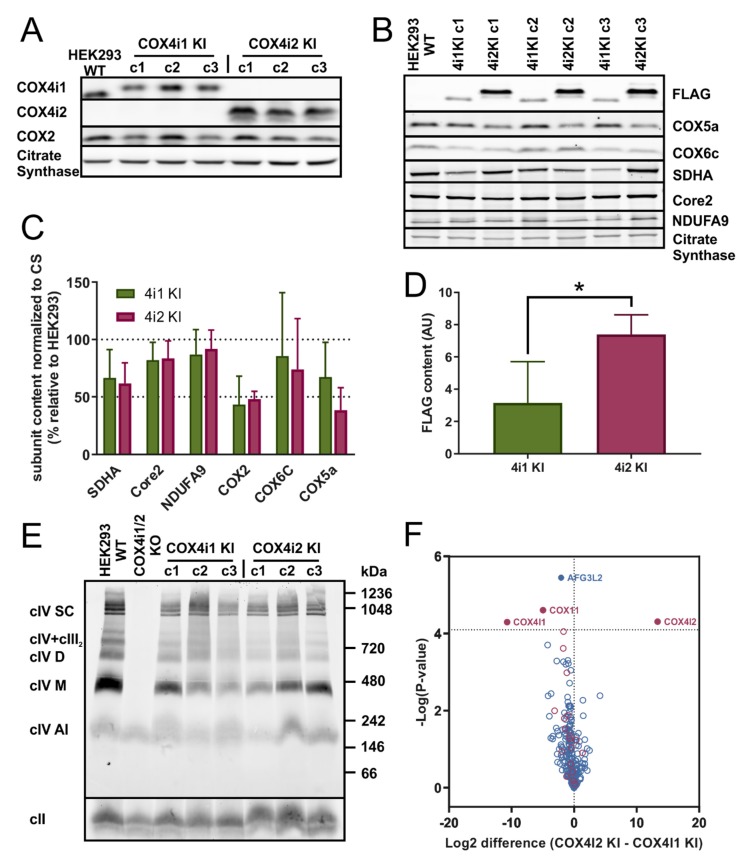
Figure 1.
(A) Western blot analysis of COX4 isoforms in knock-in cell lines. Whole cell lysates (30 µg of protein) of control HEK293 and three clones of each COX4i1 KI and COX4i2 KI were subjected to SDS-PAGE and Western blotting. COX4i1 and COX4i2 isoforms were detected with specific antibodies (see details in Methods), along with the COX2 subunit. Citrate synthase was used as a loading control. (B) Western blot analysis of COX subunits and OXPHOS proteins. Whole cell lysates (30 µg of protein) of control HEK293 and three clones of each COX4i1 KI and COX4i2 KI were subjected to SDS-PAGE and Western blotting. Representative image of one of three sets of samples of the HEK293 control and three clones of each KI cells are shown. (C) Quantity of OXPHOS proteins. Antibody signals from WB images were quantified densitometricaly using Image Lab software (Bio Rad). Data are plotted as the mean ± S.D. of COX4i1 and COX4i2 KI values expressed in percent relative to control HEK293 cells (n = 9, three independent samples of three clones of each KI cell line). (D) Quantity of FLAG-tagged COX4 isoforms. Relative content of FLAG-tagged COX4i1 and COX4i2 in respective KI cell lines determined by densitometry quantification of the FLAG antibody signal. Data are plotted as the mean ± S.D. of COX4i1 and COX4i2 KI cells (n = 9, three independent samples of three clones of each KI cell line). (E) BN-PAGE analysis of native forms of COX. Isolated mitochondria from HEK293, COX4i1/2 KO, and KI cells were solubilized with digitonin (6 g/g protein); sample aliquots of 30 µg protein were separated on 5%–16% native gel. WB analysis with the COX1 antibody revealed multiple forms of the COX complex as indicated on the left of the image: COX1-containing assembly intermediate (cIV AI), monomer (cIV M), dimer (cIV D), assemblies with complex III (cIV + cIII), and respiratory supercomplexes (cIV SC). Molecular weight marker migration is indicated on the right. Complex II (cII) detected by the SDHA antibody was used as a loading control. * p > 0.05. (F) Mass spectrometry analysis of immunoprecipitated COX. Volcano plot depicting differential contents of Mitocarta-annotated proteins immunoprecipitated with the anti-FLAG antibody (blue circles) from 4i1 or 4i2 KI cells. Red circles mark COX subunits and assembly factors. Relative quantities (4i2 KI/4i1 KI) plotted on the X-axis are expressed in log2 scale. Significantly different hits are shown above the probability cut off (dashed horizontal line) with protein names annotated.

