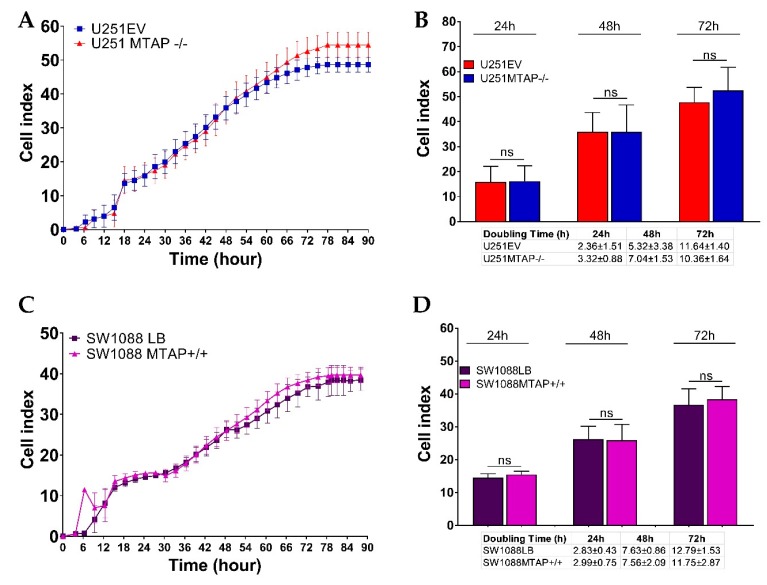
Figure 6.
Dynamic monitoring of cell proliferation using impedance technology. Cell index values representative for U251MTAP−/− vs. U251EV (A) and SW1088MTAP+/+ vs. SW1088LB (C) measured by the Real Time Cell Analysis (RTCA) assay for 90 h. Plot representative of cell index and doubling time at 24, 48, and 72 h for U251MTAP−/− vs. U251EV (B) and SW1088MTAP+/+ vs. SW1088LB (D). Plot representative of three independent experiments. Student t-test: * p < 0.05, ** p < 0.01, *** p < 0.001, ns: not significant.

