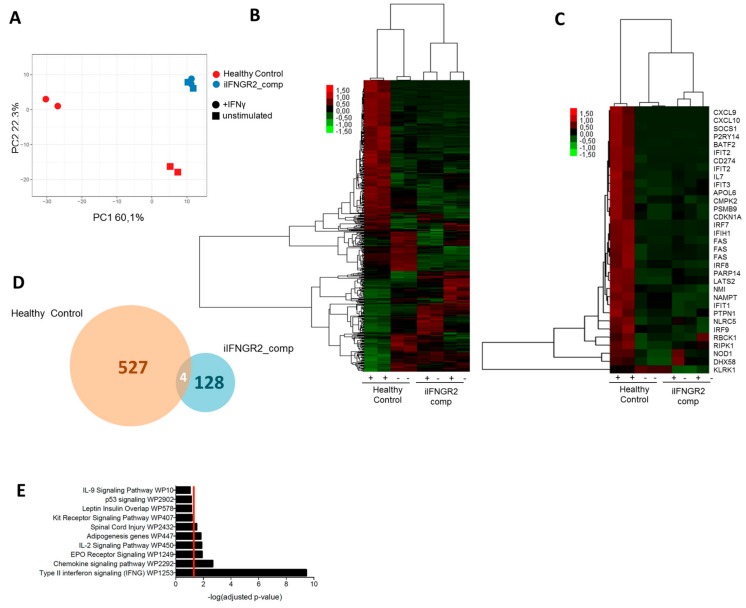
Figure 5.
Transcriptional analysis shows differential gene expression in healthy and patient macrophages. (A) Principal component analysis (PCA) of unstimulated and stimulated samples of healthy control and iINFGR2_comp macrophages. PCA was performed on all genes significantly changes (p ≤ 0.05) in healthy control macrophages. (B) Heatmap of all genes significantly up- or downregulated between stimulated and unstimulated healthy control macrophages compared to the other groups. (C) Genes of the hallmark IFN-γ response group (M5913) of the molecular signature database (MSigDB) and their expression in healthy control and iIFNGR2_comp macrophages. (D) Comparison of genes significantly up- or downregulated (p ≤ 0.05) in stimulated compared to unstimulated healthy control macrophages and stimulated compared to unstimulated iIFNGR2_comp macrophages. (E) Genes that were significantly up- or downregulated (p ≤ 0.05 in stimulated healthy control macrophages compared to the other groups were analyzed via gProfiler for enriched WikiPathway groups. The top 10 groups are shown.

