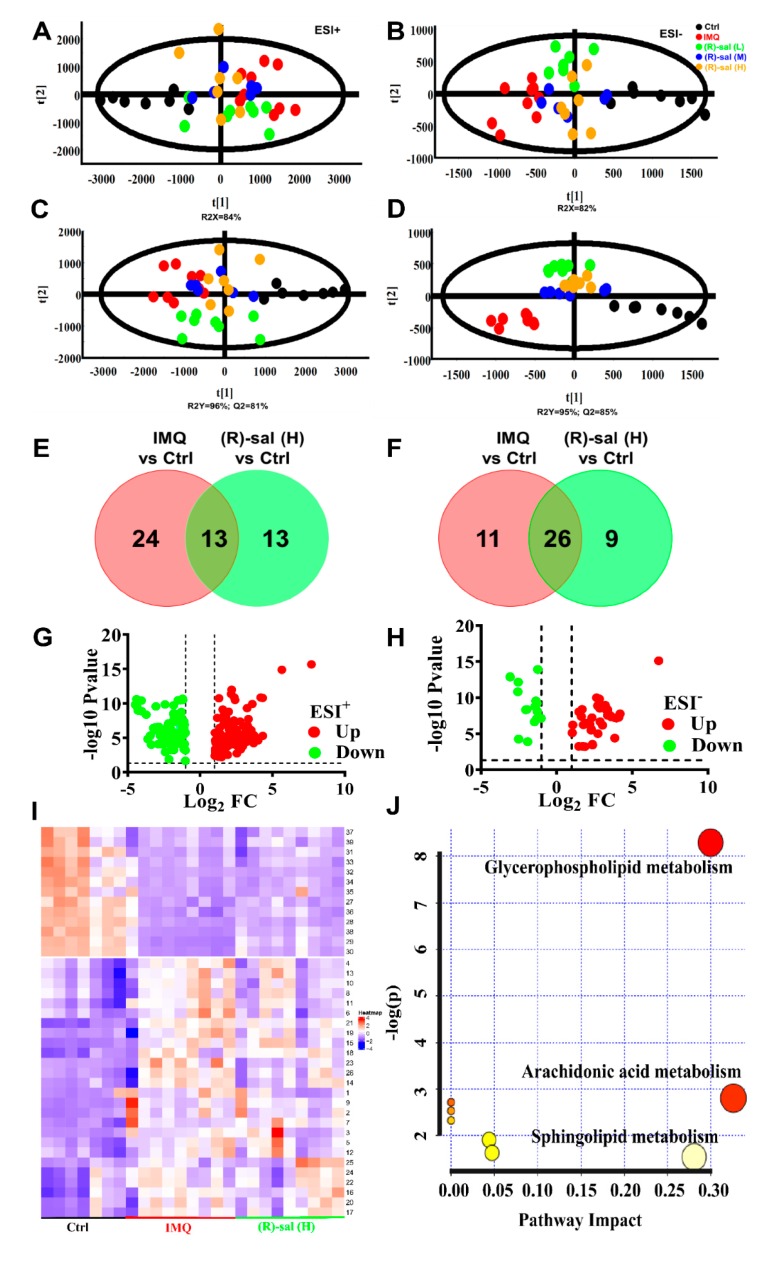
Figure 7.
Results of the metabolic effects of (R)-salbutamol in mice treated with IMQ to induce psoriasis. (A,B) PCA plot scores for the control, IMQ and (R)-salbutamol (L, M, H) groups in (B) ESI (−) mode and (A) ESI (+). (C,D) PLS-DA score plot for the (R)-salbutamol (L, M, H), IMQ and control on the basis of mice plasma metabolic profiles for the (D) ESI (−) mode and (C) ESI (+). (E,F) Venn diagrams showing the upregulated (E) or downregulated metabolites (F) based on the binary comparison of (R)-salbutamol vs. control, IMQ vs. control corresponding to the numbers shown in Supplemental Table S4. (G,H) Volcano plots of p values in the (G) ESI (+) and (H) ESI (−) mode. (I) Visualization of candidate biomarkers among the (R)-salbutamol, IMQ, and control in the ESI (+) and ESI (−) mode using Heat map of unsupervised hierarchical clustering. Columns: samples; Rows: biomarkers. The content level of metabolites is denoted by the color key. Red stands for high metabolite level whereas blue color denotes low metabolite level. (J) Pathway analysis for the differential metabolism in the (R)-salbutamol (L, M, H), IMQ, and control groups based on the topology analysis (x-axis) and enrichment analysis scores (y-axis). The size and color of each circle represent the pathway impact factor and p-value, respectively. The pathways marked in red are the most significant. These analyses were performed using the MetaboAnalyst 4.0 tool.

