

Abstract
Endocrine disrupting chemicals are known to cause neurodevelopmental toxicity through direct and indirect pathways. In this study we used data from the National Health and Nutrition Examination Surveys, along with known exposure-disease relationships, to quantify the intellectual disability burden attributable to in utero exposure to polybrominated diphenyl ethers (PBDEs), organophosphates, and methylmercury and early life exposure to lead. We also estimated the cost of the IQ points lost and cases of intellectual disability. PBDE exposure was the greatest contributor to intellectual disability burden, resulting in a total of 162 million IQ points lost and 738,000 cases of intellectual disability. This was followed by lead, organophosphates, and methylmercury. From 2001 to 2016, IQ loss from PBDEs, methylmercury, and lead have decreased or remained stagnant. Organophosphate exposure measurements were only available up to 2008 but did show an increase in organophosphate-attributable IQ loss. Although most of these trends show benefit for children’s neurodevelopmental health, they may also point towards the use of potentially harmful substitutions for chemicals that are being phased out.
Keywords: Neurotoxicity, neuroendocrine toxicity, in utero exposure, IQ loss, economic burden
Introduction
Among the detrimental effects of prenatal and early-life chemical exposures are their neurotoxicity. Chemically-induced neurological damage may occur through endocrine and non-endocrine mechanisms (Bennett et al., 2016; Grandjean & Landrigan, 2014). Endocrine disrupting chemicals (EDCs) may exert their effects by altering thyroid receptor or estrogen receptor regulation of neuroendocrine development, or by influencing dopaminergic neuronal development (L. Chen et al., 2017; Ghassabian & Trasande, 2018; Gilbert, Rovet, Chen, & Koibuchi, 2012; Iavicoli, Fontana, & Bergamaschi, 2009; Laessig, McCarthy, & Silbergeld, 1999; Masuo & Ishido, 2011). These chemicals can also affect neurotoxicity through cell damaging mechanisms such as interference with calcium pathways or inducing oxidative stress. This leads to disruption of biologically important processes required for proper neurodevelopment (Bressler & Goldstein, 1991; Ceccatelli, Dare, & Moors, 2010; Garza, Vega, & Soto, 2006; Naughton & Terry, 2018). Impaired neurodevelopment and resulting neurotoxicity can have a range of consequences, from behavioral problems to learning disabilities to autism spectrum disorder (Gould, 2009).
Research into the adverse health effects of EDCs has contributed to the implementation of more stringent regulatory standards. The best documented example of these changes is the removal of lead from gasoline, paint, and municipal drinking water systems and the subsequent prevention of IQ loss (Bartlett & Trasande, 2014; Grosse, Matte, Schwartz, & Jackson, 2002). Other regulatory practices have followed, including changes to California’s 1975 upholstered furniture flammability standards, for which brominated flame-retardants (BFRs) were primarily used. In 2013, public concern over the health effects of these chemicals led the state to decrease the amount of time in which furniture must remain smolder resistant, thereby removing the need for additive BFRs. This has influenced furniture and mattress manufacturing standards around the country (State of California Department of Consumer Affairs, 2013). It is a strong hypothesis that decreased EDC exposure may provide benefits for the economy by increasing intellectual capital and economic productivity, and for society through the reduction of crime and other negative behaviors (Grosse et al., 2002).
Despite these improvements, no study has documented how EDC regulations in the United States have affected health and associated economic costs. The National Health and Nutrition Examination Surveys (NHANES) provide a wealth of human biomonitoring data beginning in 1999 in which chemical levels are examined in a representative sample of the population. We examined trends in intellectual disability burden, IQ loss, and associated potential costs from 2001 to 2016 as a result of in utero and early life exposure to endocrine disrupting chemicals in the United States from 1999 to 2014.
We chose to focus this study on four major EDCs—polybrominated diphenyl ethers (PBDEs), organophosphates (OPs), methylmercury, and lead—given the extensive research on their ability to cause neurodevelopmental damage and cross the placental barrier (Bressler & Goldstein, 1991; Ceccatelli et al., 2010; L. Chen et al., 2017; Garza et al., 2006; Ghassabian & Trasande, 2018; Gilbert et al., 2012; Iavicoli et al., 2009; Laessig et al., 1999; Masuo & Ishido, 2011; Naughton & Terry, 2018; Yang, Song, & Lim, 2019). We restricted our analysis to the prenatal period for PBDE, organophosphate, and methylmercury exposure, as the developing fetus is at greatest risk for neurodevelopmental toxicity. For lead, we examined early life exposure (children from birth up to the age of five).
Materials and Methods
Population Data and Chemical Exposures
We obtained nationally representative human biomonitoring data including chemicals from the National Health and Nutrition Examination Survey (NHANES). Sponsored by the National Centers for Health Statistics of the Centers for Disease Control and Prevention, NHANES is a nationwide probability sample of the US civilian noninstitutionalized population aged one to 74 years. The goal of the surveys has been to assess the health and nutritional status of adults and children in the United States through interviews and physical examination. In this analysis, we used exposure data collected from 1999 to 2014, reported by two-year periods (1999–2000, 2001–2002, etc.).
PBDE47 concentrations were extracted from blood serum (ng/g lipid) and used as a proxy for total PBDE levels. Serum PBDE47 levels were measured with isotope dilution gas chromatography high-resolution mass spectrometry. Total methylmercury (Hg, ug/L) and lead (Pb, ug/dL) concentrations were measured in whole blood using inductively coupled plasma mass spectrometry. Levels of six organophosphorus metabolites (dimethylphosphate, diethylphosphate, dimethylthiophosphate, diethylthiophosphate, dimethyldithiophosphate, and diethyldithiophosphate) were measured in urine samples using high-performance liquid chromatography and a triple quadrupole mass spectrometer with atmospheric-pressure chemical ionization source in positive ion mode using tandem mass spectrometry (Gore et al., 2015). More extensive descriptions of quantitation methodologies for PBDE, lead, methylmercury, and organophosphates are provided in the NHANES Laboratory Procedures Manual (NHANES, 2017).
Statistical Analysis
Using the methods outlined by the Institute of Medicine (IOM, 1981), we calculated IQ points lost for each NHANES cycle using the following formula:
The following sections describe how each variable was obtained for this equation. For prenatal exposures, we applied the previous 2-year cycle exposure estimates to the number of births in each cycle (i.e. organophosphate exposure from 1999–2000 was applied to the number of births in 2002). For lead, we applied the 2-year cycle exposure to the population of children under five in the same 2-year cycle.
Exposure
PBDE chemical measurements were available from 2001–2014, organophosphates from 1999–2006, methylmercury from 1999–2014, and lead from 2001–2016. Early life lead exposures were obtained by calculating percentiles (10–24th, 25–49th, 50–74th, 75–89th, and 90–99th) of blood lead in children under the age of five in each two-year NHANES cycle. For all chemicals, the 0-ninth percentile range was assumed to be 0, indicating no exposure. This approach was taken to produce a conservative estimate of disease burden in each ascending exposure group.
For prenatal PBDE and methylmercury exposures, we calculated percentiles in women of childbearing age. The pooled nature of the PBDE and methylmercury data from NHANES required us to restrict our analysis to women between the ages of 20 and 39. Since PBDE47 levels were not available from 1999–2000, we obtained IQ loss and intellectual disability estimates for this cycle using levels from the following 2001–2002 cycle. For prenatal organophosphate exposure, we calculated percentiles of individual organophosphorous metabolites (dimethylphosphate, diethylphosphate, dimethylthiophosphate, diethylthiophosphate, dimethyldithiophosphate, and diethyldithiophosphate) in women ages 15–49, as was previously done by Attina and colleagues (Attina et al., 2016). Percentiles for individual organophosphorous metabolites were summed to get estimated total organophosphate exposure percentiles. Since organophosphate levels were not available after 2008, we used the 2007–2008 levels to estimate IQ loss and intellectual disability in the following cycles.
Exposure-Response Relationships
PBDE-attributable IQ loss was calculated by applying the exposure-response relationship of 4.5 IQ points lost per log unit increase in prenatal PBDE exposure with a threshold value of 6.4 ng/g, as indicated by a recent study by Chen and colleagues (A. Chen et al., 2014). We included a sensitivity analysis, which applied a 4.7 to 5.5 IQ point loss per log unit increase in PBDE with a 2.82 ng/g threshold value (Bellanger, Demeneix, Grandjean, Zoeller, & Trasande, 2015; Eskenazi et al., 2013; Herbstman et al., 2010).
For the main organophosphate (OP) analysis, we used an exposure-response relationship of 4.25 IQ points lost per 10-fold increase in prenatal organophosphate exposure, with a reference level of 65 nmol/L total urinary DAP (Bellinger, 2012). For the sensitivity analyses we used the same reference level and a relationship of 5.6 to 1.39 IQ points lost per 10-fold increase in organophosphate exposure (Bouchard et al., 2011; Engel et al., 2011).
Methylmercury concentrations in maternal blood were multiplied by 250 to get estimates of ppm methylmercury in maternal hair (Budtz-Jorgensen, Grandjean, Jorgensen, Weihe, & Keiding, 2004). We assumed a linear, non-threshold exposure-response relationship of 0.18 IQ points lost per ppm methylmercury in maternal hair, as modeled by Axelrad and colleagues (Axelrad, Bellinger, Ryan, & Woodruff, 2007). For the sensitivity analysis, we assumed a linear relationship with a decrease of 0.13 to 0.25 IQ points per ppm methylmercury in hair, as described by Cohen and colleagues (Cohen, Bellinger, & Shaywitz, 2005).
For the main analysis of lead-attributable effects, we applied an exposure-response relationship of 2.7-IQ points lost on a log-linear scale from Lanphear and colleagues (Lanphear et al., 2005) and a 1 μg/dL threshold value. Although there is growing consensus that there is no safe threshold for lead exposure, it is difficult to obtain accurate measurements of low blood lead levels (Bellinger, 2012; European Food Safety Authority, 2010; FAO/WHO, 2010; Gould, 2009). We therefore used a conservative threshold value of 1 μg/dL, compared to the national average of 2 μg/dL (Centers for Disease Control and Prevention, 2005). In the sensitivity analysis we applied the same log-linear model with no threshold value and a linear decrease of 0.51 IQ points per 1 μg/dL increase in lead with a 1 μg/dL threshold value (Bellinger, 2012).
Population and Percent Population
Natality data from the National Vital Statistics System of the National Center for Health Statistics (CDC/NCHS, 2017) were used to obtain the number of births during each of the calendar years included in this analysis (2002–2016). The United States Census Bureau data were used to obtain population under five years of age data (US Census Bureau, 2018). Estimates of births and population under the age of five for each level of exposure in each NHANES cycle were broken into percentiles matching those used for exposure (10–24th, 25–49th, 50–74th, 75–89th, and 90–99th).
Intellectual disability
To quantify cases of intellectual disability (ID), defined as an IQ less than 70, we used the same populations that were specified for the IQ calculations (births for PBDEs, organophosphates, and methylmercury and children under age five for lead). We assumed a normal distribution with a mean of 100 and a standard deviation of 15. IQ points lost for each exposure percentile was subtracted from the mean to get a percentage increase in intellectual disability cases. The final percentage was multiplied by the total number of births in the following year (for PBDEs, methylmercury, and organophosphates) or the population under five in the same year (for lead) for each cycle.
Estimates of economic costs
Economic evaluations were calculated as described in Attina and colleagues (Attina et al., 2016). Each IQ point lost was valued at $22,268, to avoid confounding of cost estimates by ecological trends in economic productivity. Each case of intellectual disability was valued as $1,272,470. All costs were estimated in 2018 dollars.
Chemical percentile calculations were performed in R version 3.4.1 (The R Foundation for Statistical Computing). All other analyses were performed using Microsoft Excel in Windows 10 (Microsoft Corporation).
Results
Trends of lead, methylmercury, PBDE, and organophosphate-attributable IQ point loss over time are shown in Figure 1. In utero exposure to PBDE represented the highest burden in neurodevelopmental impairment but showed an overall declining effect from 2008 to 2016. Lead-attributable IQ point loss in children under the age of five also showed an overall decrease, especially from 2004 to 2014. In utero methylmercury exposure had the smallest effect on IQ and experienced only a slight decrease throughout the study period. Organophosphate-attributable IQ loss decreased slightly at the beginning of the study period and then increased steadily until 2010. The estimates of chemical-specific and combined IQ loss for each cycle are shown in Supplementary Table 1.
Figure 1. Trends in IQ point loss over the study period.
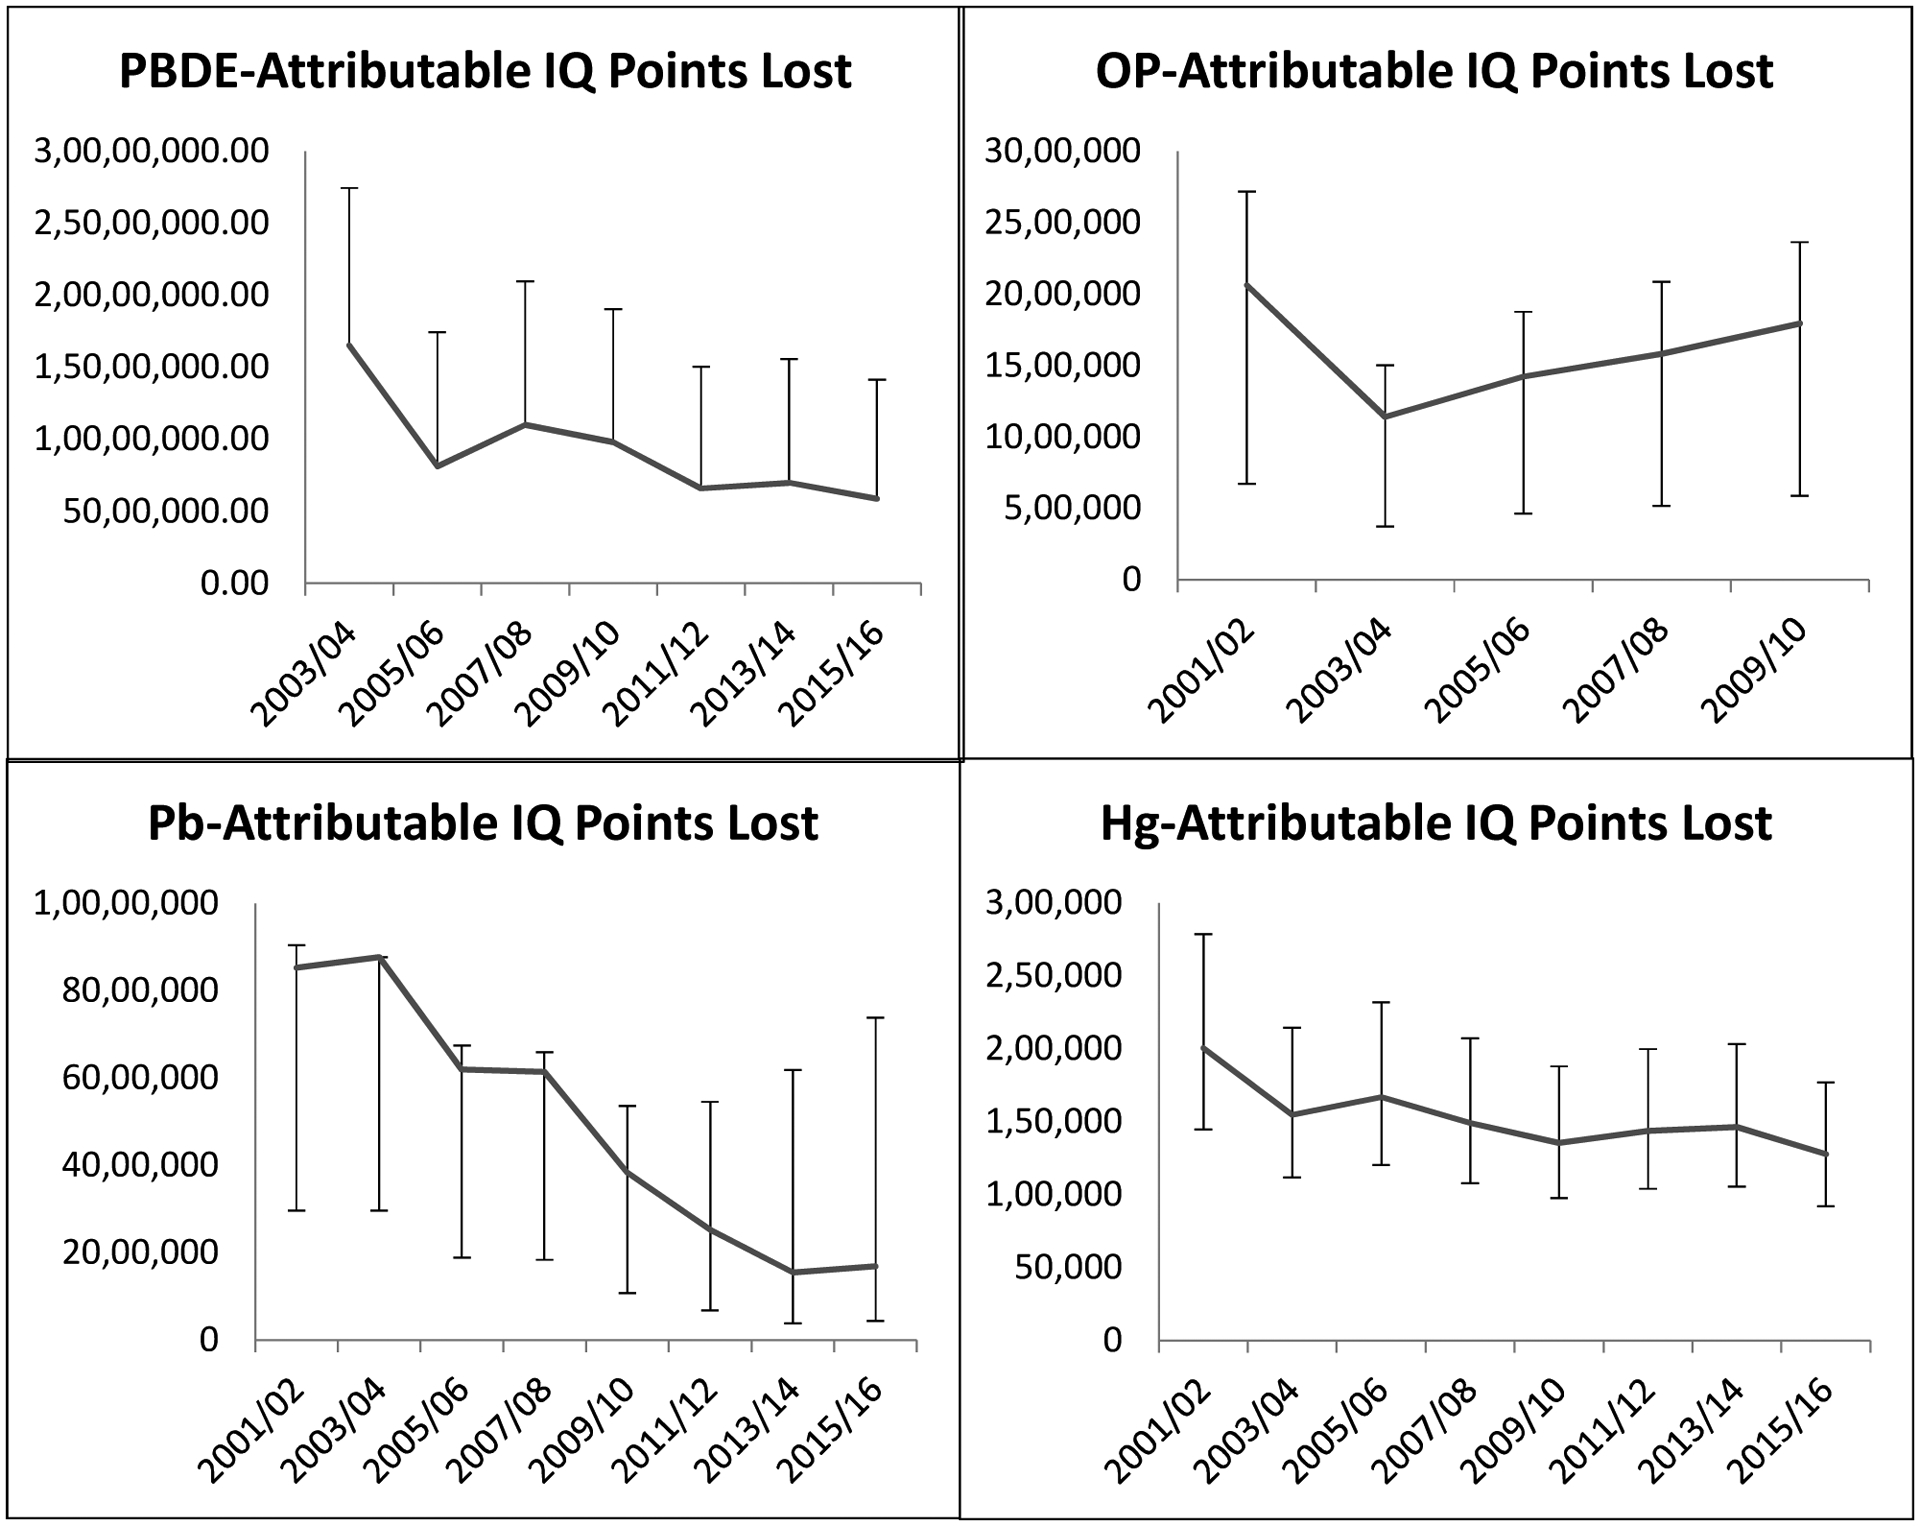
The main annual IQ point loss analysis estimates for the four chemicals are represented by the trend lines. For each chemical, we performed one to two sensitivity IQ point loss analyses for every two-year cycle using different exposure-disease association values. These estimates of which are represented by the error bars.
The total contribution of each chemical to IQ loss from 2001–2016 and the associated costs are shown in Table 1. Sensitivity estimates for IQ point loss and cost are also shown. The greatest overall IQ loss resulted from in utero PBDE exposure, followed by lead and organophosphates. PBDE exposure contributed to approximately twice the amount of IQ point lost compared to lead. Methylmercury exposure contributed to less than 1% of the total unadjusted sum of IQ points lost from all four chemicals (326 million IQ points). The chemical exposure percentiles from which these numbers were estimated are shown in Supplementary Table 2.
Table 1.
Chemical-specific IQ points lost (2001–2016)
| Main Analysis | Sensitivity Analysis | |||
|---|---|---|---|---|
| Chemical | IQ Points Lost (in millions) | Cost (in billions) | IQ Points Lost (in millions) | Cost (in billions) |
| PBDE | 162.18 | $3,611.47 | 162.18–312.86 | $3,611.47-$6,966.78 |
| OPs | 26.66 | $593.67 | 8.72–35.13 | $194.16-$782.25 |
| Hg | 2.45 | $54.51 | 1.77–3.40 | $39.37-$75.71 |
| Lead | 134.85 | $1,745.85 | 24.46–111.02 | $544.71 -$2,472.20 |
IQ point loss attributable to each chemical exposure over the total study period and associated cost. For each chemical, the data was analyzed using different disease-exposure associations to obtain sensitivity estimates. Each IQ point lost was valued at $22,268.
Table 2a shows the number of IQ points lost and ID cases attributable to lead, methylmercury, PBDE, and organophosphates, combined for each NHANES cycle. In general, the overall cost of ID cases decreased over the time of study from $159 billion annually in 2001 and 2002 to about $50 billion annually in 2015 and 2016, with some fluctuation between 2005 and 2009. This can be attributed in great part to the decreases in lead- and PBDE-attributable ID cases from 2001–2016. The costs of ID cases in addition to the costs of IQ point loss by year and by chemical are shown in Table 2b.
Table 2a.
Annual cases of ID from all chemical exposures
| Years | ID Cases per year | Annual Cost of ID Cases (in billions) | ||||
|---|---|---|---|---|---|---|
| PBDE | OP | Hg | Pb | Total | ||
| 2001/02 | 78,525 | 8,937 | 728 | 37,050 | 125,238 | $159.36 |
| 2003/04 | 80,288 | 4,655 | 560 | 37,911 | 123,413 | $157.04 |
| 2005/06 | 35,938 | 5,793 | 602 | 25,979 | 68,310 | $86.92 |
| 2007/08 | 50,047 | 6,601 | 540 | 25,631 | 82,817 | $105.38 |
| 2009/10 | 43,238 | 7,535 | 488 | 15,703 | 66,963 | $85.21 |
| 2011/12 | 27,532 | 7,448 | 522 | 10,243 | 45,744 | $58.21 |
| 2013/14 | 29,480 | 7,514 | 531 | 6,111 | 43,635 | $55.52 |
| 2015/16 | 24,386 | 7,435 | 462 | 6,718 | 38,999 | $49.62 |
Annual intellectual disability (ID) cases attributable to each chemical exposure. Each case of ID was valued at a loss of $1,272,470. Annual cost represents the cost for each year in the specified 2-year time span.
Table 2b.
Combined costs from IQ point loss and ID cases
| Years | Annual Cost | Total Cost | |||
|---|---|---|---|---|---|
| PBDE | OP | Hg | Pb | ||
| 2001/02 | $459.84 | $57.29 | $5.39 | $237.00 | $1,519.04 |
| 2003/04 | $470.17 | $31.28 | $4.15 | $243.55 | $1,498.31 |
| 2005/06 | $226.32 | $39.06 | $4.48 | $170.79 | $881.30 |
| 2007/08 | $309.00 | $43.64 | $4.01 | $169.24 | $1,051.78 |
| 2009/10 | $273.51 | $49.52 | $3.63 | $105.31 | $863.96 |
| 2011/12 | $181.59 | $48.95 | $3.87 | $69.21 | $607.23 |
| 2013/14 | $193.36 | $49.38 | $3.94 | $42.22 | $577.80 |
| 2015/16 | $162.02 | $48.86 | $3.43 | $45.99 | $520.61 |
| Total Cost | $4,551.65 | $735.97 | $65.79 | $2,166.63 | $7,520.04 |
Annual combined cost of intellectual disability cases and IQ point loss. Each case of ID was valued at a loss of $1,272,470. Each IQ point lost was valued at $22,268. Total cost was calculated by multiplying row or column sums by two to reflect the application of the estimate to two years.
The number of ID cases and associated cost attributable to each chemical from 2001–2016 is shown in Table 3. ID case number differed greatly by chemical, with PBDE at the highest with over 738,000 cases ($940 billion) compared to methylmercury with only 8,860 cases ($11 billion).
Table 3.
Chemical-specific cases of Intellectual Disability (2001–2016)
| Main Analysis | Sensitivity Analysis | |||
|---|---|---|---|---|
| Chemical | ID Cases | Cost (in billions) | ID Cases | Cost (in billions) |
| PBDE | 738,860 | $940.18 | 738,860–1,669,395 | $940.18-$2,124.25 |
| OPs | 111,830 | $142.30 | 32,983–154,742 | $41.97-$196.90 |
| Hg | 8,860 | $11.27 | 6,387–12,335 | $8.13-$15.69 |
| Lead | 330,684 | $420.78 | 93,966–460,875 | $119.57-$586.45 |
Intellectual disability (ID) cases attributable to each chemical exposure over the total study period and associated cost. For each chemical, the data was analyzed using different disease-exposure associations to obtain sensitivity estimates. Each case of ID was valued at a loss of $1,272,470.
Discussion
This analysis of NHANES chemical biomarker data shows how chemical exposure regulation can affect the health of children and neonates. From 2001–2016, exposure to these chemicals cost over $3 trillion due to loss of IQ points alone. However, these results show that better regulatory efforts may have decreased exposure to PBDEs, lead, and methylmercury, thereby preventing neurodevelopmental disability. This study adds to previously published papers that demonstrate the contribution of chemicals in the environment to childhood morbidity and resulting economic costs (Attina et al., 2016; L. Trasande & Liu, 2011; L. Trasande et al., 2015).
The greatest economic gains were due to decreases in PBDE exposure levels. The downward trend is likely a result of the phasing out of PBDE flame retardant beginning in 2004 following public concern over their toxicity (Environmental Protection Agency, 2015). Other biomonitoring studies have documented similar decreases in plasma PBDE concentrations in children who were followed from birth to nine years old from 1998 through 2013 (Cowell et al., 2018) and in pregnant women from 2008 to 2014 (Parry, Zota, Park, & Woodruff, 2018). Although these results demonstrate the benefit of regulatory action on PBDEs, evidence suggests that persistence and bioaccumulation may lead to ongoing exposures through dust and food, causing PBDE levels to plateau (Parry et al., 2018). The push to eliminate PBDE flame retardants has also led to the use of regrettable substitutions, such as organophosphorous flame retardants (OPFRs) (Bruchajzer, Frydrych, & Szymanska, 2015). Although we do not have results from human studies to date, in vitro and rat model studies show that OPFRs have toxic effects on fetal neurodevelopment when exposed in utero (Baldwin et al., 2017; Belcher, Cookman, Patisaul, & Stapleton, 2014; Rock et al., 2018).
The difference in cost due to IQ loss in 2001 ($190 billion) compared to 2016 ($38 billion) indicates that decreases in blood lead levels will produce ongoing benefits of $153 billion in savings from prevented IQ point loss. Similarly, differences in costs due to intellectual disability from 2001 ($47 billion) to 2016 ($9 billion) will produce ongoing benefits of $38 billion. These savings were calculated by subtracting the 2016 cost for IQ point loss or intellectual disability cases from the costs in 2001. Although the Environmental Protection Agency’s efforts to remove lead from gasoline and paint has resulted in declining blood lead levels, further lead control efforts are needed to reduce exposure. Leaded paint may no longer be used, but dust from remaining paint layers poses a major risk for lead inhalation and ingestion, especially among young children. The lead crisis in Flint, Michigan makes evident that lead exposure from water is not obsolete either (Hanna-Attisha, LaChance, Sadler, & Champney Schnepp, 2016; Hanna-Attisha, Lanphear, & Landrigan, 2018). In the absence of a no observed adverse effect level, it is crucial that lead intake be eliminated from exogenous sources to lower body lead burdens in children (Amaya, Jolly, & Pingitore, 2010; Lanphear et al., 2005).
While methylmercury provided the lowest contribution to neurodevelopmental disability, it continues to be a substantial contributor to neurodevelopment impairment and loss of IQ points in young children. A significant source of mercury metal exposure is through environmental pollution from coal-fired electric power generation facilities. Regulations that limit mercury emissions from coal-fired power plants were finalized in 2011 (Environmental Protection Agency, 2017), but there are still a number of plants in operation. While there is some evidence that atmospheric mercury levels have decreased (Castro & Sherwell, 2015; Zhang et al., 2016), vulnerable populations continue to be exposed, leading to loss of intelligence and increased costs to the economy and society.
Interestingly, organophosphate exposure and attributable IQ loss have increased since 2003. Organophosphates are still used in the US, although estimated usage has dropped from 71% of all insecticides used in agriculture in 2000 to 33% in 2012 (US EPA, 2017). Organophosphate exposure levels in the NHANES population have not mirrored this decline. The 1996 Food Quality Protection Act restricted and even banned the use of certain organophosphates in many settings, but such regulations on human organophosphate levels may need more time to take effect (United States Congress, 1996). The recent denial of the EPA’s proposal to ban chlorpyrifos, a widely used organophosphorous insecticide, suggests that organophosphate levels will continue to climb in the United States population due to ingestion of chlorpyrifos-treated crops (Leonardo Trasande, 2017; US EPA). Specific populations, such as agricultural workers and their families, are also at higher risk of exposure. This highlights the need for studies on prenatal organophosphate exposure to encompass a range of populations in terms of geography and occupation. As with PBDEs, regulatory action to reduce organophosphorous pesticides may result in greater use of alternative and possibly more harmful chemicals, notably pyrethroid insecticides. Studies in animal models have already reported developmental toxicities due to pyrethroid compound exposure (Awoyemi, Kumar, Schmitt, Subbiah, & Crago, 2018; Wolansky & Harrill, 2008). Without proper toxicological testing standards for industrial chemicals in the United States we run the risk of introducing chemicals that are just as bad, or even worse, for human health.
We acknowledge that there are some limitations to this analysis. The exposure-response relationships used here may differ based on population. However, most of the relationships of EDC exposure and IQ point loss were drawn from research conducted within the United States or analyses of combined exposure-response studies. Additionally, we are aware that the costs of chronic diseases can change over time. However, we only used published, peer-reviewed data to estimate the costs of disabilities and illness, not accounting for other intangible costs that may arise, and therefore likely underestimated the associated costs. There may also be speculation as to whether our results are due to a true relationship between chemical exposures and neurodevelopmental outcomes, but the use of several well-researched longitudinal birth cohort studies to estimate IQ loss for each of these four chemicals strengthens the likelihood of causality. The total burden of developmental neuroendocrine toxicity from all chemical exposures is much greater than what we calculated in this study of only four chemicals. Grandjean and Landrigan (Grandjean & Landrigan, 2014) identified 11 developmental neurotoxicants from epidemiological studies and postulate that even more remain undiscovered.
Conclusions
Although costs of regulation are frequently used to support the free use of chemicals in industry, our findings show that the reduction of chemical exposures in early life has already resulted in economic savings on the order of billions of dollars. Though further research is needed, these findings indicate that large societal benefits can result from reducing children’s exposure to toxic chemicals. However, increased regulation forces the use of alternative, and possibly untested, chemicals. Future research in this field should aim to examine the effects of these substitutions as their exposure becomes more prevalent.
Supplementary Material
Highlights.
Children are exposed to endocrine disrupting chemicals in utero and in early childhood
Endocrine disrupting chemicals are known to cause neurodevelopmental toxicity
PBDEs were the greatest contributor to IQ loss and intellectual disability
Organophosphate-attributable IQ loss and intellectual disability has increased
The overall cost of neurodevelopmental disease decreased over the study period
Acknowledgements:
We would like to thank Dr. Bruce P. Lanphear for his work modeling the exposure-response relationships with the chemicals reported in this study, which served as the basis for our analysis.
Funding: This work was supported by the National Institutes of Health [grant numbers ES022972 and ES029779].
Abbreviations:
- BFR
Brominated flame-retardant
- EDC
Endocrine disrupting chemical
- ID
Intellectual disability
- IQ
Intellectual quotient
- NHANES
National Health and Nutrition Examination Surveys
- OP
Organophosphate
- OPFR
Organophosphorous flame-retardant
- PBDE
Polybrominated diphenyl ether (estimated from PBDE47 concentration)
Footnotes
Publisher's Disclaimer: This is a PDF file of an unedited manuscript that has been accepted for publication. As a service to our customers we are providing this early version of the manuscript. The manuscript will undergo copyediting, typesetting, and review of the resulting proof before it is published in its final form. Please note that during the production process errors may be discovered which could affect the content, and all legal disclaimers that apply to the journal pertain.
Declarations of interest: ‘none’
Disclosure: Dr. Leonardo Trasande has received honoraria from Houghton Mifflin and Audible relating to writing about endocrine disruption for the public.
References
- Amaya MA, Jolly KW, & Pingitore NE Jr. (2010). Blood lead in the 21st Century: The sub-microgram challenge. J Blood Med, 1, 71–78. doi: 10.2147/jbm.S7765 [DOI] [PMC free article] [PubMed] [Google Scholar]
- Attina TM, Hauser R, Sathyanarayana S, Hunt PA, Bourguignon JP, Myers JP, … Trasande L (2016). Exposure to endocrine-disrupting chemicals in the USA: a population-based disease burden and cost analysis. Lancet Diabetes Endocrinol, 4(12), 996–1003. doi: 10.1016/s2213-8587(16)30275-3 [DOI] [PubMed] [Google Scholar]
- Awoyemi OM, Kumar N, Schmitt C, Subbiah S, & Crago J (2018). Behavioral, molecular and physiological responses of embryo-larval zebrafish exposed to types I and II pyrethroids. Chemosphere, 219, 526–537. doi: 10.1016/j.chemosphere.2018.12.026 [DOI] [PubMed] [Google Scholar]
- Axelrad DA, Bellinger DC, Ryan LM, & Woodruff TJ (2007). Dose-response relationship of prenatal mercury exposure and IQ: an integrative analysis of epidemiologic data. Environ Health Perspect, 115(4), 609–615. doi: 10.1289/ehp.9303 [DOI] [PMC free article] [PubMed] [Google Scholar]
- Baldwin KR, Phillips AL, Horman B, Arambula SE, Rebuli ME, Stapleton HM, & Patisaul HB (2017). Sex Specific Placental Accumulation and Behavioral Effects of Developmental Firemaster 550 Exposure in Wistar Rats. Sci Rep, 7(1), 7118. doi: 10.1038/s41598-017-07216-6 [DOI] [PMC free article] [PubMed] [Google Scholar]
- Bartlett ES, & Trasande L (2014). Economic impacts of environmentally attributable childhood health outcomes in the European Union. Eur J Public Health, 24(1), 21–26. doi: 10.1093/eurpub/ckt063 [DOI] [PubMed] [Google Scholar]
- Belcher SM, Cookman CJ, Patisaul HB, & Stapleton HM (2014). In vitro assessment of human nuclear hormone receptor activity and cytotoxicity of the flame retardant mixture FM 550 and its triarylphosphate and brominated components. Toxicol Lett, 228(2), 93–102. doi: 10.1016/j.toxlet.2014.04.017 [DOI] [PMC free article] [PubMed] [Google Scholar]
- Bellanger M, Demeneix B, Grandjean P, Zoeller RT, & Trasande L (2015). Neurobehavioral deficits, diseases, and associated costs of exposure to endocrine-disrupting chemicals in the European Union. J Clin Endocrinol Metab, 100(4), 1256–1266. doi: 10.1210/jc.2014-4323 [DOI] [PMC free article] [PubMed] [Google Scholar]
- Bellinger DC (2012). A strategy for comparing the contributions of environmental chemicals and other risk factors to neurodevelopment of children. Environ Health Perspect, 120(4), 501–507. doi: 10.1289/ehp.1104170 [DOI] [PMC free article] [PubMed] [Google Scholar]
- Bennett D, Bellinger DC, Birnbaum LS, Bradman A, Chen A, Cory-Slechta DA, … Witherspoon NO (2016). Project TENDR: Targeting Environmental NeuroDevelopmental Risks The TENDR Consensus Statement. Environ Health Perspect, 124(7), A118–122. doi: 10.1289/ehp358 [DOI] [PMC free article] [PubMed] [Google Scholar]
- Bouchard MF, Chevrier J, Harley KG, Kogut K, Vedar M, Calderon N, … Eskenazi B (2011). Prenatal exposure to organophosphate pesticides and IQ in 7-year-old children. Environ Health Perspect, 119(8), 1189–1195. doi: 10.1289/ehp.1003185 [DOI] [PMC free article] [PubMed] [Google Scholar]
- Bressler JP, & Goldstein GW (1991). Mechanisms of lead neurotoxicity. Biochem Pharmacol, 41(4), 479–484. doi: 10.1016/0006-2952(91)90617-e [DOI] [PubMed] [Google Scholar]
- Bruchajzer E, Frydrych B, & Szymanska JA (2015). [ORGANOPHOSPHORUS FLAME RETARDANTS - TOXICITY AND INFLUENCE ON HUMAN HEALTH]. Med Pr, 66(2), 235–264. doi: 10.13075/mp.5893.00120 [DOI] [PubMed] [Google Scholar]
- Budtz-Jorgensen E, Grandjean P, Jorgensen PJ, Weihe P, & Keiding N (2004). Association between mercury concentrations in blood and hair in methylmercury-exposed subjects at different ages. Environ Res, 95(3), 385–393. doi: 10.1016/j.envres.2003.11.001 [DOI] [PubMed] [Google Scholar]
- Castro MS, & Sherwell J (2015). Effectiveness of Emission Controls to Reduce the Atmospheric Concentrations of Mercury. Environ Sci Technol, 49(24), 14000–14007. doi: 10.1021/acs.est.5b03576 [DOI] [PubMed] [Google Scholar]
- CDC/NCHS. (2017). Birth Data Files. Retrieved March 15, 2018, from Centers for Disease Control and Prevention/National Center for Health Statistics http://www.cdc.gov/nchs/data_access/vitalstatsonline.htm
- Ceccatelli S, Dare E, & Moors M (2010). Methylmercury-induced neurotoxicity and apoptosis. Chem Biol Interact, 188(2), 301–308. doi: 10.1016/j.cbi.2010.04.007 [DOI] [PubMed] [Google Scholar]
- Centers for Disease Control and Prevention. (2005). Preventing Lead Poisoning in Young Children. Atlanta, GA: CDC [Google Scholar]
- Chen A, Yolton K, Rauch SA, Webster GM, Hornung R, Sjodin A, … Lanphear BP (2014). Prenatal polybrominated diphenyl ether exposures and neurodevelopment in U.S. children through 5 years of age: the HOME study. Environ Health Perspect, 122(8), 856–862. doi: 10.1289/ehp.1307562 [DOI] [PMC free article] [PubMed] [Google Scholar]
- Chen L, Wang X, Zhang X, Lam PKS, Guo Y, Lam JCW, & Zhou B (2017). Transgenerational endocrine disruption and neurotoxicity in zebrafish larvae after parental exposure to binary mixtures of decabromodiphenyl ether (BDE-209) and lead. Environ Pollut, 230, 96–106. doi: 10.1016/j.envpol.2017.06.053 [DOI] [PubMed] [Google Scholar]
- Cohen JT, Bellinger DC, & Shaywitz BA (2005). A quantitative analysis of prenatal methyl mercury exposure and cognitive development. Am J Prev Med, 29(4), 353–365. doi: 10.1016/j.amepre.2005.06.007 [DOI] [PubMed] [Google Scholar]
- Cowell WJ, Sjodin A, Jones R, Wang Y, Wang S, & Herbstman JB (2018). Temporal trends and developmental patterns of plasma polybrominated diphenyl ether concentrations over a 15-year period between 1998 and 2013. J Expo Sci Environ Epidemiol. doi: 10.1038/s41370-018-0031-3 [DOI] [PMC free article] [PubMed] [Google Scholar]
- Engel SM, Wetmur J, Chen J, Zhu C, Barr DB, Canfield RL, & Wolff MS (2011). Prenatal exposure to organophosphates, paraoxonase 1, and cognitive development in childhood. Environ Health Perspect, 119(8), 1182–1188. doi: 10.1289/ehp.1003183 [DOI] [PMC free article] [PubMed] [Google Scholar]
- Environmental Protection Agency. (2015). DecaBDE Phase-out Initiative. Washington D.C. [Google Scholar]
- Environmental Protection Agency. (2017). Regulatory Actions - Final Mercury and Air Toxics Standards (MATS) for Power Plants. Washington, D.C: Retrieved from https://www.epa.gov/mats/regulatory-actions-final-mercury-and-air-toxics-standards-mats-power-plants [Google Scholar]
- Eskenazi B, Chevrier J, Rauch SA, Kogut K, Harley KG, Johnson C, … Bradman A (2013). In utero and childhood polybrominated diphenyl ether (PBDE) exposures and neurodevelopment in the CHAMACOS study. Environmental health perspectives, 121(2), 257–262. doi: 10.1289/ehp.1205597 [DOI] [PMC free article] [PubMed] [Google Scholar]
- European Food Safety Authority. (2010). Scientific opinion on lead in food. EFSA J, 8, 1570. doi: 10.2903/j.efsa.2010.1570 [DOI] [Google Scholar]
- FAO/WHO. (2010). Report of 73rd Meeting: Summary and Conclusions. Joint FAO/WHO Expert Committee on Food Additives. [Google Scholar]
- Garza A, Vega R, & Soto E (2006). Cellular mechanisms of lead neurotoxicity. Med Sci Monit, 12(3), Ra57–65. [PubMed] [Google Scholar]
- Ghassabian A, & Trasande L (2018). Disruption in Thyroid Signaling Pathway: A Mechanism for the Effect of Endocrine-Disrupting Chemicals on Child Neurodevelopment. Front Endocrinol (Lausanne), 9, 204. doi: 10.3389/fendo.2018.00204 [DOI] [PMC free article] [PubMed] [Google Scholar]
- Gilbert ME, Rovet J, Chen Z, & Koibuchi N (2012). Developmental thyroid hormone disruption: prevalence, environmental contaminants and neurodevelopmental consequences. Neurotoxicology, 33(4), 842–852. doi: 10.1016/j.neuro.2011.11.005 [DOI] [PubMed] [Google Scholar]
- Gore AC, Chappell VA, Fenton SE, Flaws JA, Nadal A, Prins GS, … Zoeller RT (2015). EDC-2: The Endocrine Society’s Second Scientific Statement on Endocrine-Disrupting Chemicals. Endocr Rev, 36(6), E1–e150. doi: 10.1210/er.2015-1010 [DOI] [PMC free article] [PubMed] [Google Scholar]
- Gould E (2009). Childhood lead poisoning: conservative estimates of the social and economic benefits of lead hazard control. Environ Health Perspect, 117(7), 1162–1167. doi: 10.1289/ehp.0800408 [DOI] [PMC free article] [PubMed] [Google Scholar]
- Grandjean P, & Landrigan PJ (2014). Neurobehavioural effects of developmental toxicity. Lancet Neurol, 13(3), 330–338. doi: 10.1016/s1474-4422(13)70278-3 [DOI] [PMC free article] [PubMed] [Google Scholar]
- Grosse SD, Matte TD, Schwartz J, & Jackson RJ (2002). Economic gains resulting from the reduction in children’s exposure to lead in the United States. Environ Health Perspect, 110(6), 563–569. [DOI] [PMC free article] [PubMed] [Google Scholar]
- Hanna-Attisha M, LaChance J, Sadler RC, & Champney Schnepp A (2016). Elevated Blood Lead Levels in Children Associated With the Flint Drinking Water Crisis: A Spatial Analysis of Risk and Public Health Response. Am J Public Health, 106(2), 283–290. doi: 10.2105/ajph.2015.303003 [DOI] [PMC free article] [PubMed] [Google Scholar]
- Hanna-Attisha M, Lanphear B, & Landrigan P (2018). Lead Poisoning in the 21st Century: The Silent Epidemic Continues. Am J Public Health, 108(11), 1430. doi: 10.2105/ajph.2018.304725 [DOI] [PMC free article] [PubMed] [Google Scholar]
- Herbstman JB, Sjodin A, Kurzon M, Lederman SA, Jones RS, Rauh V, … Perera F (2010). Prenatal exposure to PBDEs and neurodevelopment. Environ Health Perspect, 118(5), 712–719. doi: 10.1289/ehp.0901340 [DOI] [PMC free article] [PubMed] [Google Scholar]
- Iavicoli I, Fontana L, & Bergamaschi A (2009). The effects of metals as endocrine disruptors. J Toxicol Environ Health B Crit Rev, 12(3), 206–223. doi: 10.1080/10937400902902062 [DOI] [PubMed] [Google Scholar]
- IOM. (1981). Costs of environment-related health effects: a plan for continuing study. Washington, D.C.: National Academy Press; [PubMed] [Google Scholar]
- Laessig SA, McCarthy MM, & Silbergeld EK (1999). Neurotoxic effects of endocrine disruptors. Curr Opin Neurol, 12(6), 745–751. doi: 10.1097/00019052-199912000-00015 [DOI] [PubMed] [Google Scholar]
- Lanphear BP, Hornung R, Khoury J, Yolton K, Baghurst P, Bellinger DC, … Roberts R (2005). Low-level environmental lead exposure and children’s intellectual function: an international pooled analysis. Environ Health Perspect, 113(7), 894–899. [DOI] [PMC free article] [PubMed] [Google Scholar]
- Masuo Y, & Ishido M (2011). Neurotoxicity of endocrine disruptors: possible involvement in brain development and neurodegeneration. J Toxicol Environ Health B Crit Rev, 14(5–7), 346–369. doi: 10.1080/10937404.2011.578557 [DOI] [PubMed] [Google Scholar]
- Naughton SX, & Terry AV Jr. (2018). Neurotoxicity in acute and repeated organophosphate exposure. Toxicology, 408, 101–112. doi: 10.1016/j.tox.2018.08.011 [DOI] [PMC free article] [PubMed] [Google Scholar]
- NHANES. (2017). Laboratory Procedures Manual. Retrieved from https://www.cdc.gov/nchs/nhanes/ [Google Scholar]
- Parry E, Zota AR, Park JS, & Woodruff TJ (2018). Polybrominated diphenyl ethers (PBDEs) and hydroxylated PBDE metabolites (OH-PBDEs): A six-year temporal trend in Northern California pregnant women. Chemosphere, 195, 777–783. doi: 10.1016/j.chemosphere.2017.12.065 [DOI] [PMC free article] [PubMed] [Google Scholar]
- Rock KD, Horman B, Phillips AL, McRitchie SL, Watson S, Deese-Spruill J, … Patisaul HB (2018). EDC IMPACT: Molecular effects of developmental FM 550 exposure in Wistar rat placenta and fetal forebrain. Endocr Connect, 7(2), 305–324. doi: 10.1530/ec-17-0373 [DOI] [PMC free article] [PubMed] [Google Scholar]
- State of California Department of Consumer Affairs. (2013). Technical bulletin 117–2013. Retrieved from http://www.bearhfti.ca.gov/laws/tb117_2013.pdf
- Trasande L (2017). When enough data are not enough to enact policy: The failure to ban chlorpyrifos. PLoS Biology, 15(12), 1–6. doi: 10.1371/journal.pbio.2003671 [DOI] [PMC free article] [PubMed] [Google Scholar]
- Trasande L, & Liu Y (2011). Reducing the staggering costs of environmental disease in children, estimated at $76.6 billion in 2008. Health Aff (Millwood), 30(5), 863–870. doi: 10.1377/hlthaff.2010.1239 [DOI] [PubMed] [Google Scholar]
- Trasande L, Zoeller RT, Hass U, Kortenkamp A, Grandjean P, Myers JP, … Heindel JJ (2015). Estimating burden and disease costs of exposure to endocrine-disrupting chemicals in the European union. J Clin Endocrinol Metab, 100(4), 1245–1255. doi: 10.1210/jc.2014-4324 [DOI] [PMC free article] [PubMed] [Google Scholar]
- United States Congress. (1996). Food Quality Protection Act. Retrieved from http://www.gpo.gov/fdsys/pkg/PLAW-104publ170/pdf/PLAW-104publ170.pdf [Google Scholar]
- US Census Bureau. (2018). American Fact Finder. Retrieved March 15, 2018, from United States Census Bureau https://factfinder.census.gov/faces/nav/jsf/pages/index.xhtml [Google Scholar]
- US EPA. EPA Administrator Pruitt Denies Petition to Ban Widely Used Pesticide [Speeches, Testimony and Transcripts]. 2017. [updated 2017–05-30] https://www.epa.gov/newsreleases/epa-administrator-pruitt-denies-petition-ban-widely-used-pesticide-0.
- US EPA. (2017). Pesticides Industry Sales and Usage 2008–2012 Market Estimates. Washington, DC: US Environmental Protection Agency [Google Scholar]
- Wolansky MJ, & Harrill JA (2008). Neurobehavioral toxicology of pyrethroid insecticides in adult animals: a critical review. Neurotoxicol Teratol, 30(2), 55–78. doi: 10.1016/j.ntt.2007.10.005 [DOI] [PubMed] [Google Scholar]
- Yang C, Song G, & Lim W (2019). A mechanism for the effect of endocrine disrupting chemicals on placentation. Chemosphere, 231, 326–336. doi: 10.1016/j.chemosphere.2019.05.133 [DOI] [PubMed] [Google Scholar]
- Zhang Y, Jacob DJ, Horowitz HM, Chen L, Amos HM, Krabbenhoft DP, … Sunderland EM (2016). Observed decrease in atmospheric mercury explained by global decline in anthropogenic emissions. Proc Natl Acad Sci U S A, 113(3), 526–531. doi: 10.1073/pnas.1516312113 [DOI] [PMC free article] [PubMed] [Google Scholar]
Associated Data
This section collects any data citations, data availability statements, or supplementary materials included in this article.