

Abstract
Background:
3-Hydroxy-3-methyl-glutaryl-coenzyme A (HMG-CoA) reductase inhibitors (statins) markedly reduce serum cholesterol and have anti-inflammatory effects. The effect of cholesterol-lowering diets on inflammatory biomarkers is less well known.
Objective:
To compare the efficacy of a dietary combination (portfolio) of cholesterol-lowering foods vs a statin in reducing C-reactive protein (CRP) as a biomarker of inflammation linked to increased cardiovascular disease risk.
Methods:
In all, 34 hyperlipidemic subjects completed three 1-month treatments as outpatients in random order: a very low-saturated fat diet (control); the same diet with 20 mg lovastatin (statin); and a diet high in plant sterols (1.0 g/1000 kcal), soy protein (21.4 g/1000 kcal), viscous fibers (9.8 g/1000 kcal), and almonds (14 g/1000 kcal) (portfolio). Fasting blood samples were obtained at weeks 0, 2, and 4.
Results:
Using the complete data, no treatment reduced serum CRP. However, when subjects with CRP levels above the 75th percentile for previously reported studies (>3.5 mg/l) were excluded, CRP was reduced similarly on both statin, −16.3±6.7% (n=23, P=0.013) and dietary portfolio, −23.8±6.9% (n=25, P=0.001) but not the control, 15.3±13.6% (n=28, P=0.907). The percentage CRP change from baseline on the portfolio treatment (n=25) was greater than the control (n=28, P=0.004) but similar to statin treatment (n=23, P=0.349). Both statin and portfolio treatments were similar in reducing CRP and numerically more effective than control but only the change in portfolio was significant after the Bonferroni adjustment.
Conclusions:
A combination of cholesterol-lowering foods reduced C-reactive protein to a similar extent as the starting dose of a first-generation statin.
Keywords: almonds, soy protein, viscous dietary fiber, plant sterols, national cholesterol education program diet, low saturated fat
Introduction
Diet has traditionally been advocated before drugs to reduce the risk of cardiovascular disease. Statins, the most commonly used drugs to prevent cardiovascular disease, were developed specifically to inhibit cholesterol synthesis. Numerous studies have documented their effectiveness in both reducing serum cholesterol and also the incidence of coronary heart disease (CHD) (Scandinavian Simvastatin Survival Study Group, 1994; Downs et al, 1998; Heart Protection Study Collaborative Group, 2002; Shepherd et al, 1995; Sacks et al, 2000; Herrington et al, 2002). Now interest in this class of drugs has been extended to their pleiotropic effects which include anti-inflammatory actions, typically focusing on the reduction of C-reactive protein (CRP) as a marker of inflammation (Ridker et al, 2001). Inflammation is considered by many to play a key role in cardiovascular disease (Rifai & Ridker, 2002), and CRP has been proposed as an important biomarker of CHD risk (Ridker et al, 1998a, 1998b, 2002).
The concern with use of diet in reducing CHD risk is that cholesterol reductions have in general been small compared with those achieved with statins and there has been no evidence that currently used cholesterol-lowering diets have anti-inflammatory effects. Recently, we demonstrated in a parallel study involving 46 subjects that by using a combination of cholesterol-lowering foods, a marked reduction in serum cholesterol could be achieved (Jenkin et al, 2003). This diet also appeared to reduce CRP by 28% (Jenkin et al, 2003). Of the 46 original subjects, 34 subjects have now taken all three treatments; control, statin, and combination diets, in a randomized crossover design to allow the effects of a statin to be compared directly with the combination diet taken by the same subjects. The detailed lipid results are the subject of a separate publication (Jenkins et al, 2005). This report documents the direct comparison in the same subject of changes in CRP following control, statin, and portfolio treatments.
Methods
Participants
A total of 34 healthy hyperlipidemic participants completed all three phases of the study (control, statin, and portfolio); 20 men and 14 postmenopausal women; (mean±s.d.) age 58.4±8.6 y (range 36–71 y); body mass index (BMI) 27.3±3.3 kg/m2 (range 20.5–35.5 kg/m2). Participants’ baseline characteristics are shown in Table 1. In all, 55 participants were recruited from hyperlipidemic patients attending the Clinical Nutrition and Risk Factor Modification Center, St Michael's Hospital and from newspaper advertisements. Four participants who were randomized did not start the study. Seven participants were withdrawn or withdrew during or following a control treatment, the respective figures for the statin and portfolio treatments were seven and three participants. Five participants could not begin their third phase of the study due to precautions undertaken to minimize exposure to the Severe Acute Respiratory Syndrome (SARS) virus (Figure 1). All participants had previously raised LDL-cholesterol levels (>4.1 mmol/l) (Expert Panel on Detection, Evaluation, and Treatment of High Blood Cholesterol in Adults, 2001). No participant had a history of cardiovascular disease, untreated hypertension (blood pressure >140/90 mmHg), diabetes, renal or liver disease and none were taking medications known to influence serum lipids apart from three women who were on stable doses of thyroxine, one of whom was also taking stable estrogen replacement therapy. Of the 34 participants who completed all treatments, 16 participants had been placed on statins and had discontinued them at least 2 weeks prior to each treatment period. Five participants were taking antihypertensive medications at a constant dose prior to and during the study and seven participants took aspirin and other non-steroidal anti-inflammatory drugs during the study on a regular basis, 10 participants had colds and ‘flu’-like episodes immediately before or at the time of blood sampling, and five subjects suffered from hard or soft tissue injury (osteoarthritis, tendonitis) with occasional use of analgesics or anti-inflammatory drugs.
Table 1.
Age, race, body weight, BMI, blood pressure, and blood lipids of participants at baseline
| Men | Women | |
|---|---|---|
| Number (race) | 20 (16E, 2I, 1C, 1 H) | 14 (13E, 1B) |
| Age (y) | 55.4±8.6 | 62.7±6.9 |
| Body weight (kg) | 82.4±10.9 | 67.8±10.5 |
| BMI (kg/m2) | 27.3±3.2 | 27.3±3.7 |
| Blood pressure | ||
| Systolic (mmHg) | 120.0±12.4 | 121.6±11.5 |
| Diastolic (mmHg) | 77.3±6.8 | 76.0±7.3 |
| Cholesterol | ||
| Total (mmol/l) | 6.58±1.02 | 6.75±0.83 |
| LDL (mmol/l) | 4.38±0.82 | 4.49±0.77 |
| HDL (mmol/l) | 1.12±0.16 | 1.32±0.39 |
| Triglycerides (mmol/l) | 2.40±1.11 | 2.07±0.94 |
| C-reactive protein (mg/l) | 0.96±0.62 | 1.60±1.16 |
Data are expressed as mean±s.d.
E=European; I=Indian subcontinent; C=Chinese; B=Black; H=Hispanic.
To convert cholesterol and triglycerides to mg/dl, multiply by 38.67 and 88.57, respectively.
Figure 1.
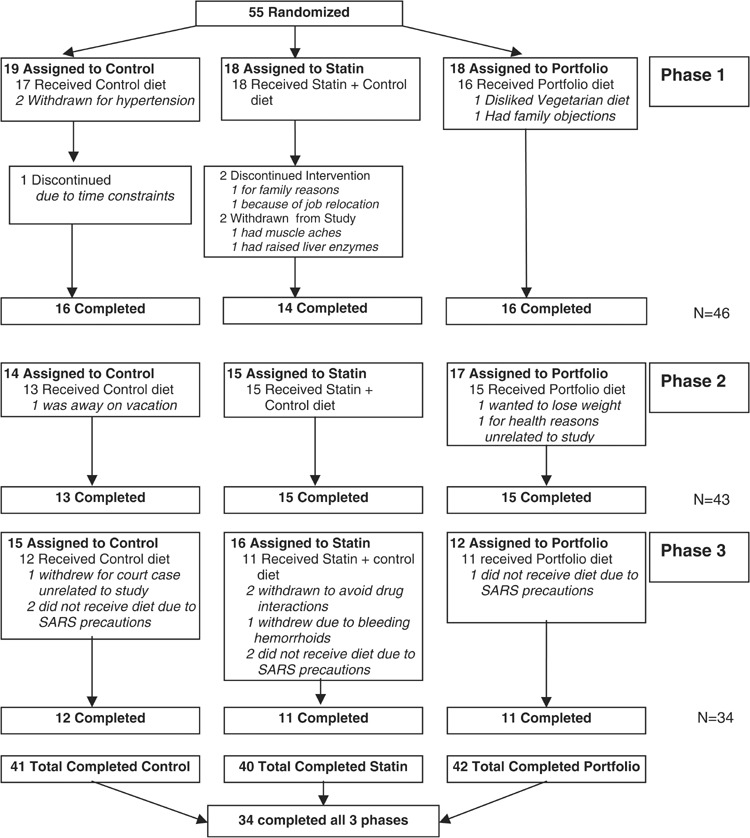
Flow diagram showing progress of patient through the trial.
Study protocol
The study was conducted during the late summer, fall, winter months and early spring to avoid summer holiday travel and followed a randomized crossover design with three 1-month treatments separated by 2–6 weeks washout periods between treatments. Participants followed their own low-saturated-fat therapeutic diets for 1 month prior to the start of the study and during the 2–6 weeks washout periods between treatments. They were randomized to start with either the very low-saturated-fat dairy and whole-wheat cereal diet with a statin (statin) or without a statin (control) or a similarly low-saturated-fat diet containing viscous fibers, plant sterols, soy foods, and almonds (portfolio). All foods were provided except for fresh fruit and vegetables. Fasting body weights were checked weekly and blood samples were obtained for CRP measurement after 12 h overnight fasts at weeks 0, 2, and 4. Seven-day diet histories were obtained for the week prior to the 1-month treatment periods. Completed menu checklists were returned at weekly intervals during the one-month diet period and checked by the dietitians who also recorded the previous week's exercise and encouraged participants to maintain a constant level of activity over the study period.
The statistician whose location was geographically separate from the clinic randomized the participants using a pseudorandom number generating facility within the SAS statistical software package (SAS Institute, 1997). The statistician held the code for placebo or lovastatin capsules that were identical in appearance and were provided on the control and statin treatments, respectively. This aspect of the study was therefore double blinded. No tablets were provided on the portfolio phase. The dietitians were not blinded to the diet since they were responsible for packing the patients’ diets and for checking their diet records. The laboratory staff responsible for analyses were blinded to treatment and received samples labeled with name codes and date.
The Ethics Committees of the University of Toronto and St. Michael's Hospital approved the study. Written informed consent was obtained from all participants.
Diets
Prior to the 4-week study, the participants ate their routine therapeutic low-fat diets with mean macronutrient profiles that were close to current NCEP guidelines (≤7% energy from saturated fat and <200 mg/d dietary cholesterol) (Expert Panel on Detection, Evaluation, and Treatment of High Blood Cholesterol in Adults, 2001) (Table 2).
Table 2.
Nutritional profiles of self-selected prestudy diets recorded by participants prior to starting the control, statin, and portfolio dietary treatments
| Control group (n=34) | Statin group (n=31) | Portfolio group (n=32) | |
|---|---|---|---|
| Energy (kcal/day) | 1824 | 1796 | 1812 |
| Total protein (g/day) (% calories) | 82 (18.6) | 84 (19.1) | 86 (19.3) |
| Vegetable protein (g/day) (% calories) | 34 (7.4) | 32 (7.2) | 33 (7.4) |
| Available carbohydrates (g/day) (% calories) | 245 (53.8) | 235 (52.2) | 233 (52.1) |
| Total dietary fiber (g/day) (g/1000 kcal) | 29 (16.3) | 29 (16.4) | 28 (16.4) |
| Total fat (g/day) (% calories) | 52 (25.3) | 53 (26.6) | 56 (26.9) |
| SFA (g/day) (% calories) | 15 (7.2) | 15 (7.6) | 16 (7.5) |
| MUFA (g/day) (% calories) | 21 (10.2) | 22 (10.9) | 22 (10.6) |
| PUFA (g/day) (% calories) | 11 (5.6) | 11 (5.6) | 13 (6.0) |
| Dietary cholesterol (mg/day) (mg/1000kcal) | 189 (99.7) | 182 (102.4) | 188 (105.2) |
| Alcohol (g/day) (% calories) | 7 (2.3) | 6 (2.1) | 5 (1.7) |
SFA=saturated fatty acids; MUFA=monounsaturated fatty acids; PUFA=polyunsaturated fatty acids.
Weight-maintaining diets were provided during the 4-week study periods. All diets were vegetarian. The aim of the portfolio diet was to provide 1.0 g plant sterols per 1000 kcal of diet in a plant sterol ester enriched margarine; 9.8 g viscous fibers per 1000 kcal of diet from oats, barley and psyllium; 21.4 g soy protein per 1000 kcal as soy milk and soy meat analogues; and 14 g whole almonds per 1000 kcal of diet. This dietary portfolio has been described in detail previously (Jenkins et al, 2002b, 2003, 2005).
Skim milk, fat-free cheese and yoghurt, egg substitute, and liquid egg white were used on the control diet to achieve low saturated fat intakes. A high fiber intake was provided through whole wheat breakfast cereals (2.0 g TDF/1000 kcal) and bread (2.5 g TDF/1000 kcal) and wheat bran added to a high dairy protein muffin (7.25 g TDF/1000 kcal of diet). High monounsaturated fatty acid sunflower oil (9 g/1000 kcal) and safflower oil (5 g/1000 kcal) were also incorporated into the control diet (e.g. muffins) to balance the fatty acid profile on the portfolio diet. The macronutrient profiles of the diets recorded as consumed in week 4 are given in Table 3.
Table 3.
Nutritional profiles of control, statin and portfolio diets provided to participants and recorded as eaten at week 4
| Control diet (n=34) | Statin diet (n=34) | Portfolio (test) diet (n=34) | |
|---|---|---|---|
| Energy (kcal/day) | 2345 | 2333 | 2366 |
| Total protein (g/day) (% calories) | 129 (22.1) | 129 (22.3) | 129 (21.9) |
| Vegetable protein (g/day) (% calories) | 26 (4.3) | 26 (4.5) | 127 (21.6) |
| Available carbohydrates (g/day) (% calories) | 309 (52.6) | 304 (52.1) | 289 (48.7) |
| Total dietary fiber (g/day) (g/1000 kcal) | 55 (23.1) | 54 (23.2) | 77 (32.8) |
| Total fat (g/day) (% calories) | 65 (24.9) | 65 (25.1) | 77 (29.2) |
| SFA (g/day) (% calories) | 12 (4.6) | 12 (4.7) | 16.6 (6.3) |
| MUFA (g/day) (% calories) | 27 (10.3) | 27 (10.2) | 32 (12.1) |
| PUFA (g/day) (% calories) | 23 (8.8) | 24 (9.1) | 26 (10.0) |
| Dietary cholesterol (mg/day) (mg/1000 kcal) | 28 (12.2) | 33 (14.4) | 55 (24.0) |
| Alcohol (g/day) (% calories) | 0.4 (0.1) | 0.9 (0.3) | 0.2 (0.1) |
SFA=saturated fatty acids; MUFA=monounsaturated fatty acids; PUFA=polyunsaturated fatty acid.
Compliance was assessed from the completed weekly checklists and from the return of uneaten food items.
Statin
Twenty mg lovastatin and placebo capsules (lactose) were dispensed by the Hospital Pharmacy in identical containers according to the randomization determined by the statistician. Participants were asked to take one capsule (20 mg lovastatin or placebo) daily in the evening for the 28 days of the study and to return the containers for capsule counts at the end of the month.
Analyses
All samples from a given individual were labelled by code and analyzed in the same batch. Serum samples, stored at −70°C, were analyzed for CRP by end-point nephelometry (coefficient of variation, 3.5%) (Behring BN-100, N high-sensitivity CRP reagent, Dade-Behring, Mississauga, Ontario, Canada).
Diets were analyzed using a program based on US Department of Agriculture data and developed in our laboratory (Jenkins et al, 2002b).
Statistical analysis
The results were expressed as means±s.e. No significant differences in blood CRP were seen between weeks 2 and 4 values; week 4 values were therefore used throughout for all analyses as the end point value. The significance of the differences between treatments was assessed by least squares means with Tukey–Kramer adjustment for multiple comparisons (SAS Institute, 1997). The ANOVA model used the absolute CRP reduction as well as percentage change from baseline as the response variable and treatment, sex, sex by treatment interaction and a random participant term nested within sex by sequence as main effects. The absolute CRP reductions were also assessed using the ANCOVA model with baseline as the covariate. To minimize the risk of including subjects who may have had transient elevations of CRP due to infections or injury, the primary analysis eliminated values above 3.5 mg/l since in a recent analysis of studies measuring CRP in men and women the 75th percentile for women was 3.48 mg/l and for men the value was 3.2 mg/l (Ockene et al, 2001; Rifai & Ridker, 2003). The distribution of responses was far from normal, and because such extreme departures from normality can bias the results of an F-test (Neter et al, 1985), data were transformed to obtain a more normal sample distribution. To achieve this, the two-parameter family of Box–Cox transformations (Box and Cox, 1964) was used. We applied a grid search procedure to maximize the Shapiro–Wilk statistics, the statistics applied most often to test the hypothesis of an underlying normal distribution. A special macro was written by using SAS software (SAS Institute, Inc., Cary, NC, USA) to estimate the parameter in Box–Cox transformation. A secondary analysis was also carried out including all participants who had completed at least one or two of the three phases (three and nine participants, respectively) as part of an intention to treat analysis, increasing the total number of subjects from 34 on control, statin and portfolio to 41, 40, and 42, respectively. This analysis did not include subjects who had no post baseline value, but included two subjects whose week 2 value was carried forward to week 4. Wilcoxon signed rank test was used to assess the significance of the change from pretreatment. The nonparametric sign test was used to assess whether the statin or portfolio diets were significantly different in reducing CRP for completers and with the intention to treat analysis of the total group including noncompleters. Spearman correlation was used to assess association between CRP and anthropometric data, due to the skewed nonnormal distribution of the CRP data (SAS Institute, 1997). The data were analyzed three times: first as the complete data, and subsequently, on the basis of these results, by two post hoc analyses. The aim of these post hoc analyses were to determine the effect of reducing the scatter seen with CRP that is often related to acute infection and other nondiet related events. For these analyses maximum levels of 10 mg/l, a commonly accepted upper level (Ockene et al, 2001) and 3.5 mg/l, the 75% from a large meta-analysis (Rifai & Ridker, 2003), were used as the upper levels of values for inclusion.
Results
Compliance was good as assessed from completed metabolic diet checklists and return of uneaten food items. Over 90% of all calories provided were recorded as consumed on all three treatments. 98% of the capsules provided were consumed. All participants felt they were eating as much food as they were capable without experiencing discomfort (satiety rating <3.0) at week 4 (control 2.0±0.2, statin 1.8±0.2, portfolio 2.6±0.2). Participants lost a similar minimal amount of weight on all three treatments (Table 1) (control, −0.15±0.09 kg, P=0.116; statin, 0.00±0.09 kg, P=0.994; portfolio, −0.23±0.11 kg, P=0.047).
C-reactive protein
No differences were seen between the three treatment groups in baseline CRP measurements and no significant treatment differences were observed using all data points. However when the analysis was restricted to CRP values ≤3.5 mg/l for the 34 subjects who completed all three phases (Figure 2), the absolute reduction from baseline at 4 weeks was significant for statin and portfolio (−0.32±0.12 mg/l, n=23, P=0.006 and −0.41±0.11 mg/l, n=25, P=0.001, respectively) but not for control (−0.05±0.14 mg/l, n=28, P=0.397). Expressed as a percentage of the baseline value, the respective changes for control, statin, and portfolio were 15.3±13.6% (n=28, P=0.907); −16.3±6.7% (n=23, P=0.013); and −23.8±6.9% (n=25, P=0.001), respectively (Table 4). Including also the noncompleters, for the control, statin, and portfolio diets, the absolute change from baseline was −0.06+0.13 mg/l (n=32, P=0.366); −0.33+0.10 mg/l (n=28, P=0.001); and −0.34+0.10 mg/l (n=31, P=0.001), respectively. Again, expressed as a percentage of the baseline value the respective changes were 14.3±12.0% (n=32, P=0.863); −17.4±5.6% (n=28, P=0.002); and −21.1±6.4% (n=31, P=0.012).
Figure 2.
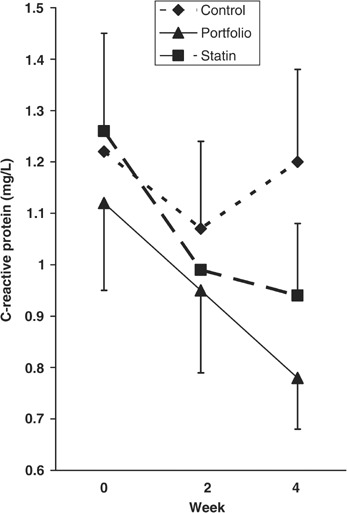
Mean C-reactive protein concentrations at week 0, 2, and 4 in the 34 subjects who completed all three treatments. Only subjects with values ≤3.5 mg/l for weeks 0, 2, 4 were included in the analysis. (Control, n=25; Statin, n=23; and Portfolio, n=23).
Table 4.
Effect of control, statin and portfolio treatments on body weight, blood pressure and CRP
| Control | Statin | Portfolio | |||||||
|---|---|---|---|---|---|---|---|---|---|
| Week 0 | n | % Change a | Week 0 | n | % Change a | Week 0 | n | % Change a | |
| Body weight (kg) | 76.1±2.2 | 34 | −0.3±0.2a | 76.4±2.3 | 34 | 0.0±0.2a | 76.4±2.2 | 34 | −0.1±0.1a |
| Blood pressure (mmHg) | |||||||||
| Systolic | 119±2 | 34 | −1.9±1.3a | 121±2 | 34 | −2.9±1.4a | 121±2 | 34 | −4.1±1.5a |
| Diastolic | 75±1 | 34 | −2.0±1.5a | 77±1 | 34 | −4.6±1.4a | 77±1 | 34 | −5.9±1.3a |
| C−reactive protein (mg/l) (≤3.5 mg/l) | 1.27±0.17 | 28 | 15.3±13.6a | 1.26±0.19 | 23 | −16.3±6.7ab | 1.30±0.19 | 25 | −23.8±6.9b |
| C−reactive protein (mg/l)+noncompleters (≤3.5 mg/l) | 1.25±0.16 | 32 | 14.3±12.0a | 1.30±0.17 | 28 | −17.4±5.6ab | 1.34±0.16 | 31 | −21.1±6.4b |
aChange from week 0 to week 4. Letters that are different represent significant difference in the change from baseline, P<0.05.
Both the absolute reduction and percentage reduction from baseline in CRP were significantly greater on the portfolio than the control treatment (P=0.043 and P=0.004, respectively) using the ANOVA model. The difference between statin and control did not reach significance (absolute reduction: P=0.388, percentage of change: P=0.194), but the statin and portfolio treatments were similar (absolute reduction: P=0.595, percentage of change: P=0.349). Similar results were obtained using the ANCOVA model with baseline as the covariate (data not presented). Since the data were analyzed three times: first as the complete data, but also after elimination of CRP values greater than 10 mg/l or 3.5 mg/l, the Bonferroni adjustment (critical α level, P<0.017) was applied to assess the significance of the three comparisons. The only comparison of significance after the Bonferroni adjustment (P<0.017) was the greater percentage reduction from baseline in CRP on the portfolio compared to the control treatment using data with CRP≤3.5 mg/l (P=0.004).
Differences were observed between the sexes in response to the treatments, since a significant interaction effect of sex and treatment was found (P=0.035). For women, on the portfolio treatment, the absolute reduction in CRP was significantly greater than on the control treatment (P=0.034), and for the statin it was nonsignificant (P=0.824). While for men, neither the difference between statin and control nor that between portfolio and control reached significance (P=0.958 and P=0.378, respectively).
Using week 0 and week 4 data on the 34 completers (excluding those with CRP values >3.5 mg/l), the portfolio treatment was significantly more effective (P=0.033) than the control diet in reducing blood CRP, that is, showing a negative value for the change from weeks 0 to 4 (control diet, 54%, 15/28; portfolio, 80%, 20/25). Both the statin and portfolio treatments were similarly effective (P=0.500) (statin, 78%, 18/23). Addition of the incomplete studies from the 12 participants who completed only one or two of the three phases gave similar results to the 34 participants who completed all three phases. The total number of participants who undertook control, statin, and portfolio phases (with CRP< 3.5 mg/l) increased to 32, 28, and 31 participants, respectively. Again the portfolio treatment was more effective (P=0.019) than the control diet in reducing blood CRP and again the statin and portfolio treatments were similarly effective (P=0.500) (control diet, 53%, 17/32; statin, 79%, 22/28; portfolio, 77%, 24/31).
Associations with CRP
When using the complete data from 34 subjects for weeks 0 and 4 of all three treatments, CRP was significantly related at baseline to BMI (n=34, r=0.40, P=0.018) (Table 5) and a similar result was obtained when those with CRP>3.5 mg/l were excluded (n=27, r=0.45, P=0.019). There were no other significant associations with CRP and no significant associations between change in CRP and change in BMI (Table 5).
Table 5.
Correlation for baseline and changes in CRP with the respective values for BMI, total cholesterol, LDL cholesterol, HDL cholesterol, triglycerides, systolic BP, diastolic BP (34 subjects)
| (a) Baseline vs Baseline | r | P |
|---|---|---|
| BMI baseline | 0.40403 | 0.0178 |
| Total cholesterol baseline | 0.23301 | 0.1848 |
| LDL-cholesterol baseline | 0.17925 | 0.3104 |
| HDL-cholesterol baseline | −0.10514 | 0.5540 |
| Triglycerides baseline | 0.26129 | 0.1355 |
| SBP baseline | 0.19928 | 0.2585 |
| DBP baseline | 0.27523 | 0.1152 |
| (b) Change vs change (endpoint vs baseline) | ||
| BMI change | −0.09825 | 0.5804 |
| Total cholesterol change | −0.04156 | 0.8155 |
| LDL-cholesterol change | 0.09840 | 0.5798 |
| HDL-cholesterol change | −0.08817 | 0.6200 |
| Triglycerides change | −0.18292 | 0.3005 |
| SBP change | −0.30224 | 0.0823 |
| DBP change | −0.07994 | 0.6531 |
Of the 367 CRP values, 58 were greater than 3.5 mg/l (ie 3.5 mg/l representing the 84th percentile for weeks 0, 2, and 4). Of the values greater than 3.5 mg/l, 41.4% (24 incidents) were associated with documented infections, joint pain or soft tissue injury immediately before or at the time of blood sampling with or without the use of analgesics or anti-inflammatory drugs. The respective percentage for those with CRP values less than 3.5 mg/l was 20.4% (63 incidents).
Discussion
These data demonstrate that a diet that has been shown to be effective in lowering serum cholesterol also lowers CRP to the same extent as a statin when taken by the same individuals. The reduction in CRP of 16.3% on lovastatin in this study was similar to that reported in a large study where lovastatin was used, 14.8% (Ridker et al, 2001). If CRP is accepted as a nonlipid risk factor for heart disease then this dietary reduction of CRP provides evidence for an additional benefit of a cholesterol lowering diet in reducing CHD risk.
At present, unlike LDL-cholesterol, there are no prospective studies designed specifically to lower CRP that have been shown to reduce the incidence of cardiovascular events. The situation is therefore similar to homocysteine where strong associations have been demonstrated with cardiovascular disease (The Homocysteine Studies Collaboration, 2002), but the results of large randomized control trials are not yet available to provide more definitive evidence for a cause and effect relation. At present, there are strong associations between CRP and cardiovascular disease (Ridker et al, 1998a, 1998b, 2002) especially in women (Ridker et al, 2002), which appear to have a powerful predictive value similar to the LDL-cholesterol to HDL-cholesterol ratio (Ridker et al, 1998a). Furthermore, a large reduction in CHD risk by statins is seen in subjects with normal LDL-cholesterol levels but high CRP levels at baseline (Ridker et al, 2002). Increased body weight, central adiposity, and insulin resistance are associated with raised CRP levels (Ford, 1999, Yudkin et al, 1999; Lemieux et al, 2001). In the present study, BMI at baseline was one of the determinants of CRP. The link is presumably through adipose tissue-derived proinflammatory cytokines (eg IL-6) and their effect on hepatic acute phase proteins (Rattazzi et al, 2003).
However, one concern with CRP and its potential predictive value in CHD is how to control for physiological and noncardiovascular pathological variations in CRP. This variability is also a likely explanation for why not all statin trials have shown reduced CRP concentrations (Dangas et al, 1999; Cortellaro et al, 2000; Kalela et al, 2001). CRP concentrations are increased by infection (Tillet and Francis, 1930; Ledue & Rifai, 2003) and estrogens (Ridker et al, 1999; Pradhan et al, 2002), and influenced by lifestyle manipulations, including alcohol intake and regular exercise, which tend to depress CRP (Cushman et al, 1999; Albert et al, 2003), and smoking which may increase it (Albert et al, 2003; Frohlich et al, 2003). Although many of these factors are also associated with CHD risk and may therefore contribute to the overall usefulness of CRP, acute changes may reduce the predictive value of CRP seen in cohort studies (Danesh et al, 2004; Tall, 2004) and confound short-term intervention studies such as this one. In this respect, it may be noteworthy that the phases two and three of the present study were carried out during the winter months and on into Spring. Phase one, which was also the focus of a previous study, and which showed a clearer effect of the dietary portfolio in lowering CRP, was carried out largely in the late Summer and Fall. It may be that unreported respiratory infections, common in winter, may have resulted in increased variability in the CRP data as reflected in the current analysis. The present study was well complied with both in terms of percentage of tablets taken and dietary calories reported as consumed. In addition, a relatively uniform reduction in LDL-cholesterol was seen at 2 and 4 weeks on both the statin and portfolio treatments (Jenkins et al, 2003, 2005). The present study had the advantage that alcohol intake was limited in the prestudy period and was not allowed on the metabolic diets. Exercise was also held constant throughout the study period and only one subject smoked (<5 cigarettes daily) during the study period. Nevertheless, despite these precautions, when using unrestricted CRP data no treatment effect was observed. In order to obtain sufficient definition to establish the effects of statin and dietary portfolio on CRP it was necessary to eliminate values exceeding 3.5 mg/l. This value was selected because it was the 75th percentile in pooled analysis of the Physicians’ Health Study (PHS), the Air Force/Texas Coronary Atherosclerosis Prevention Study (AFCAPS/TexCAPS), the Women's Health Initiative (WHI), and the Women's Health Study (WHS) (Ockene et al, 2001) and the 84th percentile in our group of both men and women. Currently the American Heart Association and the Centers for Disease Control recommend CRP as part of the assessment of cardiovascular disease risk, where ≤1 mg/l is low risk, 1–3 mg/l is intermediate risk and >3 mg/l is high risk (Pearson et al, 2003). Our study therefore covers the intermediate risk range. Of those subjects with values greater than 3.5 mg/l, 41.4% had a reason, such as ‘flu’-like illnesses, infections or tissue injury for a raised CRP compared to 20.4% for those individuals with values less than 3.5 mg/l. The respective values from other studies where 10 mg/l was the upper level for CRP (Jenkins et al, 2002b) were 80% for subjects with values above 10 mg/l and 30% for those below (Ockene et al, 2001). These studies have been much more inclusive in defining infections that may have been associated with raised CRP levels. They have included infections that occurred up to 90 days prior to blood sampling (Pischon et al, 2003). Our data are likely to have underestimated the effect of infections. Increasing the range to as little as 2 weeks prior to blood sampling would have increased the percentage of raised CRP levels for which we could account to 48.2%.
Few previous studies have demonstrated an effect of diet on CRP. Recently ω-3 vegetable oils and monounsaturated fats have been shown to reduce CRP as have low glycemic index diets (Pischon et al, 2003; Blok et al, 1997; Liu et al, 2002). Soy isoflavones appear to increase IL-6, although a significant increase in CRP has not been reported (Jenkins et al, 2002a). Almonds do not appear to influence CRP concentrations (Jenkins et al, 2002c). No data have been reported on fiber or plant sterols and CRP. An exact reason why the portfolio of dietary components we used appeared to reduce CRP levels cannot at present be provided. The carbohydrate foods on the dietary portfolio tended to have low glycemic indices including oat bran (Foster-Powell et al, 2002), barley (Foster-Powell et al, 2002) and viscous fibers such as psyllium, which also reduce postprandial glycemia (Jenkins et al, 1978). It has been suggested that reduced postprandial glycemia and insulinemia in turn result in less free radical generation and oxidative stress (Ceriello & Motz, 2004) and less cytokine release from adipose tissue including interleukin-6 (IL-6) and tumor necrosis factor-α (TNF-α). The adipose tissue-derived cytokines then stimulate hepatic acute phase protein production and so lead to increased serum levels of CRP and serum amyloid A. Recent studies suggest a link between the consumption of low glycemic index diets and reduced plasma CRP correlations (Wolever et al, 2004).
In conclusion, a diet that combines a number of cholesterol-lowering foods may also lower CRP to a similar extent as a statin. If CRP reduction is shown to reduce CHD risk independently of other biochemical changes, then this action of the dietary portfolio would be a further reason why it might reduce CHD risk.
Acknowledgements
This work was supported by the Canada Research Chair Endowment of the Federal Government of Canada; the Canadian Natural Sciences and Engineering Research Council of Canada; Loblaw Brands Limited (Toronto, ON); Unilever Canada (Toronto, ON); and the Almond Board of California (Modesto, CA).
We sincerely thank President's Choice, Loblaw Brands Limited, Unilever Research & Development (Vlaardingen, the Netherlands), the Almond Board of California, The Hain-Celestial Group (Melville, NY), Kraft Foods (Glenview, IL), Procter & Gamble Inc. (Toronto, ON), Pepsico Foods Canada-Quaker Peterborough Plant (Peterborough, ON), Nestlé Canada Inc. (Pickering, ON), Bartlett Farms, Barwell Food Sales Inc. (London, ON), and Burnbrae Farms (Upton, PQ) for the generous donation of foods used in this study.
We thank Mr Edward Vidgen, Toronto, Canada for statistical support on this project; Mr Larry C Griffin, Ms Sherry Casey, and Mr. Pietro Satriano of President's Choice, Loblaw Brands Ltd; Dr Karen G Lapsley of the Almond Board of California; Dr Elke Trautwein of Unilever (Research and Development); Dr Paul Schur of Unilever Canada; Dr Gerry Amantea of The Hain-Celestial Group; Dr Margaret C Martini of Kraft Foods; Mr Grant Morrison of Pepsico Foods Canada; Ms Kathy Galbraith of Natural Temptations Bakery (Burlington, ON); Mr Don Bartlett of Bartlett Farms, Barwell Foods Sales Inc; Ms Michele Brown of Lean Cuisine Marketing Team of Nestlé Canada; Ms Margaret Hudson of Burnbrae Farms Ltd, for their assistance on this project; and to the study participants for their attention to detail and enthusiasm.
Footnotes
Guarantor: DJA Jenkins.
Contributors: Study concept and design: DJAJ, CWCK, DAF. acquisition of data: DJAJ, CWCK, AM, DAF, JMWW, R de S, AE, TLP, TJL, PWC; analysis and interpretation of data: DJAJ, CWCK, DAF, ARJ, TJL, RGJ, LAL, PWC; drafting of the manuscript: DJAJ, CWCK, AM; critical revision of the manuscript for important intellectual content: DJAJ, CWCK, AM, DAF, ARJ, JMWW, R de S, AE, TLP, TJL, RGJ, LAL, WS, PWC; statistical expertise: TJL; obtained funding: DJAJ, CWCK; administrative, technical or material support: CWCK, AM, DAF, JMWW, R de S, AE, TLP, RGJ, LAL, WS, PWC; study supervision: DJAJ, CWCK, DAF.
References
- Albert MA, Glynn RJ, Ridker PM. Alcohol consumption and plasma concentration of C-reactive protein. Circulation. 2003;107:443–447. doi: 10.1161/01.CIR.0000045669.16499.EC. [DOI] [PubMed] [Google Scholar]
- Albert MA, Glynn RJ, Ridker PM. Effect of physical activity on serum C-reactive protein. Am. J. Cardiol. 2004;93:221–225. doi: 10.1016/j.amjcard.2003.09.046. [DOI] [PubMed] [Google Scholar]
- Blok WL, Deslypere JP, Demacker PN, van der Ven-Jongekrijg J, Hectors MP, van der Meer JW, Katan MB. Pro- and anti-inflammatory cytokines in healthy volunteers fed various doses of fish oil for 1 year. Eur. J. Clin. Invest. 1997;27:1003–1008. doi: 10.1046/j.1365-2362.1997.2240775.x. [DOI] [PubMed] [Google Scholar]
- Box GEP, Cox DR. An analysis of transformation. JR. Stat. Soc. (B) 1964;26:211–252. [Google Scholar]
- Ceriello A, Motz E. Is oxidative stress the pathogenic mechanism underlying insulinresistance, diabetes and cardiovascular disease: the common soil hypothesis revisited. Arterioscler. Thromb. Vasc. Biol. 2004;24:816–823. doi: 10.1161/01.ATV.0000122852.22604.78. [DOI] [PubMed] [Google Scholar]
- Cortellaro M, Cofrancesco E, Boschetti C, Cortellaro F, Mancini M, Mariani M. Effects of fluvastatin and bezafibrate combination on plasma fibrinogen, t-plasminogen activator inhibitor and C reactive protein levels in coronary artery disease patients with mixed hyperlipidaemia (FACT study). Fluvastatin alone and in combination treatment. Thromb. Haemost. 2000;83:549–553. doi: 10.1055/s-0037-1613861. [DOI] [PubMed] [Google Scholar]
- Cushman M, Legault C, Barrett-Connor E, Stefanick ML, Kessler C, Judd HL, Sakkinen PA, Tracy RP. Effect of postmenopausal hormones on inflammation-sensitive proteins: the Postmenopausal Estrogen/Progestin Interventions (PEPI) Study. Circulation. 1999;100:717–722. doi: 10.1161/01.CIR.100.7.717. [DOI] [PubMed] [Google Scholar]
- Danesh J, Wheeler JG, Hirschfield GM, Eda S, Eiriksdottir G, Rumley A, Lowe GD, Pepys MB, Gudnason V. C-reactive protein and other circulating markers of inflammation in the prediction of coronary heart disease. N. Engl. J. Med. 2004;350:1387–1397. doi: 10.1056/NEJMoa032804. [DOI] [PubMed] [Google Scholar]
- Dangas G, Badimon JJ, Smith DA, Unger AH, Levine D, Shao JH, Meraj P, Fier C, Fallon JT, Ambrose JA. Pravastatin therapy in hyperlipidemia: effects on thrombus formation and the systemic hemostatic profile. J. Am. Coll. Cardiol. 1999;33:1294–1304. doi: 10.1016/S0735-1097(99)00018-2. [DOI] [PubMed] [Google Scholar]
- Downs JR, Clearfield M, Weis S, Whitney E, Shapiro DR, Beere PA, Langendorfer A, Stein EA, Kruyer W, Gotto AM., Jr Primary prevention of acute coronary events with lovastatin in men and women with average cholesterol levels: results of AFCAPS/TexCAPS. Air Force/Texas Coronary Atherosclerosis Prevention Study. JAMA. 1998;279:1615–1622. doi: 10.1001/jama.279.20.1615. [DOI] [PubMed] [Google Scholar]
- Expert Panel on Detection, Evaluation, and Treatment of High Blood Cholesterol in Adults (2001): Executive summary of The Third Report of The National Cholesterol Education Program (NCEP) Expert Panel on Detection, Evaluation, and Treatment of High Blood Cholesterol In Adults (Adult Treatment Panel III). JAMA285, 2486–2497. [DOI] [PubMed]
- Ford ES. Body mass index, diabetes, and C-reactive protein among US adults. Diabetes Care. 1999;22:1971–1977. doi: 10.2337/diacare.22.12.1971. [DOI] [PubMed] [Google Scholar]
- Foster-Powell K, Holt SH, Brand-Miller JC. International table of glycemic index and glycemic load values: 2002. Am. J. Clin. Nutr. 2002;76:5–56. doi: 10.1093/ajcn/76.1.5. [DOI] [PubMed] [Google Scholar]
- Frohlich M, Sund M, Lowel H, Imhof A, Hoffmeister A, Koenig W. Independent association of various smoking characteristics with markers of systemic inflammation in men. Results from a representative sample of the general population (MONICA Augsburg Survey 1994/95) Eur. Heart J. 2003;24:1365–1372. doi: 10.1016/S0195-668X(03)00260-4. [DOI] [PubMed] [Google Scholar]
- Heart Protection Study Collaborative Group (2002): MRC/BHF Heart Protection Study of cholesterol lowering with simvastatin in 20 536 high-risk individuals: a randomised placebo-controlled trial. Lancet360, 7–22. [DOI] [PMC free article] [PubMed]
- Herrington DM, Vittinghoff E, Lin F, Fong J, Harris F, Hunninghake D, Bittner V, Schrott HG, Blumenthal RS, Levy R. Statin therapy, cardiovascular events, and total mortality in the Heart and Estrogen/Progestin Replacement Study (HERS) Circulation. 2002;105:2962–2967. doi: 10.1161/01.CIR.0000019406.74017.B2. [DOI] [PubMed] [Google Scholar]
- Jenkins DJ, Kendall CW, Connelly PW, Jackson CJ, Parker T, Faulkner D, Vidgen E. Effects of high- and low-isoflavone (phytoestrogen) soy foods on inflammatory biomarkers and proinflammatory cytokines in middle-aged men and women. Metabolism. 2002;51:919–924. doi: 10.1053/meta.2002.33352. [DOI] [PubMed] [Google Scholar]
- Jenkins DJ, Kendall CW, Faulkner D, Vidgen E, Trautwein EA, Parker TL, Marchie A, Koumbridis G, Lapsley KG, Josse RG, Leiter LA, Connelly PW. A dietary portfolio approach to cholesterol reduction: combined effects of plant sterols, vegetable proteins, and viscous fibers in hypercholesterolemia. Metabolism. 2002;51:1596–1604. doi: 10.1053/meta.2002.35578. [DOI] [PubMed] [Google Scholar]
- Jenkins DJ, Kendall CW, Marchie A, Parker TL, Connelly PW, Qian W, Haight JS, Faulkner D, Vidgen E, Lapsley KG, Spiller GA. Dose response of almonds on coronary heart disease risk factors: blood lipids, oxidized low-density lipoproteins, lipoprotein(a), homocysteine, and pulmonary nitric oxide: a randomized, controlled, crossover trial. Circulation. 2002;106:1327–1332. doi: 10.1161/01.CIR.0000028421.91733.20. [DOI] [PubMed] [Google Scholar]
- Jenkins DJ, Kendall CW, Marchie A, Faulkner DA, Wong JM, de Souza R, Emam A, Parker TL, Vidgen E, Lapsley KG, Trautwein EA, Josse RG, Leiter LA, Connelly PW. Effects of a dietary portfolio of cholesterol-lowering foods vs lovastatin on serum lipids and C-reactive protein. JAMA. 2003;290:502–510. doi: 10.1001/jama.290.4.502. [DOI] [PubMed] [Google Scholar]
- Jenkins DJ, Kendall CW, Marchie A, Faulkner D, Wong J, de Sousa R, Emam A, Parker T, Vidgen E, Trautwein E, Lapsley K, Josse RG, Leither LA, Singer W, Connelly PW. Direct comparison of a dietary portfolio of cholesterol-lowering foods with a statin in hypercholesterolemic participants. Am. J. Clin. Nutr. 2005;81:380–387. doi: 10.1093/ajcn.81.2.380. [DOI] [PubMed] [Google Scholar]
- Jenkins DJ, Wolever TM, Leeds AR, Gassull MA, Haisman P, Dilawari J, Goff DV, Metz GL, Alberti KG. Dietary fibres, fibre analogues, and glucose tolerance: importance of viscosity. BMJ. 1978;27:1392–1394. doi: 10.1136/bmj.1.6124.1392. [DOI] [PMC free article] [PubMed] [Google Scholar]
- Kalela A, Laaksonen R, Lehtimaki T, Koivu TA, Hoyhtya M, Janatuinen T, Pollanen P, Vesalainen R, Saikku P, Knuuti J, Nikkari ST. Effect of pravastatin in mildly hypercholesterolemic young men on serum matrix metalloproteinases. Am. J. Cardiol. 2001;88:173–175. doi: 10.1016/S0002-9149(01)01616-2. [DOI] [PubMed] [Google Scholar]
- Ledue TB, Rifai N. Preanalytic and analytic sources of variations in C-reactive protein measurement: implications for cardiovascular disease risk assessment. Clin. Chem. 2003;49:1258–1271. doi: 10.1373/49.8.1258. [DOI] [PubMed] [Google Scholar]
- Lemieux I, Pascot A, Prud’homme D, Almeras N, Bogaty P, Nadeau A, Bergeron J, Despres JP. Elevated C-reactive protein: another component of the atherothrombotic profile of abdominal obesity. Arterioscler. Thromb. Vasc. Biol. 2001;21:961–967. doi: 10.1161/01.ATV.21.6.961. [DOI] [PubMed] [Google Scholar]
- Liu S, Manson JE, Buring JE, Stampfer MJ, Willett WC, Ridker PM. Relation between a diet with a high glycemic load and plasma concentrations of high-sensitivity C-reactive protein in middle-aged women. Am. J. Clin. Nutr. 2002;75:492–498. doi: 10.1093/ajcn/75.3.492. [DOI] [PubMed] [Google Scholar]
- Neter J, Wasserman W, Kutner MH. Applied Linear Statistical Models. 1985. [Google Scholar]
- Ockene IS, Matthews CE, Rifai N, Ridker PM, Reed G, Stanek E. Variability and classification accuracy of serial high-sensitivity C-reactive protein measurements in healthy adults. Clin. Chem. 2001;47:444–450. [PubMed] [Google Scholar]
- Pearson TA, Mensah GA, Alexander RW, Anderson JL, Cannon RO, 3rd, Criqui M, Fadl YY, Fortmann SP, Hong Y, Myers GL, Rifai N, Smith SC, Jr, Taubert K, Tracy RP, Vinicor F. Markers of inflammation and cardiovascular disease: application to clinical and public health practice: a statement for healthcare professionals from the Centers for Disease Control and Prevention and the American Heart Association. Circulation. 2003;107:499–511. doi: 10.1161/01.CIR.0000052939.59093.45. [DOI] [PubMed] [Google Scholar]
- Pischon T, Hankinson SE, Hotamisligil GS, Rifai N, Willett WC, Rimm EB. Habitual dietary intake of n-3 and n-6 fatty acids in relation to inflammatory markers among US men and women. Circulation. 2003;108:155–160. doi: 10.1161/01.CIR.0000079224.46084.C2. [DOI] [PubMed] [Google Scholar]
- Pradhan AD, Manson JE, Rossouw JE, Siscovick DS, Mouton CP, Rifai N, Wallace RB, Jackson RD, Pettinger MB, Ridker PM. Inflammatory biomarkers, hormone replacement therapy, and incident coronary heart disease: prospective analysis from the Women's Health Initiative observational study. JAMA. 2002;288:980–987. doi: 10.1001/jama.288.8.980. [DOI] [PubMed] [Google Scholar]
- Rattazzi M, Puato M, Faggin E, Bertipaglia B, Zambon A, Pauletto P. C-reactive protein and interleukin-6 in vascular disease: culprits or passive bystanders? J. Hypertens. 2003;21:1787–1803. doi: 10.1097/00004872-200310000-00002. [DOI] [PubMed] [Google Scholar]
- Ridker PM, Buring JE, Shih J, Matias M, Hennekens CH. Prospective study of C-reactive protein and the risk of future cardiovascular events among apparently healthy women. Circulation. 1998;98:731–733. doi: 10.1161/01.CIR.98.8.731. [DOI] [PubMed] [Google Scholar]
- Ridker PM, Glynn RJ, Hennekens CH. C-reactive protein adds to the predictive value of total and HDL cholesterol in determining risk of first myocardial infarction. Circulation. 1998;97:2007–2011. doi: 10.1161/01.CIR.97.20.2007. [DOI] [PubMed] [Google Scholar]
- Ridker PM, Hennekens CH, Rifai N, Buring JE, Manson JE. Hormone replacement therapy and increased plasma concentration of C-reactive protein. Circulation. 1999;100:713–716. doi: 10.1161/01.CIR.100.7.713. [DOI] [PubMed] [Google Scholar]
- Ridker PM, Rifai N, Clearfield M, Downs JR, Weis SE, Miles JS, Gotto AM., Jr Air Force/Texas Coronary Atherosclerosis Prevention Study Investigators. Measurement of C-reactive protein for the targeting of statin therapy in the primary prevention of acute coronary events. N. Engl. J. Med. 2001;344:1959–1965. doi: 10.1056/NEJM200106283442601. [DOI] [PubMed] [Google Scholar]
- Ridker PM, Rifai N, Rose L, Buring JE, Cook NR. Comparison of C-reactive protein and low-density lipoprotein cholesterol levels in the prediction of first cardiovascular events. N. Engl. J. Med. 2002;347:1557–1565. doi: 10.1056/NEJMoa021993. [DOI] [PubMed] [Google Scholar]
- Rifai N, Ridker PM. Inflammatory markers and coronary heart disease. Curr. Opin. Lipidol. 2002;13:383–389. doi: 10.1097/00041433-200208000-00005. [DOI] [PubMed] [Google Scholar]
- Rifai N, Ridker PM. Population distributions of C-reactive protein in apparently healthy men and women in the United States: implication for clinical interpretation. Clin. Chem. 2003;49:666–669. doi: 10.1373/49.4.666. [DOI] [PubMed] [Google Scholar]
- Sacks FM, Tonkin AM, Shepherd J, Braunwald E, Cobbe S, Hawkins CM, Keech A, Packard C, Simes J, Byington R, Furberg CD. Effect of pravastatin on coronary disease events in subgroups defined by coronary risk factors: the Prospective Pravastatin Pooling Project. Circulation. 2000;102:1893–1900. doi: 10.1161/01.CIR.102.16.1893. [DOI] [PubMed] [Google Scholar]
- SAS Institute (1997): SAS/STAT User's Guide (ed 6.12). Cary, NC: SAS Institute.
- Scandinavian Simvastatin Survival Study Group (1994): Randomized trial of cholesterol lowering in 4444 patients with coronary heart disease: the Scandinavian Simvastatin Survival Study (4S). Lancet344, 1383–1389. [PubMed]
- Shepherd J, Cobbe SM, Ford I, Isles CG, Lorimer AR, MacFarlane PW, McKillop JH, Packard CJ. Prevention of coronary heart disease with pravastatin in men with hypercholesterolemia. West of Scotland Coronary Prevention Study Group. N. Engl. J. Med. 1995;333:1301–1307. doi: 10.1056/NEJM199511163332001. [DOI] [PubMed] [Google Scholar]
- Tall AR. C-reactive protein reassessed. N. Engl. J. Med. 2004;350:1450–1452. doi: 10.1056/NEJMe048020. [DOI] [PubMed] [Google Scholar]
- Homocysteine Studies Collaboration Homocysteine and Risk of Ischemic Heart Disease and Stroke. JAMA. 2002;288(16):2015. doi: 10.1001/jama.288.16.2015. [DOI] [PubMed] [Google Scholar]
- Tillet WS, Francis T. Serological reaction in pneumonia with a non-protein somatic fraction of pneumococcus. J. Exp. Med. 1930;52:561–571. doi: 10.1084/jem.52.4.561. [DOI] [PMC free article] [PubMed] [Google Scholar]
- Wolever TMS, Chiasson JL, Josse RG, Leiter LA, Maheux P, Rabasa-Lhoret R, Rodger NW & Ryan EA (2004): Effect of modifying source or amount of carbohydrate glucose and lipid control in type 2 diabetes. Can. J. Diab.48 (Suppl 1) (CDA abstract).
- Yudkin JS, Stehouwer CD, Emeis JJ, Coppack SW. C-reactive protein in healthy subjects: associations with obesity, insulin resistance, and endothelial dysfunction: a potential role for cytokines originating from adipose tissue? Arterioscler. Thromb. Vasc. Biol. 1999;19:972–978. doi: 10.1161/01.ATV.19.4.972. [DOI] [PubMed] [Google Scholar]