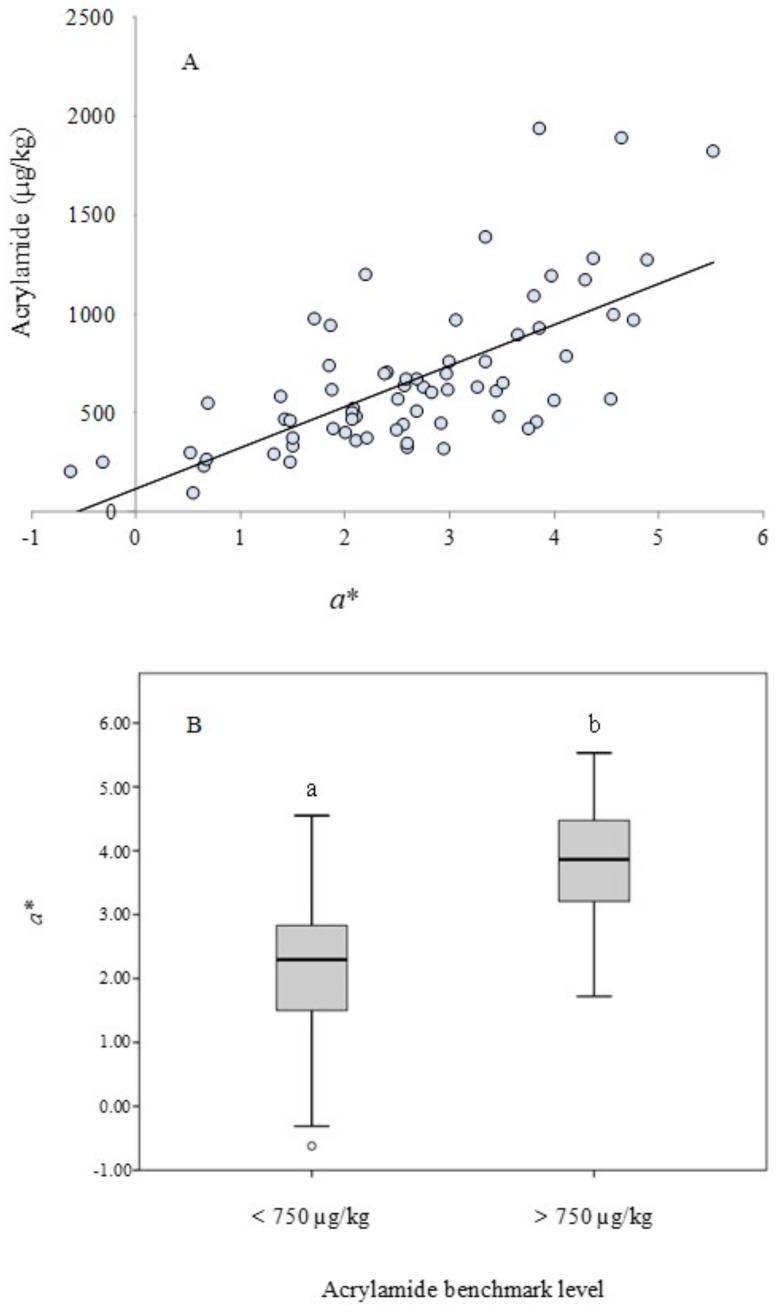
Figure 3.
Relationship between color and acrylamide content (µg/kg) in potato crisps marketed in Spain. Linear regression between acrylamide content and the color parameter a* (r2 = 0.6736, p < 0.0001) (A) and box-and-whisker plot of color parameter a* according to the acrylamide levels using the benchmark level as the threshold (750 µg/kg) (B).

