Abstract
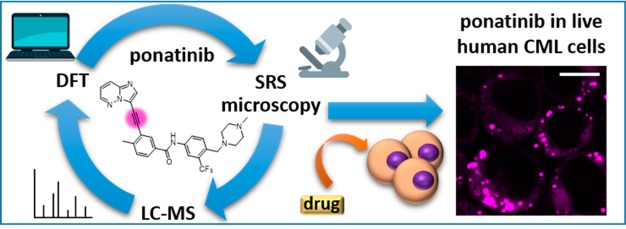
Stimulated Raman scattering (SRS) microscopy represents a powerful method for imaging label-free drug distribution with high resolution. SRS was applied to image label-free ponatinib with high sensitivity and specificity in live human chronic myeloid leukemia (CML) cell lines. This was achieved at biologically relevant, nanomolar concentrations, allowing determination of ponatinib uptake and sequestration into lysosomes during the development of acquired drug resistance and an improved understanding of target engagement.
Introduction
Despite the identification of an unprecedented number of potential new drug targets over the past two decades, and an accompanying intense investment in the generation of NCEs with improved potency and selectivity, currently only 1 in 10 clinical candidates progresses to regulatory approval.1 This major loss in investment by drug developers can be analyzed from the viewpoint of the physicochemical properties of drug candidates,2 but these studies do not provide clear indicators for how to reduce attrition rates.3 Some of the highest pipeline attrition rates are seen in the development of chemotherapeutics.4 As a plethora of new, targeted chemotherapeutics enter the clinic and, with the development of resistance to these agents, alternative approaches are urgently required to optimize their development and use. A shift toward determining critical information through the use of relevant cell-based assays at an earlier stage in the pipeline5 could result in a much cheaper and more effective development process.6
Stimulated Raman scattering (SRS) microscopy generates image contrast using the Raman active vibrational frequency of a given chemical bond, providing information on the biochemical composition of tissues and allowing label-free visualization for a number of biomedical applications including drug interactions.7,8 SRS is distinguished by a number of key features:
-
(1)
Fast acquisition speeds (orders of magnitude faster than those achieved with spontaneous Raman), good photostability, and a lack of phototoxicity, which together allow real-time imaging.
-
(2)
A linear relationship between signal intensity and chemical concentration, which enables quantitative imaging.
-
(3)
Multiple acquisition wavelengths, which allows drug distribution within cells to be mapped onto subcellular features providing intracellular registration.
-
(4)
Multimodal imaging (SRS and fluorescence), which allows image overlay with cell- or tissue-specific markers.9,10
Combined, these characteristics ensure that SRS imaging provides a unique platform to understand drug distribution within individual cells, thus distinguishing it from other technologies, such as whole-body autoradiography and liquid chromatography–mass spectrometry (LC-MS), that are typically used to monitor drug distribution.11,12
Raman imaging was initially developed as a label-free technique for visualization of biomolecules including lipids and proteins, and more recently the development of alkynes (C≡C) as nonlinear vibrational tags for imaging small biomolecules using SRS microscopy has extended the applicability of this approach.13,14 Alkynes are both chemically and Raman spectroscopically biorthogonal as they do not react with endogenous biomolecules and do not exist inside cells. The C≡C stretching motion can hence be detected in the Raman “cellular-silent” region (1800–2800 cm–1). This also presents an optimal region for drug imaging, as there is minimal contribution from endogenous cellular biomolecules, thus improving detection sensitivity.8,15 In this study, we utilize the advantages of an alkyne-based imaging approach to assess label-free drug uptake and distribution in cellular models of resistance using ponatinib (1),16 a tyrosine kinase inhibitor with regulatory approval for the treatment of chronic myeloid leukemia.
Results and Discussion
Ponatinib (1) has an inherent alkyne moiety in its structure providing the potential for imaging its cellular localization in the Raman “cellular-silent” region (Figure 1a,b), without the addition of bulky tags such as fluorophores, which can negatively impact on the biological activity of drugs. In SRS, two synchronized lasers, the pump and the Stokes beam are used to excite a specific molecular vibration (Figure 1c). To visualize a chemical bond of interest, the frequency difference between the pump beam and the Stokes beam is tuned to match the chosen vibration (ωυ), allowing stimulated Raman scattering to take place in addition to the inherently weak spontaneous Raman scattering.
Figure 1.
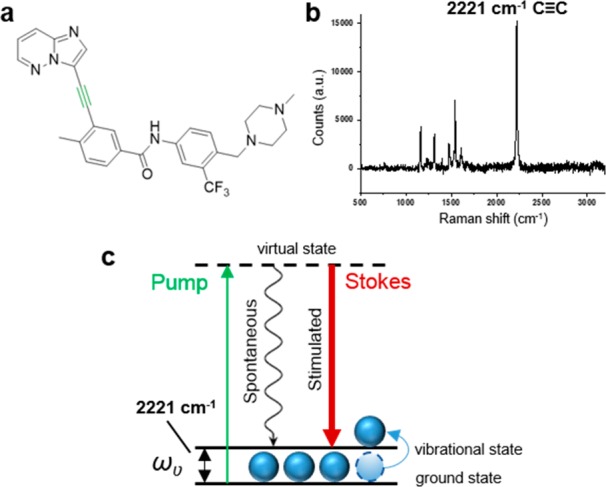
(a) Chemical structure of ponatinib; (b) Raman spectrum of solid ponatinib. The following peak has been annotated: 2221 cm–1 (C≡C, ponatinib). Raman spectra were acquired at λex = 532 nm for 10 s using a 50× objective. (c) Energy level diagram showing the working principle of SRS microscopy.
Predicting the Intensity and Frequency of Raman Signals by DFT
Density functional theory (DFT) calculations have previously been used to predict theoretical Raman intensities (IRam),8,15 while experimentally observed Raman intensities have been compared with the intensity of the alkyne resonance in the nucleoside analogue ethynyl deoxyuridine (EdU) to give relative intensity to EdU (RIE) values.17 We have combined these two approaches to give a series of calculated RIE values (cRIE) to facilitate comparison of the predicted intensity values for signals in the “cellular-silent” region. DFT calculations have also, very recently been used to predict the changes in Raman vibrational frequencies that result from primary drug metabolism.18 Thus, we have used a series of DFT calculations to establish whether the acquisition of SRS images at a single vibrational frequency for the alkyne (Figure 1b, C≡C, 2221 cm–1) would provide an accurate assessment of the ponatinib concentration within a cell (Supporting Information (SI), Table S1).
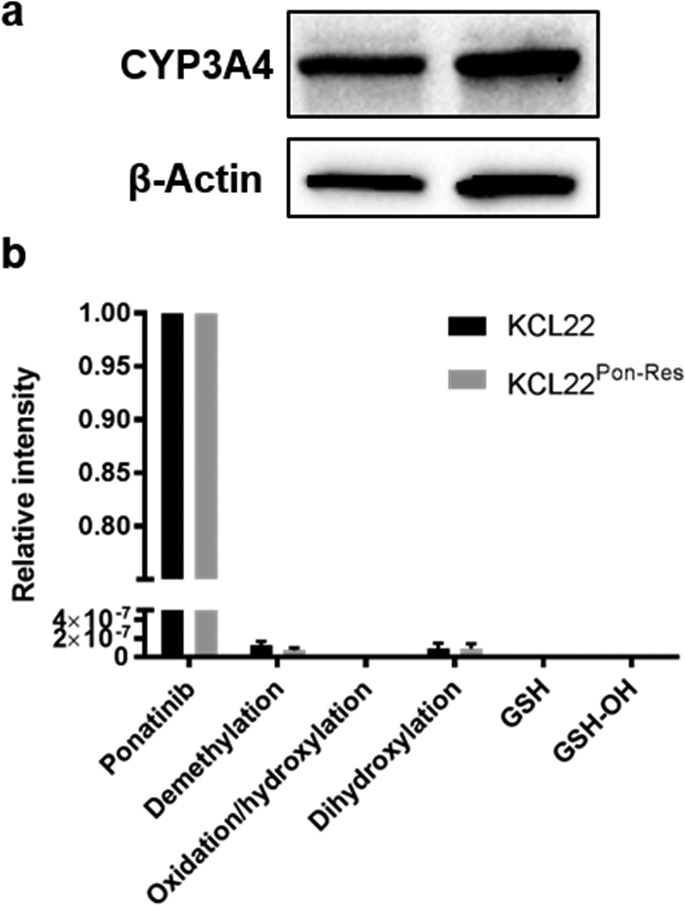
The piperidine unit in ponatinib means that it is susceptible to lysosomal trapping through protonation.19,20 However, in our DFT calculations, both the parent drug and its protonated counterpart were predicted to have very similar frequencies for the alkyne resonance, with a slight decrease in cRIE value upon protonation (SI, Table S1). Hence, it was determined that SRS imaging at a single wavenumber would allow assessment of ponatinib concentrations across the whole cell environment, independent of subcellular variations in pH. Previous studies have identified the primary metabolites of ponatinib as its N-oxide and N-desmethyl analogues, together with dihydroxylated forms.21−23 As the chemical perturbations in these two major metabolites is distal to the alkyne vibrational motif, a large change in IRam is not expected. This conclusion was confirmed by DFT calculations (SI, Table S1), which show similar cRIE values to the parent drug, with only minimal shifts in the predicted Raman frequencies for the alkyne absorption. The formation of these metabolites has been shown to be catalyzed predominantly by the P450 enzyme CYP3A4.23,24 Western blot analysis confirmed expression of CYP3A4 protein in both KCL22 and KCL22Pon-Res cells (Figure 2a). However, we identified ponatinib as the predominant peak by LC-MS analysis with only trace amounts of the N-desmethyl and dihydroxylated metabolites present in the CML cells (Figure 2b).
Figure 2.
(a) Expression of CYP3A4 in lysates from KCL22 and KCL22Pon-Res cells. β-actin was used as a loading control. (b) Ponatinib and ponatinib metabolites identified by LC-MS. Cells were treated with ponatinib for 1 h prior to analysis. Mean values from five biological repeats expressed relative to ponatinib.
Thus, given the relatively low concentrations of these metabolites in the CML cell lines, and the minimal shifts in their predicted Raman frequencies, their presence is not expected to affect SRS imaging of the intracellular distribution of ponatinib. This conclusion is in sharp contrast to recent imaging studies conducted on neratinib using Raman microscopy, where metabolism directly affects the Raman active motif in the drug and significant vibrational shifts are observed.18
Applications of SRS Imaging of Intracellular Drug Concentrations
With the validity of imaging the alkyne in ponatinib by Raman to assess its intracellular distribution established, we conducted a series of experiments to demonstrate the utility of this approach experimentally. CML results from expression of the constitutively active tyrosine kinase BCR-ABL and treatment with TKIs, such as ponatinib, which target BCR-ABL, have been successful in providing improved life expectancy, although resistance prevents long-term durable responses in many patients.25 There is currently no information on the subcellular distribution and uptake of TKIs in the context of drug resistance, and here we demonstrate the utility of SRS for label-free live cell imaging of ponatinib in a model of ponatinib resistance.
1. Direct Imaging of Ponatinib at Biologically Relevant Doses
In a recent study, spontaneous Raman imaging of the intense fingerprint peak for the TKI neratinib (1386 cm–1) allowed visualization of the drug following incubation at nanomolar concentrations; however, this process requires extended acquisition times (>30 min) using fixed cells.18 In contrast, SRS microscopy enables up to video-rate imaging speed, allowing live cell imaging. Hyperspectral SRS imaging, which enables drug signals in the fingerprint region to be extracted from the cellular signals, can also been used to follow drug uptake into cells, although as yet this requires incubation with micromolar concentrations of analyte and successful imaging is dependent on 1000-fold enrichment of drugs into lysosomes.9 The detection sensitivity is the major limitation of intracellular imaging using SRS, with the micromolar concentrations required to detect the molecule of interest often not being physiologically relevant.9,10,13,14,26 To determine whether we could use SRS to visualize ponatinib at biologically active concentrations, we chose a concentration of ponatinib (500 nM), which is close to the GI50 for human KCL22Pon-Res CML cells (SI, Table S2). The KCL22Pon-Res cells are a ponatinib-resistant cell line that was generated to understand the drivers of resistance to ponatinib, as resistance to ponatinib is a recognized clinical problem.27
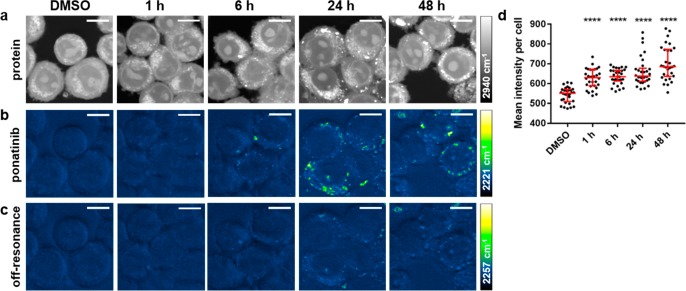
Cells were treated with ponatinib (500 nM) for up to 48 h prior to live cell imaging using a custom built SRS microscope,28 where optimal setup resulted in acquisition speeds of around 45 s per image. Images were acquired by tuning the frequency difference between the pump and Stokes lasers to be resonant with ponatinib (C≡C, 2221 cm–1, SI, Figure S1) or intracellular proteins (CH3, 2940 cm–1) to provide cellular registration (Figure 3a,b). SRS images can contain background signals from competing pump–probe processes such as cross-phase modulation, transient absorption, and photothermal effects.29 When the signal-to-noise (S/N) ratio of the SRS image of the drug is low, these background artifacts can be subtracted to remove the unwanted processes from the image. This can be achieved by changing the pump wavelength by a few nanometers, which allows off-resonance images to be acquired (at a difference of 10–30 cm–1 from the on-resonance image). This difference image can be used to distinguish true SRS signals from these artifacts (Figure 3c).30 When imaging with drug concentrations over 5 μM, the SRS S/N is sufficiently high that subtraction is not necessary to visualize ponatinib within the cell (see Figure 4a–c).
Figure 3.
(a–c) Imaging ponatinib uptake in KCL22Pon-Res cells. KCL22Pon-Res cells were treated with DMSO (0.0003%, v/v) or ponatinib (500 nM) for 1, 6, 24, or 48 h (left to right). SRS images acquired at (a) 2940 cm–1 (CH3, proteins); (b) 2221 cm–1 (C≡C, ponatinib); (c) 2257 cm–1 (off-resonance). Images acquired at 1024 × 1024 pixels, 20 μs pixel dwell time, laser power p300, gain 2 with false colors applied to different detection wavenumbers. Scale bars: 10 μm. (d) Mean ponatinib intensity per cell quantified from 2221 cm–1 in n = 30 cells, three biological repeats. The Mann–Whitney test was used to compare ponatinib Raman intensity values against the DMSO control.
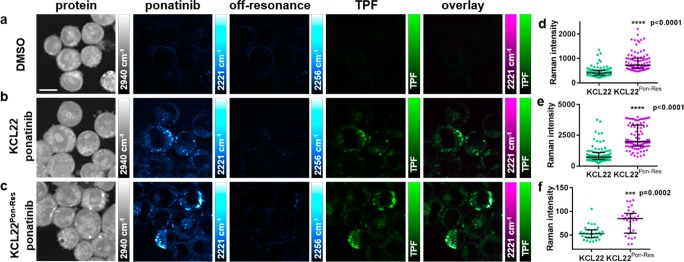
Figure 4.
Multimodal imaging and quantitative assessment of ponatinib uptake in KCL22 and KCL22Pon-Res cell lines. KCL22 cells were treated with (a) DMSO (0.0003%, v/v) or (b) ponatinib (5 μM, 1 h). KCL22 Pon-Res cells were treated with (c) ponatinib (5 μM ponatinib, 1 h). SRS images acquired at (from left to right) 2940 cm–1 (CH3, proteins), 2221 cm–1 (C≡C, ponatinib), 2257 cm–1 (off-resonance), TPF image acquired at 861 nm (Lysotracker Green), overlay of ponatinib and TPF. (d) Mean ponatinib Raman intensity. (e) Maximum ponatinib Raman intensity inside the vesicles of each individual cell quantified for KCL22 and KCL22Pon-Res cells that were treated with 5 μM ponatinib for 1 h, n = 30 cells, three biological repeats. (f) Mean ponatinib Raman intensity quantified outside of the vesicles of individual cells, n = 10, three biological repeats. Images acquired at 1024 × 1024 pixels, 20 μs pixel dwell time, laser power p200 gain 1 with false colors applied to different detection wavenumbers. Scale bars: 10 μm. The Mann–Whitney test was used to compare ponatinib Raman intensity values, ***p < 0.0001.
We analyzed the ponatinib Raman signal intensity (C≡C, 2221 cm–1) per cell in a population (n = 30) at each time point and compared it to the values of DMSO treated control cells. At each time point, there was a significant increase in Raman signal compared to the control cells, indicating intracellular accumulation of ponatinib (Figure 3d). Ponatinib puncta formed in the cells from 6 h onward, with the largest number of puncta in cells at 24 and 48 h (Figure 3d). This demonstrates that SRS can be used to image live cells treated with biologically relevant doses without the need for any additional labeling or fixation. Many TKIs, including ponatinib (Figure 1b), have strong Raman bands in the cellular fingerprint region, and if one of these bands is sufficiently strong, it can also be used for visualization, as has been demonstrated for neratinib using spontaneous Raman.18
2. Determination of the Intracellular Localization of Ponatinib
As ponatinib was concentrated in puncta in the cytoplasm of the cells, it was important to consider which cellular organelles these were, as the known target of ponatinib is the cytoplasmic tyrosine kinase BCR-ABL. Knowing that ponatinib is a weakly basic drug with a pKa value greater than eight (pKa1 = 11.4, pKa2 = 8.0)31 and hence is likely to be protonated in acidic environments, we predicted that it would accumulate in lysosomes or related acidic organelles in the cell. A multimodal imaging approach was used to explore this. Cells were simultaneously incubated with ponatinib (5 μM, 1 h) or DMSO (vehicle control, 1 h) and Lysotracker Green (50 nM, 1 h), a cell-permeable fluorescent dye that stains acidic organelles in live cells (Figure 4). Cells treated with DMSO and stained with Lysotracker Green (Figure 4a) showed no SRS signal at 2221 cm–1 (C≡C, ponatinib on-resonance), indicating that the presence of the fluorophore does not give a background SRS signal. In cells treated with ponatinib (Figure 4b,c), we could see colocalization between the SRS signal at 2221 cm–1 and the two-photon fluorescence (TPF) signal shown in the merged images, with evidence of lower levels of ponatinib in the cytoplasm, which did not colocalize with the TPF signal. This demonstrates that the majority of ponatinib is trapped within acidic organelles, most likely lysosomes, upon protonation.
There is evidence that lysosomal trapping plays a role in resistance to TKIs by sequestering them away from their intracellular targets and thereby reducing target engagement.32 Using the TPF signal as a map, the ponatinib Raman intensity was quantified in individual cells which showed an increased ponatinib Raman signal in the resistant KCL22Pon-Res cells compared to parental KCL22 cells (Figure 4d,e). The mean intensity of ponatinib was increased 1.9-fold in the KCL22Pon-Res cells compared to parental KCL22 cells (Figure 4d), and the maximum ponatinib signal had increased 2.5-fold (Figure 4e). There was also a significant increase in the ponatinib signal within the cytoplasm of the resistant cells (Figure 4f).
To determine whether differences in lysosomal pH in the cell lines could be contributing to the increased accumulation of ponatinib in the KCL22Pon-Res cells we used Lysosensor Green, a dye whose fluorescence increases in acidic environments. There was no significant difference in Lysosensor Green signal between the KCL22 and KCL22Pon-Res cells (SI, Figure S2a,b). However, we did see an increase in expression of the lysosomal marker LAMP1 in the KCL22Pon-Res cells (SI, Figure S2c,d), indicative of increased lysosome number or lysosome size. To establish whether lysosome biogenesis was differentially regulated in the resistant cells at a transcriptional level, we looked at nuclear transcription factor EB (TFEB), which is a master regulator of lysosome biogenesis.33 There was a significant increase in nuclear TFEB in the KCL22Pon-Res cells (SI, Figure S2e,f), indicative of increased lysosome biogenesis in the resistant cells. This may reflect adaptation of the resistant cells to allow them to respond to lysosomal stress.
3. Using SRS Imaging to Enhance Target Engagement Studies
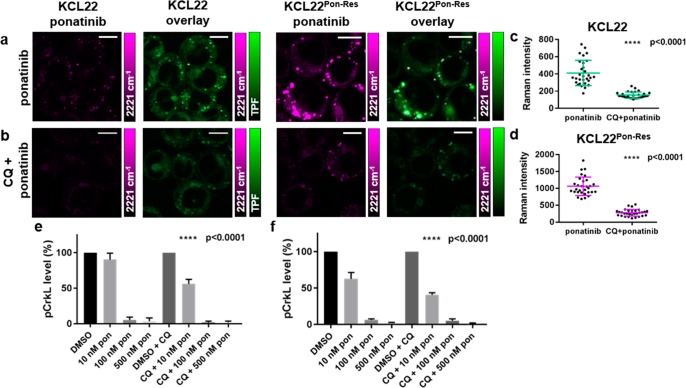
To investigate the importance of lysosomal trapping on ponatinib–target engagement, we used chloroquine (CQ), which is a nonspecific autophagy inhibitor that acts as a lysosomotropic agent, increasing lysosomal pH and ultimately preventing fusion of autophagosomes and lysosomes. It was hypothesized that chloroquine treatment could be used to prevent the increased lysosomal uptake of ponatinib. Pretreatment of KCL22 and KCL22Pon-Res cells with CQ (20 μM, 2 h) prior to treatment with ponatinib (5 μM, 1 h) significantly reduced the ponatinib Raman signal in both cell lines (Figure 5b–e)
Figure 5.
Multimodal imaging and quantitative assessment of the effect of chloroquine treatment on the vesicular uptake of ponatinib. KCL22 and KCL22Pon-Res cells were treated with (a) ponatinib (5 μM, 1 h), (b) chloroquine (20 μM, 2 h) followed by combination treatment of ponatinib (5 μM, 1 h) and chloroquine (20 μM, 1 h). Images shown (left to right) 2221 cm–1 (C≡C, ponatinib), overlay TPF image at 861 nm (Lysotracker Green) merged with 2221 cm–1. (c,d) Mean ponatinib Raman intensity inside the vesicles of each individual cell quantified in (c) KCL22 and (d) KCL22Pon-Res cell line, n = 10 cells, three biological repeats. Images acquired at 1024 × 1024 pixels, 20 μs pixel dwell time with false colors applied to different detection wavenumbers. Scale bars: 10 μm. (e,f) p-CRKL level quantification from Western blots where KCL22 and KCL22Pon-Res cells were treated with (left to right) either DMSO (0.0003%, v/v), ponatinib (10, 100, 500 nM, 1 h), or a combination of chloroquine (20 μM, 2 h) pretreatment and ponatinib (10, 100, or 500 nM, 1 h). p-CRKL level was quantified against α-tubulin control and normalized to DMSO using Image Lab Software. One-Way ANOVA (Tukey’s multiple comparisons test) was used to compare ponatinib (10 nM) alone vs CQ combination treatment.
Quantification of ponatinib signal inside lysosomes demonstrated that CQ treatment reduced mean ponatinib concentration in the lysosomes 2.7- and 3.8-fold in the KCL22 and KCL22Pon-Res cells, respectively, compared to ponatinib alone (Figure 5c,d). To determine whether the inhibition of autophagy by CQ also contributed to the reduced lysosomal accumulation of ponatinib, we used KCL22Pon-Res CRISPR-ATG7 knockout cells. ATG7 is a critical autophagy regulator and KCL22Pon-Res CRISPR-ATG7 cells have a defect in the autophagy pathway. KCL22Pon-Res CRISPR-ATG7 and KCL22Pon-Res CRISPR-Control cells were simultaneously treated with ponatinib (5 μM, 1 h) and labeled with Lysotracker (50 nM, 1 h) before live imaging using SRS (SI, Figure S3). Quantification of relative concentrations of ponatinib by Raman intensity in individual cells of both cell lines demonstrated no significant difference between the cell lines, demonstrating that autophagy does not play a role in ponatinib accumulation in lysosomes. Therefore, reduction of ponatinib concentration in lysosomes upon CQ combination treatment was likely due to the lysosomotropic properties of CQ, which decreased the ability of ponatinib to accumulate in the lysosomes.
Having found that CQ treatment significantly decreased lysosomal trapping of ponatinib in both cell lines, we looked at how this affected BCR-ABL inhibition. BCR-ABL is a cytosolic tyrosine kinase and phosphorylation of CRKL (Tyr207), a direct BCR-ABL substrate, was used as a surrogate for BCR-ABL activity. Pretreatment with CQ significantly increased p-CRKL inhibition at the lowest 10 nM ponatinib dose (Figure 5e,f, and SI, Figure S4). Thus, the reduced lysosome trapping of ponatinib in the CQ treated cells increased BCR-ABL inhibition. Interestingly, we saw a greater inhibition of pCRKL phosphorylation in the KCL22Pon-Res cells than in KCL22 ponatinib sensitive cells which correlates with the increased cytoplasmic levels of ponatinib in the resistant cells (Figure 4f) and supports a BCR-ABL independent mechanism of ponatinib resistance.26 This is in contrast to the BCR-ABL dependent resistance to other basic TKIs such as imatinib that are used in the treatment of CML, where CQ can increase target engagement with combined CQ and TKI treatments resulting in enhanced efficacy.9,34
Conclusions
This study demonstrates the benefits of SRS microscopy in providing real-time measurements of drug distribution in live cells with high sensitivity and resolution. Use of SRS microscopy has allowed label-free imaging of the TKI ponatinib at biologically relevant concentrations and provided insight into changes in uptake and sequestration of drug that has occurred during the development of acquired drug resistance. We show that tuning the pump wavelength to the alkyne stretch within ponatinib allows SRS imaging within the Raman cellular-silent region following treatment with nanomolar concentrations of ponatinib. Although imaging within the cell silent region increases sensitivity, the recent demonstration that Raman imaging of drugs may also be achieved in the fingerprint region when the drug is enriched in subcellular locales, opens up the possibility of label-free imaging for a wider number of drug candidates and metabolites.9,16 Furthermore, the addition of small alkyne tags or deuterium substitutions to enable SRS imaging of drugs and small molecules in the cellular-silent region with increased sensitivity, further extends the potential for this technology to provide read-outs of drug kinetics and mechanism of action.10,17,35,36 Combined with DFT calculations and LC-MS measurements, SRS imaging could be transformative to the drug discovery pipeline by providing important information on drug localization, mechanism of action, and target engagement.
Acknowledgments
We thank EPSRC and MRC (OPTIMA CDT Studentship to K.S., EP/L016559/1), Cancer Research UK (grant ref: C157/A25140 and C157/A15703), and Prof. Colin Campbell for use of the spontaneous Raman microscope [UK Regenerative Medicine Platform Niche Hub, MRC grant ref MR/K026666/1].
Glossary
Abbreviations Used
- CML
chronic myeloid leukemia
- CQ
chloroquine
- DFT
density functional theory
- EdU
ethynyl deoxyuridine
- FACS
fluorescence assisted cell sorting
- GI50
growth inhibition by 50%
- IRam
theoretical Raman intensity
- LC-MS
liquid chromatography–mass spectrometry
- NCE
new chemical entity
- RIE
relative intensity to EdU
- SRS
stimulated Raman scattering
- TFEB
transcription factor EB
- TKI
tyrosine kinase inhibitor
- TPF
two-photon fluorescence
Supporting Information Available
The Supporting Information is available free of charge at https://pubs.acs.org/doi/10.1021/acs.jmedchem.9b01546.
Materials and methods; DFT calculated wavenumbers and intensities (IRam); SRS ponatinib peak in cells; GI50 values; Lysosensor FACS; LAMP1 and TFEB immunofluorescence; SRS data for KCL22Pon-Res CRISPR-Ctrl and KCL22Pon-Res CRISPR-ATG7 cell lines; p-CRKL Western blots (PDF)
Author Contributions
The manuscript was written through contributions of all authors.
The authors declare no competing financial interest.
Supplementary Material
References
- Hay M.; Thomas D. W.; Craighead J. L.; Economides C.; Rosenthal J. Clinical development success rates for investigational drugs. Nat. Biotechnol. 2014, 32, 40–51. 10.1038/nbt.2786. [DOI] [PubMed] [Google Scholar]
- Shultz M. D. Two decades under the influence of the rule of five and the changing properties of approved oral drugs. J. Med. Chem. 2019, 62, 1701–1714. 10.1021/acs.jmedchem.8b00686. [DOI] [PubMed] [Google Scholar]
- Waring M. J.; Arrowsmith J.; Leach A. R.; Leeson P. D.; Mandrell S.; Owen R. M.; Pairaudeau G.; Pennie W. D.; Pickett S. D.; Wang J.; Wallace O.; Weir A. An analysis of the attrition of drug candidates from four major pharmaceutical companies. Nat. Rev. Drug Discovery 2015, 14, 475–486. 10.1038/nrd4609. [DOI] [PubMed] [Google Scholar]
- Goodwin R.; Giaccone G.; Calvert H.; Lobbezoo M.; Eisenhauer E. A. Targeted agents: how to select the winners in preclinical and early clinical studies?. Eur. J. Cancer 2012, 48, 170–178. 10.1016/j.ejca.2011.09.024. [DOI] [PubMed] [Google Scholar]
- Horvath P.; Aulner N.; Bickle M.; Davies A. M.; Nery E. D.; Ebner D.; Montoya M. C.; Ostling P.; Pietiainen V.; Price L. S.; Shorte S. L.; Turcatti G.; von Schantz C.; Carragher N. O. Screening out irrelevant cell-based models of disease. Nat. Rev. Drug Discovery 2016, 15, 751–769. 10.1038/nrd.2016.175. [DOI] [PubMed] [Google Scholar]
- Paul S. M.; Mytelka D. S.; Dunwiddie C. T.; Persinger C. C.; Munos B. H.; Lindborg S. R.; Schacht A. L. How to improve R&D productivity: the pharmaceutical industry’s grand challenge. Nat. Rev. Drug Discovery 2010, 9, 203–214. 10.1038/nrd3078. [DOI] [PubMed] [Google Scholar]
- Cheng J. X.; Xie X. S. Vibrational spectroscopic imaging of living systems: An emerging platform for biology and medicine. Science 2015, 350, aaa8870 10.1126/science.aaa8870. [DOI] [PubMed] [Google Scholar]
- Tipping W. J.; Lee M.; Serrels A.; Brunton V. G.; Hulme A. N. Stimulated Raman scattering microscopy: an emerging tool for drug discovery. Chem. Soc. Rev. 2016, 45, 2075–2089. 10.1039/C5CS00693G. [DOI] [PMC free article] [PubMed] [Google Scholar]
- Fu D.; Zhou J.; Zhu W. S.; Manley P. W.; Wang Y. K.; Hood T.; Wylie A.; Xie X. S. Imaging the intracellular distribution of tyrosine kinase inhibitors in living cells with quantitative hyperspectral stimulated Raman scattering. Nat. Chem. 2014, 6, 614–622. 10.1038/nchem.1961. [DOI] [PMC free article] [PubMed] [Google Scholar]
- Tipping W. J.; Lee M.; Serrels A.; Brunton V. G.; Hulme A. N. Imaging drug uptake by bioorthogonalstimulated Raman scattering microscopy. Chem. Sci. 2017, 8, 5606–5615. 10.1039/C7SC01837A. [DOI] [PMC free article] [PubMed] [Google Scholar]
- Cobice D. F.; Goodwin R. J.; Andren P. E.; Nilsson A.; Mackay C. L.; Andrew R. Future technology insight: mass spectrometry imaging as a tool in drug research and development. Br. J. Pharmacol. 2015, 172, 3266–3283. 10.1111/bph.13135. [DOI] [PMC free article] [PubMed] [Google Scholar]
- McEwen A.; Henson C. Quantitative whole-body autoradiography: past, present and future. Bioanalysis 2015, 7, 557–568. 10.4155/bio.15.9. [DOI] [PubMed] [Google Scholar]
- Hong S.; Chen T.; Zhu Y.; Li A.; Huang Y.; Chen X. Live-cell stimulated Raman scattering imaging of alkyne-tagged biomolecules. Angew. Chem., Int. Ed. 2014, 53, 5827–5831. 10.1002/anie.201400328. [DOI] [PubMed] [Google Scholar]
- Wei L.; Hu F.; Shen Y.; Chen Z.; Yu Y.; Lin C.-C.; Wang M. C.; Min W. Live-cell imaging of alkyne-tagged small biomolecules by stimulated Raman scattering. Nat. Methods 2014, 11, 410–412. 10.1038/nmeth.2878. [DOI] [PMC free article] [PubMed] [Google Scholar]
- Zhao Z.; Shen Y.; Hu F.; Min W. Applications of vibrational tags in biological imaging by Raman microscopy. Analyst 2017, 142, 4018–4029. 10.1039/C7AN01001J. [DOI] [PMC free article] [PubMed] [Google Scholar]
- Pavlovsky C.; Chan O.; Talati C.; Pinilla-Ibarz J. Ponatinib in the treatment of chronic myeloid leukemia and philadelphia chromosome positive acute lymphoblastic leukemia. Future Oncol. 2019, 15, 257–269. 10.2217/fon-2018-0371. [DOI] [PubMed] [Google Scholar]
- Yamakoshi H.; Dodo K.; Palonpon A.; Ando J.; Fujita K.; Kawata S.; Sodeoka M. Alkyne-tag Raman imaging for visualization of mobile small molecules in live cells. J. Am. Chem. Soc. 2012, 134, 20681–20689. 10.1021/ja308529n. [DOI] [PubMed] [Google Scholar]
- Aljakouch K.; Lechtonen T.; Yosef H. K.; Hammoud M. K.; Alsaidi W.; Kotting C.; Mugge C.; Kourist R.; El-Mashtoly S. F.; Gerwert K. Raman microspectroscopicevidence for the metabolism of a tyrosine kinase inhibitor, neratinib, in cancer cells. Angew. Chem., Int. Ed. 2018, 57, 7250–7254. 10.1002/anie.201803394. [DOI] [PMC free article] [PubMed] [Google Scholar]
- Klein T.; Vajpai N.; Phillips J. J.; Davies G.; Holdgate G. A.; Phillips C.; Tucker J. A.; Norman R. A.; Scott A. D.; Higazi D. R.; Lowe D.; Thompson G. S.; Breeze A. L. Structural and dynamic insights into the energetics of activation loop rearrangement in FGFR1 kinase. Nat. Commun. 2015, 6, 7877. 10.1038/ncomms8877. [DOI] [PMC free article] [PubMed] [Google Scholar]
- Ye Y. E.; Woodward C. N.; Narasimhan N. I. Absorption, metabolism, and excretion of [14C]ponatinib after a single oral dose in humans. Cancer Chemother. Pharmacol. 2017, 79, 507–518. 10.1007/s00280-017-3240-x. [DOI] [PMC free article] [PubMed] [Google Scholar]
- Attwa M. W.; Kadi A. A.; Darwish H. W.; Amer S. M.; AlRabiah H. LC-ESI-MS/MS identification and characterization of ponatinib in vivo phase I and phase II metabolites. Clin. Chim. Acta 2018, 485, 144–151. 10.1016/j.cca.2018.06.035. [DOI] [PubMed] [Google Scholar]
- Kadi A. A.; Darwish H. W.; Attwa M. W.; Amer S. M. Detection and characterization of ponatinib reactive metabolites by liquid chromatography tandem mass spectrometry and elucidation of bioactivation pathways. RSC Adv. 2016, 6, 72575–72585. 10.1039/C6RA09985H. [DOI] [Google Scholar]
- Lin; Kostov R.; Huang J. T.; Henderson C. J.; Wolf C. R. Novel pathways of ponatinib disposition catalyzed by CYP1A1 involving generation of potentially toxic metabolites. J. Pharmacol. Exp. Ther. 2017, 363, 12–19. 10.1124/jpet.117.243246. [DOI] [PMC free article] [PubMed] [Google Scholar]
- Narasimhan N. I.; Dorer D. J.; Niland K.; Haluska F.; Sonnichsen D. Effects of Ketoconazole on the Pharmacokinetics of Ponatinib in Healthy Subjects. J. Clin. Pharmacol. 2013, 53, 974–981. 10.1002/jcph.109. [DOI] [PMC free article] [PubMed] [Google Scholar]
- Cortes J. E.; Kim D. W.; Pinilla-Ibarz J.; le Coutre P.; Paquette R.; Chuah C.; Nicolini F. E.; Apperley J. F.; Khoury H. J.; Talpaz M.; DiPersio J.; DeAngelo D. J.; Abruzzese E.; Rea D.; Baccarani M.; Müller M. C.; Gambacorti-Passerini C.; Wong S.; Lustgarten S.; Rivera V. M.; Clackson T.; Turner C. D.; Haluska F. G.; Guilhot F.; Deininger M. W.; Hochhaus A.; Hughes T.; Goldman J. M.; Shah N. P.; Kantarjian H. A phase 2 trial of ponatinib in Philadelphia chromosome-positive leukemias. N. Engl. J. Med. 2013, 369, 1783–1796. 10.1056/NEJMoa1306494. [DOI] [PMC free article] [PubMed] [Google Scholar]
- Lee H. J.; Zhang W.; Zhang D.; Yang Y.; Liu B.; Barker E. L.; Buhman K. K.; Slipchenko L. V.; Dai M.; Cheng J. X. Assessing cholesterol storage in live cells and C. elegans by stimulated Raman scattering imaging of phenyl-Diyne cholesterol. Sci. Rep. 2015, 5, 7930. 10.1038/srep07930. [DOI] [PMC free article] [PubMed] [Google Scholar]
- Mitchell R.; Hopcroft L. E. M.; Baquero P.; Allan E. K.; Hewit K.; James D.; Hamilton G.; Mukhopadhyay A.; O’Prey J.; Hair A.; Melo J. V.; Chan E.; Ryan K. M.; Maguer-Satta V.; Druker B. J.; Clark R. E.; Mitra S.; Herzyk P.; Nicolini F. E.; Salomoni P.; Shanks E.; Calabretta B.; Holyoake T. L.; Helgason G. V. Targeting BCR-ABL-independent TKI resistance in chronic myeloid leukemia by mTOR and autophagy inhibition. J. Natl. Cancer Inst. 2018, 110, 467–478. 10.1093/jnci/djx236. [DOI] [PMC free article] [PubMed] [Google Scholar]
- Lee M.; Downes A.; Chau Y.-Y.; Serrels B.; Hastie N.; Elfick A.; Brunton V. G.; Frame M. C.; Serrels A. In vivo imaging of the tumor and its associated microenvironment using combined CARS/2-photon microscopy. IntraVital 2015, 4, e1055430 10.1080/21659087.2015.1055430. [DOI] [PMC free article] [PubMed] [Google Scholar]
- Berto P.; Andresen E. R.; Rigneault H. Background-free stimulated Raman spectroscopy and microscopy. Phys. Rev. Lett. 2014, 112, 053905. 10.1103/PhysRevLett.112.053905. [DOI] [PubMed] [Google Scholar]
- Zhang D.; Slipchenko M. N.; Leaird D. E.; Weiner A. M.; Cheng J.-X. Spectrally modulated stimulated Raman scattering imaging with an angle-to-wavelength pulse shaper. Opt. Express 2013, 21, 13864–13874. 10.1364/OE.21.013864. [DOI] [PMC free article] [PubMed] [Google Scholar]
- Iclusig (Ponatinib) Tablets for Oral Use. U.S. Food and Drug Administration Medication Guide; U.S. Food and Drug Administration, 2016; https://www.accessdata.fda.gov/drugsatfda_docs/label/2016/203469s022lbl.pdf (accessed Sept 6th, 2019).
- Zhitomirsky B.; Assaraf Y. G. Lysosomes as mediators of drug resistance in cancer. Drug Resist. Updates 2016, 24, 23–33. 10.1016/j.drup.2015.11.004. [DOI] [PubMed] [Google Scholar]
- Sardiello M. Transcription factor EB: from master coordinator of lysosomal pathways to candidate therapeutic target in degenerative storage diseases. Ann. N. Y. Acad. Sci. 2016, 1371, 3–14. 10.1111/nyas.13131. [DOI] [PMC free article] [PubMed] [Google Scholar]
- Bellodi C.; Lidonnici M. R.; Hamilton A.; Helgason G. V.; Soliera A. R.; Ronchetti M.; Galavotti S.; Young K. W.; Selmi T.; Yacobi R.; Van Etten R.; Donato N.; Hunter A.; Dinsdale D.; Tirro E.; Vigneri P.; Nicotera P.; Dyer M. J.; Holyoake T.; Salomoni P.; Calabretta B. Targeting autophagy potentiates tyrosine kinase inhibitor-induced cell death in Philadelphia chromosome-positive cells, including primary CML stem cells. J. Clin. Invest. 2009, 119, 1109–1123. 10.1172/JCI35660. [DOI] [PMC free article] [PubMed] [Google Scholar]
- Chiu W. S.; Belsey N. A.; Garrett N. L.; Moger J.; Delgado-Charro M. B.; Guy R. H. Molecular diffusion in the human nail measured by stimulated Raman scattering microscopy. Proc. Natl. Acad. Sci. U. S. A. 2015, 112, 7725–7730. 10.1073/pnas.1503791112. [DOI] [PMC free article] [PubMed] [Google Scholar]
- Gaschler M. M.; Hu F.; Feng H.; Linkermann A.; Min W.; Stockwell B. R. Determination of the subcellular localization and mechanism of action of ferrostatins in suppressing ferroptosis. ACS Chem. Biol. 2018, 13, 1013–1020. 10.1021/acschembio.8b00199. [DOI] [PMC free article] [PubMed] [Google Scholar]
Associated Data
This section collects any data citations, data availability statements, or supplementary materials included in this article.


