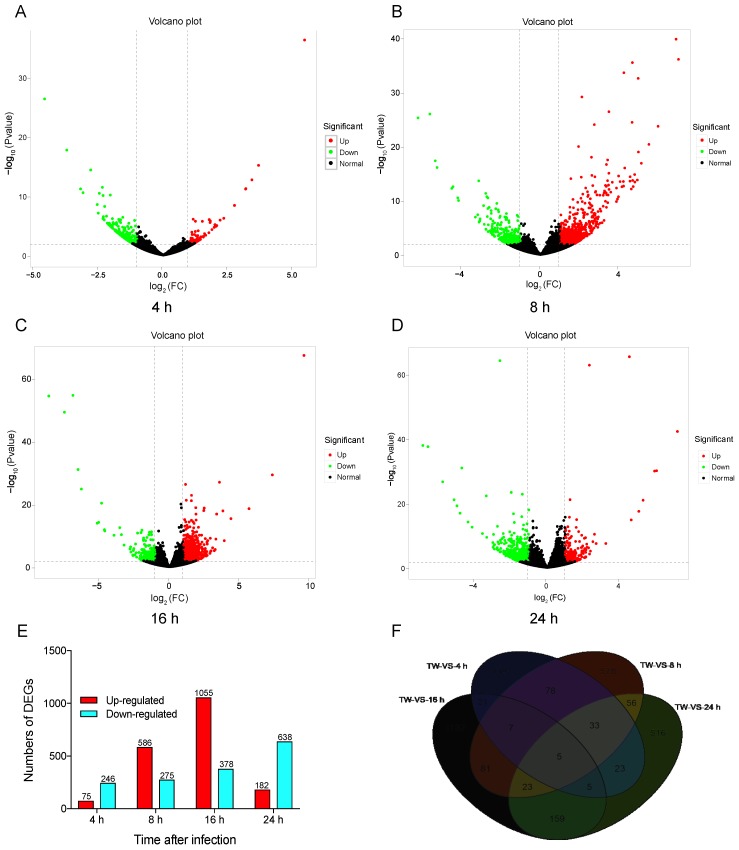
Figure 1.
Volcano plot and number of differentially expressed genes (DEGs) after challenge with M. anisopliae at different periods. A: Volcano plot of DEGs at 4 h; B: Volcano plot of DEGs at 8 h; C: Volcano plot of DEGs at 16 h; D: Volcano plot of DEGs at 24 h; E: Numbers of DEGs at different period; F: Venn diagram of DEGs at 4 h, 8 h, 16 h, and 24 h post-infection.

