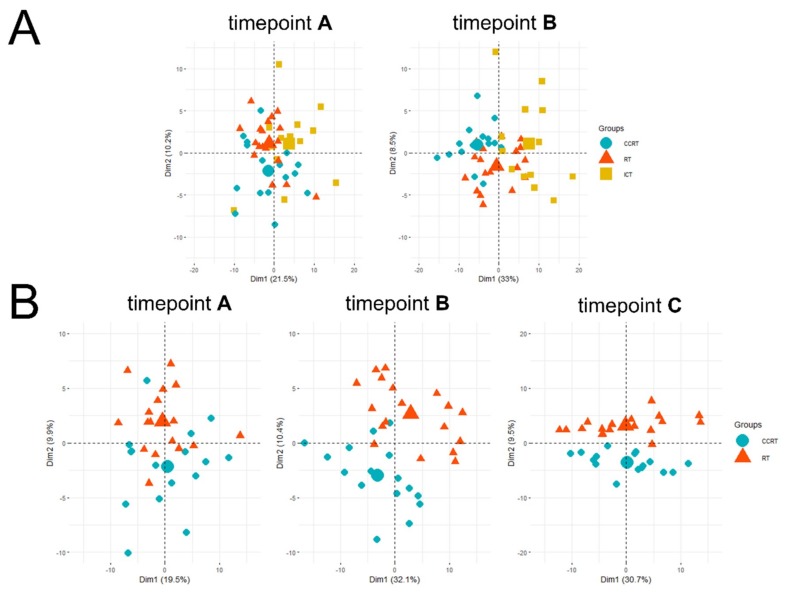
Figure 2.
Principal component analysis (PCA) of the sample similarity. Panel (A) shows samples A and samples B collected in all three treatment modalities. Panel (B) shows three subsequent time points A, B, and C that correspond to samples collected before, during, and after the end of CCRT and RT treatments, respectively. Small marks denote individual patients, while bigger marks are the mean points of each treatment group. CCRT is labeled by blue dots, RT—orange triangles, and ICT—yellow squares.

