

Abstract
Research has identified heterogeneous subgroups of individuals based on posttraumatic stress disorder (PTSD) and depression symptoms. Using data collected from veterans in India (N = 146) and U.S. (N = 194), we examined (1) best-fitting latent class solution; (2) multi-group invariance of the class solution; and (3) construct validity of optimal class solution. Results indicated that the optimal 4-class solution differed in severity and severity/type in the India and U.S. samples respectively. With similarity in the optimal number of classes across cultural samples, the meaning/nature of classes differed. In the India sample, anxiety severity predicted the Low Severity Class vs. all other classes, and the Moderately High Severity/High Severity Classes vs. the Moderately Low Severity Class; number of traumas predicted the High Severity vs. other classes; and resilience predicted the Moderately Low Severity vs. Moderately High Severity Classes. In the U.S. sample, alcohol use predicted the High Severity Class vs. all other classes, and the High Depression-Low PTSD Class vs. the Low Severity Class; rumination significantly predicted the High Severity and High Depression-Low PTSD Classes vs. each of the High PTSD-Low Depression and Low Severity Classes. Thus, meaning and nature of PTSD-depression subgroups may vary culturally; hence, culturally-sensitive interventions need to account for this heterogeneity.
Keywords: Posttraumatic stress disorder, depression, latent profile analyses, invariance, cross-cultural comparison
Introduction
The co-occurrence of posttraumatic stress disorder (PTSD) and depression symptoms (Bonde et al., 2016) is associated with functional impairment (Post, Zoellner, Youngstrom, & Feeny, 2012). Referencing comorbidity explanations, the “causality” viewpoint indicates that trauma/PTSD and depression are causal risk factors for each other; the “common factors” viewpoint highlights shared environmental and genetic risk factors for these disorders; and the “confounding factors” viewpoint suggests a coincidence in the PTSD-depression associations (Breslau, 2009; Flory & Yehuda, 2015; Strander, Thomsen, & Highfill-McRoy, 2014). Statistically, person-centered approaches accounting for population heterogeneity (Morin, Meyer, Creusier, & Biétry, 2016) are vital to examine the nature of and reasons for the PTSD-depression co-occurrence.
To elaborate, latent class analyses (LCA) and latent profile analyses (LPA), as examples of such person-centered statistical approaches, use categorical and continuous symptom indicators respectively in classifying meaningful subgroups of individuals (i.e., latent classes/typologies). The said subgroups are mutually exclusive and are not observed but rather latent. These approaches consider both the severity and type of endorsed symptoms in delineating and identifying subgroups of individuals; thereby, individuals in each subgroup share similar patterns of symptom endorsement (severity and type). In other words, the response to any particular item by a certain participant is conditionally dependent on the latent subgroup they belong to. Subsequently, these obtained meaningful subgroups of individuals can be compared qualitatively (e.g., symptom type) and quantitatively (e.g., symptom severity). Highlighting the significance of person-centered statistical approaches, research has shown that identified subgroups may moderate treatment effects (Zhang, Abarda, Contractor, Wang, & Dayton, 2018) and may differentially relate to mental health correlates (i.e., construct validity Dalenberg, Glaser, & Alhassoon, 2012). Relevant to the current study, subgroups of individuals with differing severity and/or types of PTSD and depression symptoms may have a different psychopathology profile and may require different and personalized treatment approaches; the nature of these subgroups may provide explanations about mechanisms underlying their co-occurrence patterns.
Most person-centered research indicates parallel severity across PTSD and depression symptoms represented as a 3- (Armour et al., 2015; Contractor et al., 2015) or a 4-class solution (Hruska, Irish, Pacella, Sledjeski, & Delahanty, 2014; Lai, Kelley, Harrison, Thompson, & Self-Brown, 2015). Such findings support that PTSD and depression symptoms may comprise of a common post-traumatic response (Ikin, Creamer, Sim, & McKenzie, 2010; Norman et al., 2011), perhaps sharing common distress (Kramer et al., 2016). Fewer studies have found classes differing in type, providing less support for a depressive-subtype of PTSD (Cao et al., 2016; Contractor, Roley-Roberts, Lagdon, & Armour, 2017; Flory & Yehuda, 2015), wherein individuals with comorbid PTSD and depression may differ from those with only PTSD or depression on biological and psychological indicators (Flory & Yehuda, 2015).
Beyond the mixed findings regarding the number/nature of PTSD-depression subgroups, such research is limited in Eastern cultures such as that of India. Importantly though, traumatic events are highly prevalent in India (Patel, 2000; Pathak, 2007), and are associated with significant post-trauma outcomes (Contractor et al., 2014; Kar, Jagadisha., Sharma, Murali, & Mehrotra, 2004; Venkateshan & Roy, 2016). Distinct characteristics of the Indian culture may influence the nature and/or severity of PTSD and depression symptoms. India, a predominantly collectivistic society (Hofstede, 2001; Triandis, 1993), focuses on interdependence and community needs/goals (Markus & Kitayama, 1991). These cultural values may enhance resiliency and coping (Bhushan & Kumar, 2007; Tummala-Narra, 2007), thereby, lowering symptom severity. Conversely, the Indian culture inculcates an external locus of control potentially promoting more passive coping and poorer mental health (Suar, Das, & Hota, 2010). Further, individuals in the Indian culture may express post-trauma distress via somatic symptoms (Marsella, Friedman, & Spain, 1996; Pole, Gone, & Kulkarni, 2008); individuals may tend to internalize emotional distress (Varma, Chandra, Thomas, & Carey, 2007), not express emotions, and not disclose mental health issues due to anticipated stigma (Pole et al., 2008).
Thus, the nature of PTSD-depression subgroups in the Indian culture may be different from those in Western samples. Cross-cultural studies need to empirically compare (vs. assume) if the number/nature of subgroups, means of symptom indicators within subgroups, variability of symptom indicators within subgroups, and relative sizes of subgroups are similar vs. different (Eid, Langeheine, & Diener, 2003; Finch, 2015; Morin et al., 2016). No study, to our knowledge, has cross-culturally compared PTSD-depression typological structures.
Addressing this significant limitation and using data from two culturally distinct samples (trauma-exposed military veterans from India and the U.S.), we examined (1) the best-fitting latent class solution in categorizing participants based on their responses to PTSD and depression items; (2) multi-group invariance (equivalence) of the latent class solution across samples; and (3) construct validity of the optimal latent class solution in each sample. We hypothesized finding an optimal 3- (Armour et al., 2015; Contractor et al., 2015) or 4-class solution (Hruska et al., 2014; Lai et al., 2015) differing primarily in severity in the U.S. sample. Further, we hypothesized finding an optimal 4-clas solution differing in severity and type in the India sample; this hypothesis is based on India’s similarities in the shared value of collectivism with the Eastern culture of China (Hofstede, 2001), where research has demonstrated that individuals can be meaningfully classified into four subgroups differing in severity and type based on their endorsement of PTSD and depression symptoms (Cao et al., 2016; Zhen, Quan, & Zhou, 2018). Additionally, covariates of number of trauma types, resilience, anxiety severity, rumination, alcohol use, and drug use were used to establish construct validity of the optimal class solution. Research indicates that number of traumas have differentiated subgroups of individuals with PTSD/depression only and co-morbid PTSD and depression (Choi, 2019); higher resilience has predicted lower PTSD and depression severity (Pietrzak, Johnson, Goldstein, Malley, & Southwick, 2009); anxiety severity co-occurs with PTSD and depression severity (Contractor et al., 2015); rumination is associated with PTSD and depression severity (Michael, Halligan, Clark, & Ehlers, 2007; Nolen-Hoeksema, 2000); risky alcohol use commonly co-occurs with PTSD and depression (Brière, Rohde, Seeley, Klein, & Lewinsohn, 2014; Goldstein et al., 2016); and co-morbid drug use with PTSD and depression is associated with worse outcomes (Driessen et al., 2008; Swendsen & Merikangas, 2000).
Method
Procedure and Participants
India sample.
The current study was funded by an internal grant awarded by University of North Texas (i.e., India Venture Fund); hence, sought and secured ethics approval by the University of North Texas Institutional Review Board (IRB). Although the concept of research-based Ethics Committees was introduced in India in 1980, it has not been implemented throughout the country because of a lack of requisite infrastructure (Kumar, 2006). To circumvent this, Schedule Y of the Indian Council of Medical Research (ICMR) Policy Statement for Ethics published in 1988 stated the following: “The trial site(s) may accept the approval granted to the protocol by the ethics committee of another trial site or the approval granted by an independent ethics committee, provided that the approving ethics committee(s) is/are willing to accept their responsibilities for the study at such trial site(s) and the trial site(s) is/are willing to accept such an arrangement and that the protocol version is same at all trial sites.” Thus, the IRB of University of North Texas approved data collection for this study in India.
The current study was described as an examination of the relation between stressful life events and emotional distress among ex-military veterans in India. Participants were 18 years or older, fluent in English/Hindi, computer literate, and ex-military veterans. Eligible and consenting participants completed the web-based survey via Qualtrics (Qualtrics, 2018). Since Hindi is the national language in India, all measures excluding the Connor-Davidson Resilience Scale (Davidson & Connor, 2017) were back-translated in the Hindi language using recommended procedures (Brislin, 1970; Villagran & Lucke, 2005). Participants were provided a choice to complete the study questionnaires in the Hindi or English language; no participant chose to complete the study questionnaires in Hindi. Consequently, all recorded data was in the English language.
Participants were recruited via several methods on a global level: (1) study information was circulated via electronic media to potential participants (e.g., emails, text messages, postings of study information on approved social media sites) by authorized study personnel; (2) recruitment was conducted by an authorized military psychologist in India who presented study information to military clients seeking mental health treatment; and (3) participants shared study information with other potential participants via electronic media (emails and text messages). As compensation, participants received either a pen (~ $5.00 value), a keychain (~ $5.00 value), a digital $5.00 gift card, or could request a donation of a $5.00 gift card to a predetermined charitable cause in India. From the original sample of 187 participants, we excluded 20 participants not meeting inclusionary criteria, 19 participants not endorsing any trauma, and two participants missing > 30% item-level data on primary measures. Detailed demographic information is provided in Table 1.
Table 1.
Descriptive information on demographics service-related information, and psychopathology constructs (India sample)
| Full Sample (n = 146) | Low Severity (n = 77) | Moderately High Severity (n = 14) | Moderately Low Severity (n = 27) | High Severity (n = 28) | |
|---|---|---|---|---|---|
| Mean (SD) | |||||
| Age | 43.65 (13.61) | 45.73 (13.09) | 37.07 (10.31) | 53.27 (12.88) | 31.93 (5.76) |
| Years in military service | 16.94 (10.82) | 16.91 (11.47) | 10.83 (6.81) | 24.15 (7.30) | 9.47 (6.97) |
| PTSD intrusion severity | 4.37 (4.12) | 1.01 (0.99) | 7.79 (1.85) | 4.93 (1.59) | 10.85 (1.49) |
| PTSD avoidance severity | 1.79 (1.84) | 0.38 (0.69) | 3.21 (0.97) | 2.33 (.73) | 4.39 (1.34) |
| PTSD NACM severity | 5.35 (5.94) | 1.24 (1.30) | 9 (3.42) | 4.04 (2.56) | 15.81 (2.00) |
| PTSD AAR severity | 5.19 (4.80) | 1.64 (1.40) | 7.71 (2.23) | 5.04 (2.09) | 13.22 (2.12) |
| Somatic depression severity | 3.06 (2.98) | 1.10 (1.09) | 5.50 (2.03) | 2.34 (1.81) | 7.61 (1.57) |
| Non-somatic depression severity | 1.83 (2.39) | 0.26 (0.64) | 3.64 (1.50) | 1.11 (1.28) | 5.68 (1.31) |
| Number of traumas | 9.09 (4.28) | 7.63 (3.70) | 9.14 (3.84) | 7.78 (3.68) | 14.32 (1.91) |
| n (% within column)* | |||||
| Gender | |||||
| Male | 132 (91.70%) | 71 (93.40%) | 12 (85.70%) | 25 (92.60%) | 24 (88.90%) |
| Female | 12 (8.30%) | 5 (6.60%) | 2 (14.30%) | 2 (7.40%) | 3 (11.10%) |
| Highest Educational Achievement | |||||
| Graduation and below | 51 (35.90%) | 35 (46.10%) | 6 (42.90%) | 6 (23.10%) | 4 (15.40%) |
| Post-graduation/professional degree | 91 (64.10%) | 41 (53.90%) | 8 (57.10%) | 20 (76.90%) | 22 (84.60%) |
| Relationship Status | |||||
| Not currently married | 38 (26.60%) | 20 (26.70%) | 8 (57.10%) | 5 (18.50%) | 5 (18.50%) |
| Currently married | 105 (73.40%) | 55 (73.30%) | 6 (42.90%) | 22 (81.50%) | 22 (81.50%) |
| Family Composition | |||||
| Single | 42 (29.60%) | 23 (29.90%) | 7 (53.80%) | 3 (11.10%) | 9 (36.00%) |
| Nuclear | 63 (44.40%) | 36 (46.80%) | 3 (23.10%) | 20 (74.10%) | 4 (16.00%) |
| Joint | 37 (26.10%) | 18 (23.40%) | 3 (23.10%) | 4 (14.80%) | 12 (48.00%) |
| Children | |||||
| Yes | 97 (67.80%) | 50 (66.70%) | 6 (42.90%) | 22 (81.50%) | 19 (70.40%) |
| No | 46 (32.20%) | 25 (33.30%) | 8 (57.10%) | 5 (18.50%) | 8 (29.60%) |
| Religion | |||||
| Hinduism | 71 (49%) | 39 (50.60%) | 4 (28.60%) | 13 (48.10%) | 15 (55.60%) |
| Islam | 5 (3.40%) | 2 (2.60%) | 0 | 0 | 3 (11.10%) |
| Christianity | 25 (17.20%) | 12 (15.60%) | 4 (28.60%) | 4 (14.80%) | 5 (18.50%) |
| Sikhism | 30 (20.70%) | 16 (20.80%) | 6 (42.90%) | 8 (29.60%) | 0 |
| Buddhism | 3 (2.10%) | 0 | 0 | 0 | 3 (11.10%) |
| Jainism | 1 (0.07%) | 1 (1.30%) | 0 | 0 | 0 |
| Do not follow a religion | 10 (6.90%) | 7 (9.10%) | 0 | 2 (7.40%) | 1 (3.60%) |
| Current Household Income | |||||
| < 18,00,000 (lac) Rupees | 83 (57.20%) | 38 (49.40%) | 8 (57.10%) | 12 (44.40%) | 25 (92.60%) |
| ≥18,00,000 (lac) Rupees | 62 (42.80%) | 39 (50.60%) | 6 (42.90%) | 15 (55.60%) | 2 (7.40%) |
| Reprimanded/Received Demotion in Service | |||||
| Yes | 10 (7.00%) | 0 | 0 | 0 | 10 (37.00%) |
| No | 132 (93%) | 76 (100%) | 13 (100%) | 26 (100%) | 17 (63.00%) |
| Decorated for Service | |||||
| Yes | 60 (42.30%) | 22 (29.30%) | 4 (30.80%) | 12 (44.40%) | 22 (81.50%) |
| No | 82 (57.70%) | 53 (70.70%) | 9 (69.20%) | 15 (55.60%) | 5 (18.50%) |
| Injured during Service | |||||
| Yes | 36 (24.70%) | 11 (15.10%) | 2 (20.00%) | 5 (20.00%) | 18 (69.20%) |
| No | 98 (73.10%) | 62 (84.90%) | 8 (80.00%) | 20 (80.00%) | 8 (30.80%) |
| Battle Casualty | |||||
| Yes | 28 (32.30%) | 6 (15.80%) | 1 (10.00%) | 3 (21.40%) | 18 (72.00%) |
| No | 59 (67.80%) | 32 (84.20%) | 9 (90.00%) | 11 (78.60%) | 7 (28.00%) |
| Branch of Service | |||||
| Army | 131 (94.90%) | 71 (97.30%) | 13 (100%) | 26 (100%) | 21 (80.80%) |
| Navy | 3 (2.20%) | 0 | 0 | 0 | 3 (11.50%) |
| Air-force | 4 (2.90%) | 2 (2.70%) | 0 | 0 | 2 (7.70%) |
| Probable PTSD (>/= 31) | 29 (19.90%) | 0 | 4 (28.60%) | 0 | 25 (89.30%) |
| Probable depression (>/= 10) | 32 (21.90%) | 0 | 6 (42.90%) | 0 | 26 (92.90%) |
Note. PTSD is posttraumatic stress disorder; NACM is negative alterations in cognition and mood; AAR is alterations in arousal and reactivity;
All reported percentages are valid percentages to account for missing data
U.S. sample.
The current study was approved by the University of Rhode Island IRB. Participants were recruited via Amazon’s Mechanical Turk (MTurk); the study was described as a survey about military combat experiences and moral, emotional, and psychological well-being. Interested participants clicked the advertisement to learn more about the study, which directed them to an external web-based survey via Qualtrics. Participants were 18 years or older, were proficient in English, served in the US military, and were deployed to either Afghanistan or Iraq in support of recent operations. As compensation, participants received $2.00. From the original sample of 203 participants, we excluded six participants not endorsing any trauma, and three participants missing >30% item-level data on primary measures. Detailed demographic information is provided in Table 2.
Table 2.
Descriptive information on demographics, service-related information, and psychopathology constructs (U.S. Sample)
| Full Sample (n = 194) | Low Severity (n = 83) | High PTSD-Low Depression (n = 26) | High Depression-Low PTSD (n = 36) | High Severity (n = 49) | |
|---|---|---|---|---|---|
| Mean (SD) | |||||
| Age | 35.28 (8.11) | 36.89 (8.75) | 34.38 (7.44) | 33.19 (6.12) | 34.55 (8.27) |
| Years in military service | 8.61 (6.30) | 9.32 (6.86) | 8.74 (5.67) | 8.00 (5.67) | 7.85 (6.14) |
| Number of deployments | 3.44 (1.80) | 3.52 (1.86) | 3.58 (2.30) | 3.22 (1.40) | 3.39 (1.72) |
| PTSD intrusion severity | 6.70 (6.08) | 1.51 (2.25) | 10.23 (3.79) | 6.77 (3.88) | 13.87 (4.07) |
| PTSD avoidance severity | 3.02 (2.78) | 0.69 (1.08) | 5.60 (1.66) | 2.47 (1.58) | 6.24 (1.45) |
| PTSD NACM severity | 9.20 (8.15) | 1.71 (2.53) | 10.19 (4.26) | 12.34 (3.87) | 20.25 (3.49) |
| PTSD AAR severity | 9.54 (7.42) | 2.67 (3.03) | 12.62 (4.07) | 11.55 (4.19) | 18.57 (3.26) |
| Somatic depression severity | 5.57 (4.46) | 1.76 (2.16) | 4.69 (1.96) | 8.66 (2.65) | 10.69 (2.52) |
| Non-somatic depression severity | 3.68 (3.62) | 0.93 (1.36) | 1.69 (1.32) | 5.79 (2.52) | 8.22 (2.26) |
| Number of traumas | 11.62 (4.95) | 10.34 (5.32) | 12.69 (4.28) | 13.39 (4.29) | 11.94 (4.63) |
| n (% within column)* | |||||
| Gender | |||||
| Male | 150 (77.70%) | 64 (78.00%) | 22 (84.60%) | 27 (75.00%) | 37 (75.50%) |
| Female | 43 (22.30%) | 18 (22.00%) | 4 (15.40%) | 9 (25.00%) | 12 (24.50%) |
| Race | |||||
| White | 135 (71.40%) | 64 (78.00%) | 19 (76.00%) | 24 (68.60%) | 28 (59.60%) |
| Black or African American | 30 (15.90%) | 14 (17.10%) | 1 (4.00%) | 7 (20.00%) | 8 (17.00%) |
| Asian | 16 (6.90%) | 3 (3.70%) | 3 (12.00%) | 2 (5.70%) | 5 (10.60%) |
| American Indian or Alaskan Native | 11 (5.80%) | 1 (1.20%) | 2 (8.00%) | 2 (5.70%) | 6 (12.80%) |
| Ethnicity | |||||
| Hispanic or Latino | 26 (13.90%) | 11 (13.60%) | 4 (16.00%) | 26 (13.90%) | 6 (13.30%) |
| Not Hispanic or Latino | 161 (86.10%) | 70 (86.40%) | 21 (84.00%) | 161 (86.10%) | 39 (86.70%) |
| Branch of Service | |||||
| Army | 101 (52.10%) | 37 (44.60%) | 13 (50.00%) | 17 (47.20%) | 34 (69.40%) |
| Navy | 29 (14.90%) | 14 (16.90%) | 5 (19.20%) | 7 (19.40%) | 3 (6.10%) |
| Air Force | 38 (19.60%) | 22 (26.50%) | 6 (23.10%) | 7 (19.40%) | 3 (6.10%) |
| Marines | 26 (13.40%) | 10 (12.00%) | 2 (7.70%) | 5 (13.90%) | 9 (18.40%) |
| Type of Service | |||||
| Active Duty | 166 (85.60%) | 70 (84.0%) | 25 (96.20%) | 32 (88.90% ) | 39 (9.60%) |
| Reserves | 14 (7.20%) | 7 (8.40%) | 1 (3.80%) | 3 (8.30) | 3 (6.10%) |
| National Guard | 14 (7.20%) | 6 (7.20%) | 0 (0%) | 1 (2.80%) | 7 (14.30%) |
| Probable PTSD (>/= 31) | 79 (43.60%) | 0 | 19 (76.00%) | 20 (60.60%) | 40 (100.00%) |
| Probable Depression (>/= 10) | 80 (43.20%) | 4 (4.80%) | 3 (11.50%) | 31 (93.90%) | 42 (97.70%) |
Note. PTSD is posttraumatic stress disorder; NACM is negative alterations in cognition and mood; AAR is alterations in arousal and reactivity;
All reported percentages are valid percentages to account for missing data
Measures
Life Events Checklist for DSM-5 (LEC-5; Weathers et al., 2013).
Administered to both samples, the LEC-5 is a 17-item self-report measure assessing lifetime traumatic events; the first 16 items assess specific types of trauma (e.g., transportation accident, assault) and the 17th item assesses exposure to other stressful life events not captured by the first 16 items. Participants responded to each item using a 6-point scale (Happened to me, Witnessed it, Learned about it, Part of my job, Not sure, Doesn’t apply). An 18th item was included in the India sample asking participants to indicate their most distressing trauma (the measure assessing PTSD symptoms was cued to the most distressing trauma reported for this item).
PTSD Checklist for DSM-5 (PCL-5; Weathers et al., 2013).
Administered to both samples, the PCL-5 is a 20-item self-report measure that assesses severity of PTSD symptoms referencing the previous month. Response options range from 0 (Not at all) to 4 (Extremely). In the India sample, participants completed the PCL-5 referencing the most distressing trauma on the LEC-5. In the U.S. sample, participants completed the PCL-5 referencing their most distressing deployment-related event. The PCL-5 demonstrates excellent psychometric properties (Wortmann et al., 2016). The ordinal Cronbach’s α for the PCL-5 intrusions, avoidance, NACM, and AAR subscales was .90, .79, .93, and .89 respectively in the India sample; and .95, .92, .92, and .94 respectively in the U.S. sample.
Patient Health Questionnaire-9 (PHQ-9; Kroenke & Spitzer, 2002).
Administered to both samples, the PHQ-9 is a 9-item self-report measure assessing depression severity referencing the past 2 weeks. Response options range from 0 (Not at all) to 3 (Nearly every day). We used the non-somatic (1, 2, 6, and 9) and somatic (3, 4, 5, 7, and 8) depression subscales (Elhai et al., 2012; Krause, Reed, & McArdle, 2010). The PHQ-9 demonstrates excellent psychometrics (Kroenke & Spitzer, 2002; Kroenke, Spitzer, & Williams, 2001). The ordinal Cronbach’s α for the somatic and non-somatic depression subscales was .89 and .86 respectively in the India sample; and .91 and .59 respectively in the U.S. sample.
Generalized Anxiety Disorder-7 (GAD-7; Spitzer, Kroenke, Williams, & Löwe, 2006).
Administered to the India sample, the GAD-7 is a 7-item self-report measure of anxiety symptoms over the past two weeks. The GAD-7 demonstrates acceptable psychometrics (Löwe et al., 2008; Spitzer et al., 2006); ordinal Cronbach’s α was .92 in the current study.
Connor-Davidson Resilience Scale (CD-RISC; Davidson & Connor, 2017).
Administered to the India sample, the 25-item CD-RISC examines resilience referencing the past month. The CD-RISC-25 demonstrates good psychometrics (Connor & Davidson, 2003; Singh & Yu, 2010); ordinal Cronbach’s α was .95 in the current study.
Alcohol Use Disorder Identification Test (AUDIT; Saunders, Aasland, Babor, De la Fuente, & Grant, 1993).
Administered to the U.S. sample, the AUDIT is a 10-item self-report measure that assesses alcohol consumption, drinking behaviors, adverse reactions to drinking, and alcohol-related problems referencing the past year. The AUDIT demonstrates good psychometrics (Saunders et al., 1993); ordinal Cronbach’s α was .93 in the current study.
Drug Abuse Screening Test (DAST-10; Skinner, 1982).
Administered to the U.S. sample, the DAST-10 is a 10-item self-report measure that assesses the presence of problems related to drug use (e.g., occupational/relational problems, illegal activities, regret) referencing the past year. The DAST has adequate psychometrics (Yudko, Lozhkina, & Fouts, 2007); ordinal Cronbach’s α was .95 in the current study.
Ruminative Response Scale–Brooding (RRS-B; Treynor, Gonzalez, & Nolen-Hoeksema, 2003).
Administered to the U.S. sample, the RRS-B is a 5-item self-report measure assessing tendency towards a passive focus on negative emotions (no reference to any specific timeframe). The RRS-B has adequate psychometrics (Erdur-Baker & Bugay, 2010); ordinal Cronbach’s α was .91 in the current study.
Data Analyses
First, we conducted latent profile analyses (LPA) with Mplus 8 in each sample using the PCL-5 subscales (intrusions, avoidance, NACM, and AAR) and PHQ-9 subscales (somatic and non-somatic depression) as indicators. The estimator was Maximum Likelihood estimation with robust standard errors (MLR), and 1-5 class models were analyzed. The optimal class solution had lower Bayesian Information Criterion (BIC) and sample-size adjusted BIC (SSABIC) values; an Adjusted Lo–Mendell–Rubin (LMR) Likelihood Ratio Test p<.05, a Bootstrapped Likelihood Ratio Test (BLRT) p<.05, higher entropy values, parsimony, and conceptual meaning (DiStefano & Kamphaus, 2006; Nylund, Asparouhov, & Muthén, 2007; Nylund, Bellmore, Nishina, & Graham, 2007).
Second, we compared the typological structures across the samples using Multiple Groups (MG) LPA (Eid et al., 2003; Finch, 2015; Kankaraš, Moors, & Vermunt, 2010). The models are examined in a progressively restrictive manner; in other words, higher levels of invariance are examined contingent on finding invariance at the prior step. The restricted model is compared to the unrestricted model by using fit indices of Akaike Information Criterion (AIC), BIC, and SSABIC values where lower values indicate a better-fitting model (Chung & Breslau, 2008; Kankaraš et al., 2010; Morin et al., 2016). For configural profile similarity, we assessed if the optimal number of classes was the same across compared sample. For structural profile similarity, we imposed equality constraints on the within-profile means (i.e., indicator levels) across the samples to assess if they had similar levels of indicators. For dispersion profile similarity, we equated indicators’ variability (within-profile inter-individual differences) to identify if the samples were comparably homogenous and internally consistent. Lastly, distributional profile similarity was examined by equating latent class sizes (i.e. relative frequencies) across samples (Eid et al., 2003; Morin et al., 2016).
Third, we tested the effects of covariates (India sample – number of trauma types, anxiety severity, and resilience; U.S. sample – number of trauma types, rumination, alcohol use, and drug use) on latent class membership of the optimal model in each group (construct validity). We used the three-step approach to account for misspecification bias (Vermunt, 2010).
Results
LPA (see Table 3)
Table 3.
Fit indices of the latent class models and invariance testing models
| Model | AIC | BIC | SSABIC | Entropy | Lo–Mendell–Rubin Likelihood Ratio Test (p) | Bootstrapped Likelihood Ratio Test (p) |
|---|---|---|---|---|---|---|
| India Sample | ||||||
| 1 class | 4444.42 | 4480.28 | 4442.25 | |||
| 2 class | 3580.73 | 3637.42 | 3577.29 | .99 | 853.24 (p < .001) | p < .001 |
| 3 class | 3369.7 | 3447.36 | 3365.09 | .98 | 218.67 (p = .006) | p < .001 |
| 4 class | 3278.96 | 3377.42 | 3273.00 | .98 | 101.91 (p = .02) | p < .001 |
| U.S. Sample | ||||||
| 1 class | 6907.46 | 6946.67 | 6908.66 | |||
| 2 class | 6092.87 | 6154.96 | 6094.77 | .94 | 806.71 (p < .001) | p < .001 |
| 3 class | 5870.53 | 5955.50 | 5873.13 | .94 | 230.10 (p = .001) | p < .001 |
| 4 class | 5790.76 | 5898.60 | 5794.06 | .94 | 91.30 (p = .069) | p < .001 |
| 5 class | 5731.07 | 5861.78 | 5735.07 | .92 | 71.75 (p = .417) | p < .001 |
| Invariance Models | ||||||
| Configural Profile Similarity | 9536.261 | 9792.800 | 9580.264 | .97 | ||
| Structural Profile Similarity | 9654.352 | 9818.997 | 9682.593 | .95 | ||
Note. AIC is Akaike Information Criterion; BIC is Bayesian Information Criterion; SSABIC is sample-size adjusted BIC; bolded values represent the optimal class solution for the current study.
India sample.
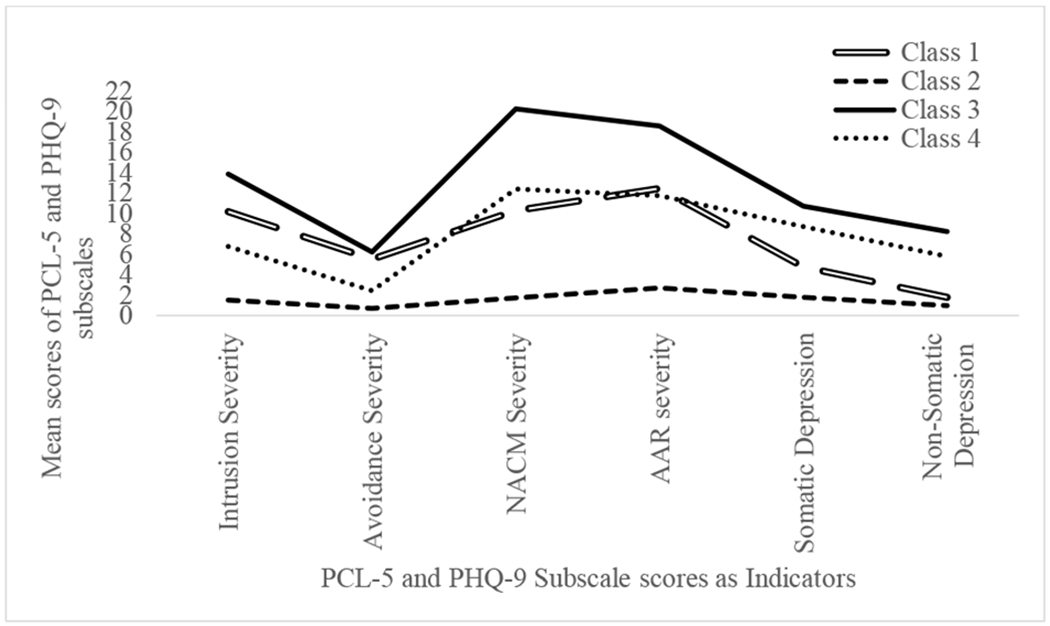
Based on established guidelines, we selected the 4-class solution as optimal. There were model convergence problems with the 5-class solution possibly attributable to small sample size in one of the classes (Hipp & Bauer, 2006). See Figure 1 for a graphical depiction of the 4-class solution. Class 1 with overall lowest severity was labelled “Low Severity;” in contrast, Class 4 with overall highest severity was labelled “High Severity.” Class 2 and Class 3 were characterized by moderately high and moderately low severity, thus labelled as “Moderately High Severity” and “Moderately Low Severity,” respectively.
Figure 1.

Latent classes of participants based on PTSD and depression subscale scores (India sample)
Note. PCL-5 is PTSD Checklist for DSM-5; PHQ-9 is Patient Health Questionnaire-9; NACM is negative alterations in cognition and mood; AAR is alterations in arousal and reactivity; Class 1 is the Low Severity Class; Class 2 is the Moderately High Severity Class; Class 3 is the Moderately Low Severity Class; Class 4 is the High Severity Class.
U.S. sample.
Based on established guidelines, we selected the 4-class solution as optimal. According to the LMR value guidelines, the 3-class solution was optimal; however, LMR is not considered as the most robust indicator in selecting the optimal class solution (Nylund, Asparouhov, et al., 2007). We gave more importance to the BIC and SSABIC values; the SSABIC is considered as a more robust index when considering all possible combinations of number of indicators and sample sizes (Nylund, Asparouhov, et al., 2007). Although the BIC and SSABIC values continued to decrease beyond the 4-class solution, the difference in values began to plateau between the 3- and 4-class solutions (DiStefano & Kamphaus, 2006; Raftery, 1995). Additionally, there was no difference in the entropy values across the 3- and 4-class solutions and prior research has supported a 4-class solution (Au, Dickstein, Comer, Salters-Pedneault, & Litz, 2013; Hruska et al., 2014; Lai et al., 2015).
See Figure 2 for a graphical depiction of the 4-class solution. Overall, Class 2 with overall lowest severity was labelled “Low Severity;” in contrast, Class 3 with overall highest severity was labelled “High Severity.” Class 1 was characterized by relatively higher PTSD subscale severity and lower depression subscale severity compared to Class 4; hence, Classes 1 and 4 were labelled as “High PTSD-Low Depression” and “High Depression-Low PTSD,” respectively.
Figure 2.
Latent classes of participants based on PTSD and depression subscale scores (U.S sample)
Note. PCL-5 is PTSD Checklist for DSM-5; PHQ-9 is Patient Health Questionnaire-9; NACM is negative alterations in cognition and mood; AAR is alterations in arousal and reactivity; Class 1 is the High PTSD-Low Depression Class; Class 2 is the Low Severity Class; Class 3 is the High Severity Class; Class 4 is the High Depression-Low PTSD Class.
MGLPA (See Table 3)
Results indicated configural profile similarity of PTSD-depression typologies across the cultural groups, wherein each cultural group had an optimal 4-class solution. However, results indicated lack of structural profile similarity across the cultural groups based on increasing AIC, BIC, and SSABIC values from the configural profile simialarity model. Based on these results, further invariance testing (i.e., dispersion and distributional profile similarity) was not conducted.
Construct Validity of the Optimal Class Solution (see Table 4)
Table 4.
Results of multinomial logistic regression analyses
| India Sample (OR; 95% CI) | ||||||
|---|---|---|---|---|---|---|
| Class 2 vs. 1# | Class 3 vs. 1# | Class 4 vs. 1# | Class 3 vs. 2# | Class 4 vs. 2# | Class 4 vs. 3# | |
| Anxiety Severity | 6.03 (2.78 – 13.10)p = .04 | 3.27 (1.83–5.87)p = .02 | 11.69 (3.37 – 40.56)p = .15 | 0.54 (0.33-0.89)p = .001 | 1.94 (0.77–4.87)p = .30 | 3.57 (1.19–10.72)p = .20 |
| Resilience | 0.95 (0.87–1.04)p = .25 | 1.03 (0.97–1.10)p = .32 | 0.96 (0.86–1.09)p = .53 | 1.09 (1.01–1.17)p = .03 | 1.01 (0.91–1.13)p = .81 | .93 (0.84–1.04)p = .18 |
| Number of trauma types | 1.30 (0.86–1.97)p = .28 | 1.01 (0.84–1.22)p = .90 | 3.49 (1.79–6.77)p = .04 | 0.78 (0.53–1.15)p = .16 | 2.68 (1.52–4.72)p = .03 | 3.45 (1.79–6.64)p = .03 |
| U.S. Sample (OR; 95% CI) | ||||||
| Class 2 vs. 1# | Class 3 vs. 1# | Class 4 vs. 1# | Class 3 vs. 2# | Class 4 vs. 2# | Class 4 vs. 3# | |
| Number of trauma types | 0.93 (0.85-1.03)p = .17 | 0.92 (0.78-1.07)p = .26 | 1.00 (0.85-1.19)p = .98 | 0.98 (0.86-1.24)p = .11 | 1.07 (0.93-1.24)p = .35 | 1.09 (0.96-1.25)p = .21 |
| Alcohol use | 1.00 (0.92-1.08)p = .92 | 1.15 (1.04-1.27)p = .01 | 1.07 (0.98-1.16)p = .14 | 1.15 (1.06-1.15)p = .003 | 1.07 (1.00-1.15)p = .06 | .93 (0.86-1.00)p = .05 |
| Drug use | 1.18 (0.77-1.82)p = .48 | 1.36 (0.89-2.07)p = .22 | 1.37 (0.90-2.09)p = .21 | 1.15 (0.87-1.53)p = .37 | 1.16 (0.88-1.53)p = .33 | 1.01 (0.79-1.29)p = .93 |
| Rumination | 1.03 (0.91-1.16)p = .66 | 1.34 (1.13-1.58)p = .003 | 1.33 (1.14-1.56)p = .002 | 1.30 (1.11-1.53)p = .01 | 1.30 (1.10-1.52)p = .01 | 1.00 (0.86-1.15)p = .96 |
Note. India Sample: Class 1 is the Low Severity Class; Class 2 is the Moderately High Severity Class; Class 3 is the Moderately Low Severity Class; Class 4 is the High Severity Class; U.S. Sample: Class 1 is the High PTSD-Low Depression Class; Class 2 is the Low Severity Class; Class 3 is the High Severity Class; Class 4 is the High Depression-Low PTSD Class; # indicates the reference class; bolded values represent significant odd ratio estimates.
India sample.
Anxiety severity was significant in predicting membership in the Moderately High Severity (B = 1.78, p < .001), and the Moderately Low Severity (B = 1.19, p < .001) Classes compared to the Low Severity Class. Comparing the Low and High Severity Classes, results indicated significant covariates of anxiety severity (B = 2.46, p < .001), and number of trauma types (B = 1.25, p < .001). Comparing the Moderately High and Moderately Low Severity Classes, results indicated significant covariates of anxiety severity (B = −.61, p = .02) and resilience (B = .08, p = .02). Further, number of trauma types (B = .99, p = .001) significantly predicted the High Severity vs. Moderately High Severity Class membership. Lastly, comparing the Moderately Low Severity and High Severity Classes, results indicated significant covariates of anxiety severity (B = 1.27, p = .02), and number of trauma types (B = 1.24, p < .001).
U.S. sample.
Compared to the High PTSD-Low Depression Class, alcohol use (B = .14, p = .01) and rumination (B = .29, p = .001) significantly predicted membership in the High Severity Class. Also, rumination (B = .29, p < .001) was significant in predicting the High Depression-Low PTSD vs. High PTSD-Low Depression Class membership. No covariates significantly predicted membership in the Low Severity Class compared to the High PTSD-Low Depression Class. Compared to the Low Severity Class, alcohol use (B = .14, p = .001) and rumination (B = .26, p =.002) were significant predictors of the High Severity Class. Further, compared to the High Depression-Low PTSD Class, alcohol use (B = .07, p = .05) and rumination (B = .26, p = .002) were significant predictors of the Low Severity Class. Finally, compared to the High Severity Class, alcohol use (B = −.07, p = .05) was a significant predictor of the High Depression-Low PTSD Class.
Discussion
Study results indicated optimal 4-class solutions in the India and U.S. samples, providing support for configural profile similarity. However, these classes lacked structural profile similarity, differing in meaning and nature across the compared cultural samples. Specifically, subgroups in the India sample were characterized by (1) lower severity of PTSD and depression symptoms, (2) moderately higher severity of PTSD and depression symptoms, (3) moderately lower severity of PTSD and depression symptoms, and (4) higher severity of PTSD and depression symptoms. Conversely, subgroups in the U.S. sample were characterzied by (1) higher severity of PTSD symptoms and lower severity of depression symptoms, (2) lower severity of PTSD and depression symptoms, (3) higher severity of PTSD and depression symptoms, and (4) lower severity of PTSD symptoms and higher severity of depression symptoms. Thus, classes in the India sample differed only in severity (i.e., quantitatively), whereas those in the U.S. sample differed in both severity and type (i.e., qualitatively), providing tentative support for a depressive subtype of PTSD in this sample.
Several factors may explain differences in typological structures across the compared cultural samples. From a methodological perspective, the types of Criterion A traumas participants referenced when completing the PCL-5 differed across the samples. The India sample completed the PCL-5 in reference to their most traumatic event (suggesting potential variability in trauma types across classes), whereas participants in the U.S. sample referenced their most distressing deployment-related event (limiting variability in trauma types across classes). From a mechanism-based perspective, different biological, psychological, and social factors may have influenced the nature of the PTSD-depression classes in the India and U.S. samples. For example, classes may have differed in the extent of activation of the approach and withdrawal systems stemming from neuroanatomical variations (Kemp et al., 2010); this may have resulted in differing levels of positive and negative affect in the India vs. U.S. samples (Shankman & Klein, 2003). Lastly, from a cultural perspective, differences in emotional experiences (Eid & Diener, 2009) may have accounted for the inter-sample differences given the central role of emotions in PTSD/depression’s diagnostic criteria (American Psychiatric Association, 2013) alongside empirical evidence for deficits in emotional functioning in PTSD and depression (Litz, Orsillo, Kaloupek, & Weathers, 2000; Thompson et al., 2012). For instance, individuals from collectivistic cultures (e.g., India) may view intense emotions as threatening, irrelevant, or illness-causing, and thus value their moderation or suppression, resulting in less frequent/intense emotions than individuals from individualistic cultures (e.g., U.S.; Eid & Diener, 2009). Alternatively, evidence supports cross-cultural differences in the clinical expression of PTSD and depression. Regarding depression, individuals from non-Western countries have found to report more somatic and fewer psychological symptoms (Ryder et al., 2008). Cross-cultural variability also has been documented for PTSD, specifically for avoidance and numbing symptoms, distressing dreams, and somatic symptoms (Hinton & Lewis-Fernández, 2011). Additional research is needed to further examine these explanations in accounting for differences in the PTSD-depression typologies.
Notably, the four PTSD-depression subgroups for the India sample, although similar in number, were different in type compared to subgroups identified by research in other Eastern cultures such as China (Cao et al., 2016; Zhen et al., 2018). Specifically, the 4-class solution in the India sample did not differ qualitatively, which is in contrast to findings from research conducted in China. Sample and methodological differences may be contributing factors for discrepant results; for instance, the two studies conducted in China used data from victims of a natural disaster in contrast to the current study that utilized data from military veterans. Additionally, although China and India share collectivistic values, other cultural differences may have contributed to discrepant findings. For instance, India and China, respectively, (1) have cultural roots of Hinduism and Confucianism, (2) analytical and holistic modes of thinking, and (3) are relatively vocal/direct and subtle/indirect in dealing with concerns (Jin, Gavin, & Kang, 2012).
Current study findings potentially highlight differences in the etiology and treatment of the PTSD-depression co-occurrence. For both samples, PTSD and depression symptoms fluctuated in relation to one another; hence, the development and maintenance of symptoms of PTSD and depression may be closely tied to one another (Ying, Wu, & Lin, 2012). Thus, treatment providers need to assess for depression symptoms among individuals identified by PTSD symptoms and PTSD symptoms among individuals identified by depression symptoms. Further, findings suggest the utility of interventions mitigating both PTSD and depression symptoms concurrently (e.g., Trauma-focused Cognitive Behavioral Therapy; Lenz & Hollenbaugh, 2015), further emphasized by the fact that co-occurring depression symptoms may complicate PTSD treatment (McLean, Morris, Conklin, Jayawickreme, & Foa, 2014), and increase risk for behavioral problems (e.g., substance use; Gil-Rivas, Prause, & Grella, 2009). Notably, differences in the nature of subgroups (e.g., depressive subtype of PTSD) also suggest that PTSD-depression treatments may need to be individualized for effectiveness. For instance, if classes are influenced by physiological differences and differ in symptom type, different physiological/pharmacological treatments (e.g., targeting approach/withdrawal) may be effective for different classes. Relatedly, study findings underscore the need for culturally-sensitive practices in treating co-occurring PTSD and depression. Our findings provide initial evidence for culturally-distinct subgroups; if replicated, these subgroups may inform risk and recovery post-trauma profiles for India and U.S. veterans, and highlight the need for tailoring preventive and remedial interventions to account for the cultural heterogeneity in PTSD and depression symptoms.
Generally speaking, across both the India and U.S. samples, individuals in classes characterized by greater PTSD and depression severity exhibited the highest levels of clinically-relevant covariates, with a few notable exceptions. First, in the India sample, levels of resilience differed only among individuals in the Moderately Low Severity vs. Moderately High Severity Classes, with those in the latter class having lower levels of resilience. Perhaps, resilience does not protect against developing PTSD and depression symptoms, but instead that it may reduce the likelihood of a more severe presentation of PTSD and depression symptoms. Indeed, among individuals experiencing chronic and repeated trauma (e.g., veterans), research demonstrates that resiliency resources can become overburdened, leading to a sizable proportion of the population being symptomatic, albeit less so than those who demonstrate less resilience (Hobfoll, Mancini, Hall, Canetti, & Bonanno, 2011). Second, in the U.S. sample, individuals in the High Depression-Low PTSD Class endorsed greater rumination vs. the Low Severity and High PTSD-Low Depression Classes. Conversely, compared to the High PTSD-Low Depression Class, no covariates significantly predicted membership in the Low Severity Class in the U.S. sample. These findings indicate that depression vs. PTSD symptoms may be particularly salient to some clinically-relevant outcomes such as rumination post-trauma. Lastly, number of traumas predicted class membership in the India but not in the U.S. sample possibly attributed to the lack of structural profile similarity across these cultural samples. Specifically, number of traumas may demonstrate a relation with PTSD-depression classes predominantly characterized by similar symptom severity (India sample) vs. type (U.S. sample).
In terms of study limitations, the cross-sectional and correlational nature of the data precludes determination of the precise nature and direction of the examined relationships; prospective and longitudinal investigations are needed. Second, this study relied on individuals’ self-report, which may have been influenced by willingness and/or ability to report accurately. Lastly, although our focus on military veterans is a strength of this study, our findings require replication across larger, more diverse samples. Despite these limitations, this study extends existing research by utilizing a person-centered approach to understand the PTSD-depression co-occurrence and their relation with covariates among distinct cultural samples. Overall, results suggest tailoring interventions to account for the PTSD-depression heterogeneity across identified groups.
Highlights.
We examined and compared PTSD-depression typologies across India and U.S. veterans.
Optimal 4-class solution differed in severity and severity/type in India and U.S. samples respectively.
Across cultural samples, classes were similar in number but different in meaning/nature.
Anxiety, number of traumas, and resilience predicted class membership in India sample.
Alcohol use and rumination predicted class membership in U.S. sample.
Acknowledgements
We acknowledge the contribution of Dr. Samir Rawat in helping with the data collection from India.
Funding Sources
This work was supported by the University of North Texas India Venture Fund (A.A.C., and R.S.); and the National Institute on Drug Abuse (N.H.W., K23DA039327). The funding sources had no role in study design; in the collection, analysis and interpretation of data; in the writing of the report; and in the decision to submit the article for publication.
Footnotes
Publisher's Disclaimer: This is a PDF file of an unedited manuscript that has been accepted for publication. As a service to our customers we are providing this early version of the manuscript. The manuscript will undergo copyediting, typesetting, and review of the resulting proof before it is published in its final form. Please note that during the production process errors may be discovered which could affect the content, and all legal disclaimers that apply to the journal pertain.
Declaration of Interests
None
Contributor Information
Ateka A. Contractor, Department of Psychology, University of North Texas
Nicole H. Weiss, Department of Psychology, University of Rhode Island
Melissa R. Schick, Department of Psychology, University of Rhode Island
Prathiba Natesan, Department of Educational Psychology, University of North Texas.
Shannon Forkus, Department of Psychology, University of Rhode Island.
Rachita Sharma, Department of Rehabilitation and Health Services, University of North Texas.
References
- American Psychiatric Association. (2013). Diagnostic and Statistical Manual of Mental Disorders (5th ed.). Washington, DC: American Psychiatric Association. [Google Scholar]
- Armour C, Contractor AA, Elhai JD, Stringer M, Lyle G, Forbes D, & Richardon JD (2015). Identifying latent profiles of posttraumatic stress and major depression symptoms in Canadian veterans: Exploring differences across profiles in health related functioning. Psychiatry Research, 228, 1–7. doi: 10.1016/j.psychres.2015.03.011 [DOI] [PubMed] [Google Scholar]
- Au TM, Dickstein BD, Comer JS, Salters-Pedneault K, & Litz BT (2013). Co-occurring posttraumatic stress and depression symptoms after sexual assault: A latent profile analysis. Journal of Affective Disorders, 149, 209–216. doi: 10.1016/j.jad.2013.01.026 [DOI] [PubMed] [Google Scholar]
- Bhushan B, & Kumar JS (2007). Emotional distress and posttraumatic stress in children surviving the 2004 Tsunami. Journal of Loss and Trauma, 12, 245–257. doi: 10.1080/15325020600945996 [DOI] [Google Scholar]
- Bonde JP, Utzon-Frank N, Bertelsen M, Borritz M, Eller NH, & Nordentoft M (2016). Risk of depressive disorder following disasters and military deployment: Systematic review with meta-analysis. The British Journal of Psychiatry, 208, 330–336. doi: 10.1192/bjp.bp.114.157859 [DOI] [PubMed] [Google Scholar]
- Breslau N (2009). The epidemiology of trauma, PTSD, and other posttrauma disorders. Trauma Violence Abuse, 10, 198–210. doi: 10.1177/1524838009334448 [DOI] [PubMed] [Google Scholar]
- Brière FN, Rohde P, Seeley JR, Klein D, & Lewinsohn PM (2014). Comorbidity between major depression and alcohol use disorder from adolescence to adulthood. Comprehensive Psychiatry, 55, 526–533. doi: 10.1016/j.comppsych.2013.10.007 [DOI] [PMC free article] [PubMed] [Google Scholar]
- Brislin R (1970). Back-translation for cross-cultural research. Journal of Cross-Cultural Psychology, 1, 185–216. [Google Scholar]
- Cao X, Wang L, Cao C, Zhang J, Liu P, Zhang B, … Elhai JD (2016). Patterns of DSM-5 posttraumatic stress disorder and depression symptoms in an epidemiological sample of Chinese earthquake survivors: A latent profile analysis. Journal of Affective Disorders, 186, 58–65. doi: 10.1016/j.jad.2015.06.058 [DOI] [PubMed] [Google Scholar]
- Choi JY (2019). Predictors of the co-occurrence of posttraumatic stress disorder and depressive disorder in psychiatric outpatients. Comprehensive Psychiatry, 89, 40–45. doi: 10.1016/j.comppsych.2018.12.005 [DOI] [PubMed] [Google Scholar]
- Chung H, & Breslau N (2008). The latent structure of post-traumatic stress disorder: Tests of invariance by gender and trauma type. Psychological Assessment, 38, 563–573. doi: 10.1017/S0033291777077002589 [DOI] [PubMed] [Google Scholar]
- Connor KM, & Davidson JR (2003). Development of a new resilience scale: The Connor-Davidson Resilience Scale (CD-RISC). Depression and Anxiety, 18, 76–82. doi: 10.1002/da.10113 [DOI] [PubMed] [Google Scholar]
- Contractor AA, Elhai JD, Fine TH, Tamburrino MB, Cohen GH, Shirley E, … Calabrese JR (2015). Latent profile analyses of posttraumatic stress disorder, depression and generalized anxiety disorder symptoms in trauma-exposed soldiers. Journal of Psychiatric Research, 68, 19–26. doi: 10.1016/j.jpsychires.2015.05.014 [DOI] [PubMed] [Google Scholar]
- Contractor AA, Mehta P, Tiamiyu MF, Hovey JD, Geers AL, Charak R, … Elhai JD (2014). Relations between PTSD and distress dimensions in an Indian child/adolescent sample following the 2008 Mumbai terrorist attacks. Journal of Abnormal Child Psychology, 42, 925–935. doi: 10.1007/s10802-013-9846-5 [DOI] [PubMed] [Google Scholar]
- Contractor AA, Roley-Roberts ME, Lagdon S, & Armour C (2017). Heterogeneity in patterns of DSM-5 posttraumatic stress disorder and depression symptoms: Latent profile analyses. Journal of Affective Disorders, 212, 17–24. doi: 10.1016/j.jad.2017.01.029 [DOI] [PubMed] [Google Scholar]
- Dalenberg CJ, Glaser D, & Alhassoon OM (2012). Statistical support for subtypes in posttraumatic stress disorder: The how and why of subtype analysis. Depression and Anxiety, 29, 671–678. doi: 10.1002/da.21926 [DOI] [PubMed] [Google Scholar]
- Davidson JRT, & Connor KM (2017). Connor-Davidson Resilience Scale (CD-RISC) Manual. Retrieved from www.cd-risc.com
- DiStefano C, & Kamphaus RW (2006). Investigating subtypes of child development: A comparison of cluster analysis and latent class cluster analysis in typology creation. Educational and Psychological Measurement., 66, 778–794. doi: 10.1177/0013164405284033 [DOI] [Google Scholar]
- Driessen M, Schulte S, Luedecke C, Schaefer I, Sutmann F, Ohlmeier M, … Broese T (2008). Trauma and PTSD in patients with alcohol, drug, or dual dependence: A multi-center study. Alcoholism: Clinical and Experimental Research, 32, 481–488. doi: 10.1111/j.1530-0277.2007.00591.x [DOI] [PubMed] [Google Scholar]
- Eid M, & Diener E (2009). Norms for experiencing emotions in different cultures: Inter-and intranational differences. Dordrecht, Netherlands: Springer. [DOI] [PubMed] [Google Scholar]
- Eid M, Langeheine R, & Diener E (2003). Comparing typological structures across cultures by multigroup latent class analysis: A primer. Journal of Cross-Cultural Psychology, 34, 195–210. doi: 10.1177/0022022102250427 [DOI] [Google Scholar]
- Elhai JD, Contractor AA, Tamburrino M, Fine TH, Prescott MR, Shirley E, … Calabrese JR (2012). The factor structure of major depression symptoms: A test of four competing models using the Patient Health Questionnaire-9. Psychiatry Research, 199, 169–173. doi: 10.1016/j.psychres.2012.05.018 [DOI] [PubMed] [Google Scholar]
- Erdur-Baker Ö, & Bugay A (2010). The short version of ruminative response scale: Reliability, validity and its relation to psychological symptoms. Procedia-Social and Behavioral Sciences, 5, 2178–2181. doi: 10.1016/j.sbspro.2010.07.433 [DOI] [Google Scholar]
- Finch H (2015). A comparison of statistics for assessing model invariance in latent class analysis. Open Journal of Statistics, 5, 191–210. doi: 10.4236/ojs.2015.53022 [DOI] [Google Scholar]
- Flory JD, & Yehuda R (2015). Comorbidity between post-traumatic stress disorder and major depressive disorder: alternative explanations and treatment considerations. Dialogues in Clinical Neuroscience, 17, 141–150. [DOI] [PMC free article] [PubMed] [Google Scholar]
- Gil-Rivas V, Prause J, & Grella CE (2009). Substance use after residential treatment among individuals with co-occurring disorders: The role of anxiety/depressive symptoms and trauma exposure. Psychology of Addictive Behaviors, 23, 303–314. doi: 10.1037/a0015355 [DOI] [PMC free article] [PubMed] [Google Scholar]
- Goldstein RB, Smith SM, Chou SP, Saha TD, Jung J, Zhang H, … Grant BF (2016). The epidemiology of DSM-5 posttraumatic stress disorder in the United States: Results from the National Epidemiologic Survey on Alcohol and Related Conditions-III. Social Psychiatry and Psychiatric Epidemiology, 51, 1137–1148. doi: 10.1007/s00127-016-1208-5 [DOI] [PMC free article] [PubMed] [Google Scholar]
- Hinton DE, & Lewis-Fernández R (2011). The cross- cultural validity of posttraumatic stress disorder: Implications for DSM- 5. Depression and Anxiety, 28, 783–801. doi: 10.1002/da.20753 [DOI] [PubMed] [Google Scholar]
- Hipp JR, & Bauer DJ (2006). Local solutions in the estimation of growth mixture models. Psychological Methods, 11, 36–53. doi: 10.1037/1082-989X.11.1.36 [DOI] [PubMed] [Google Scholar]
- Hobfoll SE, Mancini AD, Hall BJ, Canetti D, & Bonanno GA (2011). The limits of resilience: Distress following chronic political violence among Palestinians. Social Science & Medicine, 72, 1400–1408. doi: 10.1016/j.socscimed.2011.02.022 [DOI] [PMC free article] [PubMed] [Google Scholar]
- Hofstede G (2001). Culture’s consequences: Comparing values, behaviors, institutions and organizations across nations. Thousand Oaks, CA.: Sage Publications. [Google Scholar]
- Hruska B, Irish LA, Pacella ML, Sledjeski EM, & Delahanty DL (2014). PTSD symptom severity and psychiatric comorbidity in recent motor vehicle accident victims: A latent class analysis. Journal of Anxiety Disorders, 28, 644–649. doi: 10.1016/j.janxdis.2014.06.009 [DOI] [PMC free article] [PubMed] [Google Scholar]
- Ikin JF, Creamer MC, Sim MR, & McKenzie DP (2010). Comorbidity of PTSD and depression in Korean War veterans: Prevalence, predictors, and impairment. Journal of Affective Disorders, 125, 279–286. doi: 10.1016/j.jad.2009.12.005 [DOI] [PubMed] [Google Scholar]
- Jin B, Gavin M, & Kang JH (2012). Similarities and differences in forming purchase intention toward a US apparel brand: A comparison of Chinese and Indian consumers. Journal of the Textile Institute, 103, 1042–1054. doi: 10.1080/00405000.2012.660321 [DOI] [Google Scholar]
- Kankaraš M, Moors G, & Vermunt JK (2010). Testing for measurement invariance with latent class analysis In Davidov E, Schmidt P, Billiet J, & Meuleman B (Eds.), Cross-cultural analysis: Methods and applications (pp. 359–384). [Google Scholar]
- Kar N, Jagadisha, Sharma P, Murali N, & Mehrotra S (2004). Mental health consequences of the trauma of super-cyclone 1999 in Orissa. Indian Journal of Psychiatry, 46, 228–237. [PMC free article] [PubMed] [Google Scholar]
- Kemp AH, Griffiths K, Felmingham KL, Shankman SA, Drinkenburg WHIM, Arns M, … Bryant RA (2010). Disorder specificity despite comorbidity: Resting EEG alpha asymmetry in major depressive disorder and post-traumatic stress disorder. Biological psychology, 85, 350–354. doi: 10.1016/j.biopsycho.2010.08.001 [DOI] [PubMed] [Google Scholar]
- Kramer MD, Arbisi PA, Thuras PD, Krueger RF, Erbes CR, & Polusny MA (2016). The class-dimensional structure of PTSD before and after deployment to Iraq: Evidence from direct comparison of dimensional, categorical, and hybrid models. Journal of Anxiety Disorders, 39, 1–9. doi: 10.1016/j.janxdis.2016.02.004 [DOI] [PubMed] [Google Scholar]
- Krause JS, Reed KS, & McArdle JJ (2010). Factor structure and predictive validity of somatic and nonsomatic symptoms from the Patient Health Questionnaire-9: A longitudinal study after spinal cord injury. Archives of Physical Medicine and Rehabilitation, 91, 1218–1224. doi: 10.1016/j.apmr.2010.04.015 [DOI] [PubMed] [Google Scholar]
- Kroenke K, & Spitzer RL (2002). The PHQ-9: A new depression diagnostic and severity measure. Psychiatric Annals, 32, 509–515. doi: 10.3928/0048-5713-20020901-06 [DOI] [Google Scholar]
- Kroenke K, Spitzer RL, & Williams JBW (2001). The PHQ 9: Validity of a brief depression severity measure. Journal of General Internal Medicine, 16, 606–613. doi: 10.1046/j.1525-1497.2001.016009606.x [DOI] [PMC free article] [PubMed] [Google Scholar]
- Kumar NK (2006). Bioethics activities in India. . EMHJ - Eastern Mediterranean Health Journal, 12, S56–65. Retrieved from https://apps.who.int/iris/handle/10665/117186 [PubMed] [Google Scholar]
- Lai BS, Kelley ML, Harrison KM, Thompson JE, & Self-Brown S (2015). Posttraumatic stress, anxiety, and depression symptoms among children after Hurricane Katrina: A latent profile analysis. Journal of Child and Family Studies, 24, 1262–1270. doi: 10.1007/s10826-014-9934-3 [DOI] [PMC free article] [PubMed] [Google Scholar]
- Lenz AS, & Hollenbaugh KM (2015). Meta-analysis of trauma-focused cognitive behavioral therapy for treating PTSD and co-occurring depression among children and adolescents. Counseling Outcome Research and Evaluation, 6, 18–32. doi: 10.1177/2150137815573790 [DOI] [Google Scholar]
- Litz BT, Orsillo SM, Kaloupek D, & Weathers F (2000). Emotional processing in posttraumatic stress disorder. Journal of Abnormal Psychology, 109, 26–39. doi: 10.1037/0021-843X.109.1.26 [DOI] [PubMed] [Google Scholar]
- Löwe B, Decker O, Müller S, Brähler E, Schellberg D, Herzog W, & Herzberg PY (2008). Validation and standardization of the Generalized Anxiety Disorder Screener (GAD-7) in the general population. Medical Care, 46, 266–274. doi: 10.1097/MLR.0b013e318160d093 [DOI] [PubMed] [Google Scholar]
- Markus HR, & Kitayama S (1991). Culture and the self: Implications for cognition, emotion, and motivation. Psychological Review, 98(2), 224–253. doi: 10.1037/0033-295X.98.2.224 [DOI] [Google Scholar]
- Marsella AJ, Friedman MJ, & Spain EH (1996). Ethnocultural aspects of PTSD: An overview of issues and research directions In Marsella AJ, Friedman MJ, Gerrity ET, & Scurfiled RM (Eds.), Ethnocultural aspects of posttraumatic stress disorder. Issues, research, and clinical applications. (pp. 105–131). Washington DC: American Psychological Association. [Google Scholar]
- McLean CP, Morris SH, Conklin P, Jayawickreme N, & Foa EB (2014). Trauma characteristics and posttraumatic stress disorder among adolescent survivors of childhood sexual abuse. Journal of Family Violence, 29, 559–566. doi: 10.1007/s10896-014-9613-6 [DOI] [PMC free article] [PubMed] [Google Scholar]
- Michael T, Halligan SL, Clark DM, & Ehlers A (2007). Rumination in posttraumatic stress disorder. Depression and Anxiety, 24, 307–317. doi: 10.1002/da.20228 [DOI] [PubMed] [Google Scholar]
- Morin AJ, Meyer JP, Creusier J, & Biétry F (2016). Multiple-group analysis of similarity in latent profile solutions. Organizational Research Methods, 19, 231–254. doi: 10.1177/1094428115621148 [DOI] [Google Scholar]
- Nolen-Hoeksema S (2000). The role of rumination in depressive disorders and mixed anxiety/depressive symptoms. Journal of Abnormal Psychology, 109, 504–511. doi: 10.1037/0021-843X.109.3.504 [DOI] [PubMed] [Google Scholar]
- Norman SB, Trim RS, Goldsmith AA, Dimsdale JE, Hoyt DB, Norman GJ, & Stein MB (2011). Role of risk factors proximate to time of trauma in the course of PTSD and MDD symptoms following traumatic injury. Journal of Traumatic Stress, 24, 390–398. doi: 10.1002/jts.20669 [DOI] [PubMed] [Google Scholar]
- Nylund K, Asparouhov T, & Muthén BO (2007). Deciding on the number of classes in latent class analysis and growth mixture modeling: A monte carlo simulation study. Structural Equation Modeling., 14, 535–569. doi: 10.1080/10705510701575396 [DOI] [Google Scholar]
- Nylund K, Bellmore A, Nishina A, & Graham S (2007). Subtypes, severity, and structural stability of peer victimization: What does latent class analysis say? Child Development, 78, 1706–1722. doi: 10.1111/j.1467-8624.2007.01097.x [DOI] [PubMed] [Google Scholar]
- Patel V (2000). Culture and mental health consequences of trauma. Indian Journal of Social Work, 61, 619–630. [Google Scholar]
- Pathak K (2007). Terrorism: Some mental health issues in Indian perspectives. Eastern Journal of Psychiatry, 10, 6–9. [Google Scholar]
- Pietrzak RH, Johnson DC, Goldstein MB, Malley JC, & Southwick SM (2009). Psychological resilience and postdeployment social support protect against traumatic stress and depressive symptoms in soldiers returning from Operations Enduring Freedom and Iraqi Freedom. Depression and Anxiety, 26, 745–751. doi: 10.1002/da.20558 [DOI] [PubMed] [Google Scholar]
- Pole N, Gone JP, & Kulkarni M (2008). Posttraumatic stress disorder among ethnoracial minorities in the United States. Clinical Psychology: Science and Practice, 15, 35–61. doi: 10.1111/j.1468-2850.2008.00109.x [DOI] [Google Scholar]
- Post LM, Zoellner LA, Youngstrom E, & Feeny NC (2012). Understanding the relationship between co-occurring PTSD and MDD: Symptom severity and affect. Journal of Anxiety Disorders, 25, 1123–1130. doi: 10.1016/j.janxdis.2011.08.003. [DOI] [PMC free article] [PubMed] [Google Scholar]
- Qualtrics. (2018). Privacy Statement. Retrieved from https://www.qualtrics.com/security-statement/
- Raftery AE. (1995). Bayesian model selection in social research. Sociological Methodology, 25, 111–163. doi: 10.2307/271063 [DOI] [Google Scholar]
- Ryder AG, Yang J, Zhu X, Yao S, Yi J, Heine SJ, & Bagby RM (2008). The cultural shaping of depression: Somatic symptoms in China, psychological symptoms in North America? Journal of Abnormal Psychology, 117, 300–313. doi: 10.1037/0021-843X.117.2.300 [DOI] [PubMed] [Google Scholar]
- Saunders JB, Aasland OG, Babor TF, De la Fuente JR, & Grant M (1993). Development of the alcohol use disorders identification test (AUDIT): WHO collaborative project on early detection of persons with harmful alcohol consumption- II. Addiction, 88, 791–804. [DOI] [PubMed] [Google Scholar]
- Shankman SA, & Klein DN (2003). The relation between depression and anxiety: An evaluation of the tripartite, approach-withdrawal and valence-arousal models. Clinical Psychology Review, 23, 605–637. doi: 10.1016/j.biopsycho.2010.08.001 [DOI] [PubMed] [Google Scholar]
- Singh K, & Yu XN (2010). Psychometric evaluation of the Connor-Davidson Resilience Scale (CD-RISC) in a sample of Indian students. Journal of Psychology, 1, 23–30. doi: 10.1080/09764224.2010.11885442 [DOI] [Google Scholar]
- Skinner HA (1982). The Drug Abuse Screening Test. Addictive Behaviors, 7, 363–371. doi: 10.1016/0306-4603(82)90005-3 [DOI] [PubMed] [Google Scholar]
- Spitzer RL, Kroenke K, Williams JB, & Löwe B (2006). A brief measure for assessing Generalized Anxiety Disorder. The GAD-7. Archives of Internal Medicine, 166, 1092–1097. doi: 10.1001/archinte.166.10.1092 [DOI] [PubMed] [Google Scholar]
- Strander VA, Thomsen CJ, & Highfill-McRoy RM (2014). Etiology of depression comorbidity in combat-related PTSD: A review of the literature. Clinical Psychology Review, 34, 87–98. doi: 10.1016/j.cpr.2013.12.002 [DOI] [PubMed] [Google Scholar]
- Suar D, Das N, & Hota LB (2010). Social indicators affecting post-tsunami trauma of survivors. Journal of Health Management, 12, 483–500. doi: 10.1177/097206341001200405 [DOI] [Google Scholar]
- Swendsen JD, & Merikangas KR (2000). The comorbidity of depression and substance use disorders. Clinical Psychological Review, 20, 173–189. doi: 10.1016/S0272-7358(99)00026-4 [DOI] [PubMed] [Google Scholar]
- Thompson RJ, Mata J, Jaeggi SM, Buschkuehl M, Jonides J, & Gotlib IH (2012). The everyday emotional experience of adults with major depressive disorder: Examining emotional instability, inertia, and reactivity. Journal of Abnormal Psychology, 121, 819–829. doi: 10.1037/a0027978 [DOI] [PMC free article] [PubMed] [Google Scholar]
- Treynor W, Gonzalez R, & Nolen-Hoeksema S (2003). Rumination reconsidered: A psychometric analysis. Cognitive Therapy and Research, 27, 247–259. doi: 10.1023/A:1023910315561 [DOI] [Google Scholar]
- Triandis HC (1993). Collectivism and individualism as cultural syndromes. Cross-cultural research, 27, 155–180. [Google Scholar]
- Tummala-Narra P (2007). Conceptualizing trauma and resilience across diverse contexts: A multicultural perspective. Journal of Aggression, Maltreatment & Trauma, 14, 33–53. doi: 10.1300/J146v14n01_03 [DOI] [Google Scholar]
- Varma D, Chandra PS, Thomas T, & Carey MP (2007). Intimate partner violence and sexual coercion among pregnant women in India: Relationship with depression and post-traumatic stress disorder. Journal of Affective Disorders, 102, 227–235. doi: 10.1016/j.jad.2006.09.026 [DOI] [PMC free article] [PubMed] [Google Scholar]
- Venkateshan M, & Roy D (2016). Prevalence, Socio-demographic & Quality of Life (QOL) correlatesof Post-Traumatic Stress Disorder (PTSD) among Disaster victims of Uttarakhand. University Medical Journal, 1, 26–30. [Google Scholar]
- Vermunt JK (2010). Latent class modeling with covariates: Two improved three-step approaches. Political Analysis, 18, 450–469. doi: 10.1093/pan/mpq025 [DOI] [Google Scholar]
- Villagran MM, & Lucke JF (2005). Translating communication measures for use in non-English-speaking populations. Communication Research Reports, 22, 247–251. doi: 10.1080/00036810500230743 [DOI] [Google Scholar]
- Weathers F, Blake D, Schnurr P, Kaloupek D, Marx B, & Keane T (2013). The life events checklist for DSM-5 (LEC-5). Instrument available from the National Center for PTSD; at www.ptsd.va.gov. [Google Scholar]
- Weathers FW, Litz BT, Keane TM, Palmieri PA, Marx BP, & Schnurr PP (2013). The PTSD Checklist for DSM-5 (PCL-5). Scale available from the National Center for PTSD; at www.ptsd.va.gov. [Google Scholar]
- Wortmann JH, Jordan AH, Weathers FW, Resick PA, Dondanville KA, Hall-Clark B, … Litz BT (2016). Psychometric analysis of the PTSD Checklist-5 (PCL-5) among treatment-seeking military service members. Psychological Assessment, 28, 1392–1403. doi: 10.1037/pas0000260 [DOI] [PubMed] [Google Scholar]
- Ying LH, Wu XC, & Lin CD (2012). Longitudinal linkages between depressive and posttraumatic stress symptoms in adolescent survivors following the Wenchuan earthquake in China: A three-wave, cross-lagged study. School Psychology International, 33, 416–432. doi: 10.1177/0143034311421271 [DOI] [Google Scholar]
- Yudko E, Lozhkina O, & Fouts A (2007). A comprehensive review of the psychometric properties of the Drug Abuse Screening Test. Journal of Substance Abuse Treatment, 32, 189–198. doi: 10.1016/j.jsat.2006.08.002 [DOI] [PubMed] [Google Scholar]
- Zhang Z, Abarda A, Contractor AA, Wang J, & Dayton CM (2018). Exploring heterogeneity in clinical trials with latent class analysis. Annals of Translational Medicine, 6(7), 119. doi: 10.21037/atm.2018.01.24 [DOI] [PMC free article] [PubMed] [Google Scholar]
- Zhen R, Quan L, & Zhou X (2018). Co-occurring patterns of post-traumatic stress disorder and depression among flood victims: A latent profile analysis. . Journal of Health Psychology. doi: 10.1177/1359105318763505 [DOI] [PubMed] [Google Scholar]