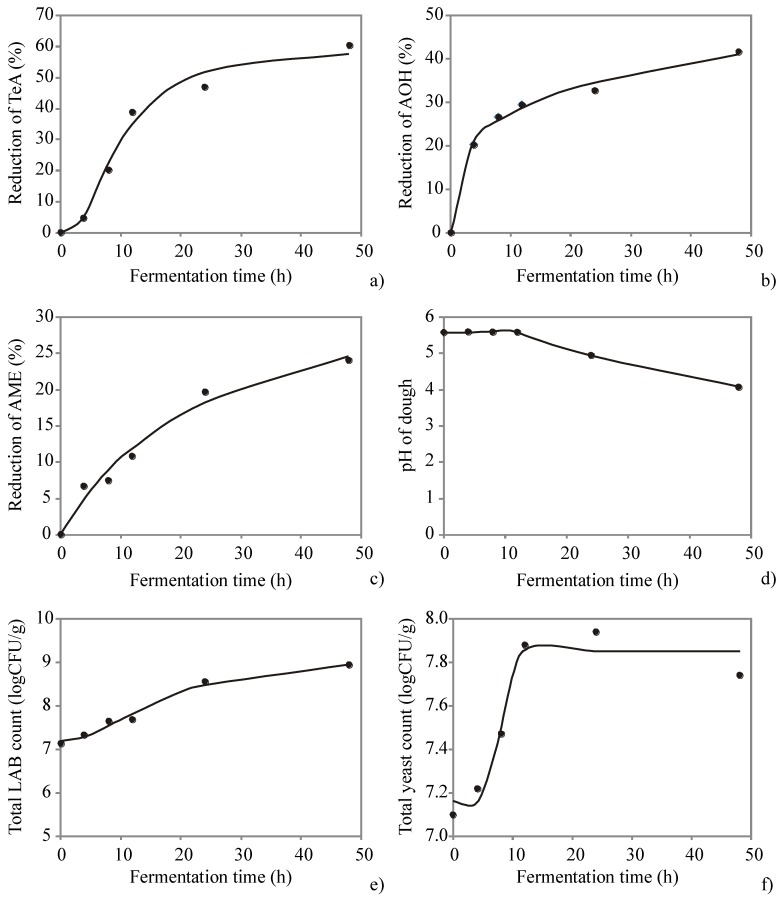
Figure 1.
Resulting plots for the model of the leavening process of doughs: (a) reduction of tenuazonic acid (TeA), (b) reduction of alternariol (AOH), (c) reduction of alternariol monomethyl ether (AME), (d) pH of the dough during the process, (e) total lactic acid bacteria (LAB) count, (f) total yeast count.

