Abstract
Study Objectives:
Obstructive sleep apnea (OSA) is a respiratory disorder caused by the obstruction of the upper airway during sleep. The identification of the primary site of OSA is essential to determine treatment strategy. This study aimed to establish computational fluid dynamics (CFD) analysis for determining the clinical severity of OSA and the primary site of OSA.
Methods:
Twenty children (mean age, 6 years) were divided into OSA and control groups according to their apnea-hypopnea index. Three-dimensional airways were constructed from computed tomography data. The pharyngeal airway morphology and the pressure and velocity of the upper airway were evaluated using CFD analysis.
Results:
The maximum velocity and negative pressure of the upper airway in the OSA group were significantly correlated with the severity of OSA (rs = .741, P < .001; rs = −.653, P = .002). A velocity higher than 12 m/s indicated the primary site of OSA. In addition, we found that the primary site of OSA is not necessarily the same as the collapsible conduit site.
Conclusions:
CFD analysis allows both the evaluation of the disease severity of OSA and the identification of the primary site of OSA in children. The primary site of OSA is not necessarily the same as the collapsible conduit site; therefore, CFD analysis can be used to identify the appropriate intervention for treating OSA.
Citation:
Yanagisawa-Minami A, Sugiyama T, Iwasaki T, Yamasaki Y. Primary site identification in children with obstructive sleep apnea by computational fluid dynamics analysis of the upper airway. J Clin Sleep Med. 2020;16(3):431–439.
Keywords: airway negative pressure, airway velocity, children, computed fluid dynamics, obstruction site, obstructive sleep apnea, primary site
BRIEF SUMMARY
Current Knowledge/Study Rationale: Identifying the primary site of obstructive sleep apnea (OSA) in children is important to determine treatment strategies; however, current methods and the corresponding treatment of children with OSA are inadequate.
Study Impact: This study demonstrated the efficacy of using computed fluid dynamics in identifying the primary site of OSA, which may differ from the site where obstruction is observed. Computed fluid dynamics may, therefore, be useful to determine the treatment of OSA in children.
INTRODUCTION
Obstructive sleep apnea (OSA) is a respiratory disorder caused by the obstruction of the upper airway during sleep.1 The incidence rate of OSA in children is approximately 3%.2 Previous studies have associated OSA in children with aberrant cognitive function and behavior: developmental delay, decline in academic performance, attention deficit hyperactivity disorder, and aggressive comportment.3 Hypertrophy of the adenoid and the palatine tonsils occurs at approximately 4 to 7 years of age, and OSA often originates in these sites. Therefore, according to the International Classification of Sleep Disorders, Third Edition,4 adenotonsillectomy (AT) should be performed as the first-line treatment of pediatric OSA. However, surgical treatment is performed without correctly identifying the primary site of OSA; therefore, a significant number of patients are left with persistent OSA after AT.
To identify the site of airway obstruction, various methods are clinically applied; these include cephalograms, computed tomography (CT), magnetic resonance imaging (MRI), and endoscopy.5 However, these methods only provide two-dimensional data of a relatively simple three-dimensional (3D) form and cannot, therefore, evaluate the condition of upper airway ventilation. Luo et al6 have recently performed a study using computational fluid dynamics (CFD) analysis, which evaluates the condition of ventilation by reproducing air flow through a 3D model of the upper airway. Wootton et al7 determined that the decrease in pressure from the choana to the trachea correlates with the apnea-hypopnea index (AHI, severity of OSA determined with MRI) of 13.3-year-old children with OSA and obesity (rs = .48, P < .01). These studies provide evidence for the utility of CFD analysis.6,8 However, studies have not evaluated the ventilation condition of all the parts of the varied whole upper airway, including the precise nasal airway of children. Therefore, CFD analysis is yet to be used for the identification of the primary site of OSA or to determine treatment strategies. We hypothesized that CFD-evaluated values of the upper airway are not only associated with the severity of OSA but also possibly help identify the primary site of OSA; we tested this hypothesis by conducting a comprehensive evaluation of the pressure and velocity of each upper airway site.
METHODS
Twenty pediatric patients (16 boys) who were treated at a national university hospital (Yamanashi, Japan) for OSA were included in this retrospective study. The inclusion criteria were as follows: age of 4 to 8 years; availability of polysomnography (PSG) and CT data, which were acquired for diagnosis (to minimize radiation exposure, we performed the scans only when the diagnostic benefits outweighed the risks of radiation exposure); and a craniocervical inclination of 95° to 105°. The exclusion criteria were as follows: craniofacial or growth abnormalities, and history of tonsillectomy or adenoidectomy and treatment for systematic disease. The children were divided into two groups according to their AHI scores: OSA group (8 boys and 2 girls; AHI > 5 events/h; mean age, 6.0 ± 1.4 years; mean body mass index [BMI], 15.21 kg/m2 [BMI percentile value,9 40.25 ± 33.71%ile]) and control group (8 boys and 2 girls; AHI < 5 events/h; mean age, 6.8 ± 1.4 years; mean BMI, 17.93 kg/m2 [BMI percentile value,9 63.90 ± 30.33%ile]). The two groups of patients were approximately matched for age and sex. PSG and CT were performed to diagnose OSA and inspect patients with OSA. This study was approved by the institutional review board of Kagoshima University, Japan, (180073 (657) Epi-ver. 1) and Yamanashi University, Japan (1594); due to the study’s retrospective nature, the need for obtaining informed consent was waived.
Polysomnography
All the patients had available PSG (PSG-1100, Nihon Kohden, Japan) data, which were used to measure AHI. Apnea was defined as the complete cessation of airflow for 10 seconds, and hypopnea was defined as a 50% reduction in oronasal airflow for 10 seconds with at least 3% desaturation. AHI was calculated as the number of apnea and hypopnea events per hour of sleep.10
CT scan evaluation methods
CT equipment (Aquilion ONE, Toshiba, Japan) was set to a voxel dimension of 0.401 mm. Scanning was performed while patients were in the supine position. Each patient was asked not to move his/her head, to hold his/her breath at the end of expiration without swallowing, and to maintain centric occlusion with a relaxed tongue and lips following expiration during the CT scan. CT examination is not routinely performed; the patients that needed further examination underwent this examination. We performed the following evaluation on the basis of the acquired CT images:
Morphologic evaluation of the pharyngeal airway
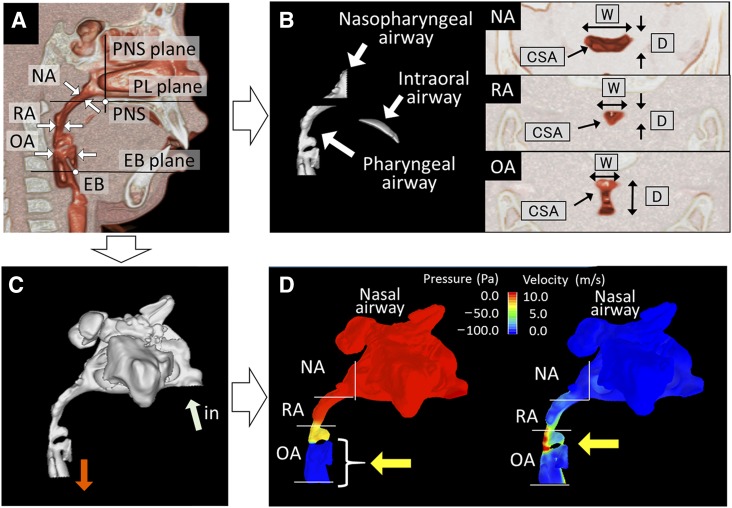
Volume-rendering software (INTAGE Volume Editor; Cybernet Systems, Tokyo, Japan) was used to create 3D images and to thereby evaluate the cross sections and volumes of the pharyngeal airway11 (Figure 1). The cross-sections of the nasopharyngeal, retropalatal, and oropharyngeal airways (NA, RA, and OA, respectively) and the volumes of the NA, pharyngeal airway, and intraoral airway were measured. Airway cross-sectional measurements included the cross-sectional area (CSA), depth (anteroposterior), and width (left-right). Minimum cross sections were defined as the narrowest horizontal sections in the NA, RA, and OA. The intraoral airway was defined as the space between the palate and the tongue.
Figure 1. Measurement of the upper airway.
(A) Landmarks and planes for the axial airway section. EB = base of the epiglottis, EB plane = the plane parallel to the PL plane passing through the EB, NA = nasopharyngeal airway cross section measured at its narrowest part, OA = oropharyngeal airway cross section measured along the PL plane passing through the midpoint of the bilateral gonion, PL plane = the plane parallel to the hard palate passing through the PNS, PNS = posterior nasal spine, PNS plane = the plane perpendicular to the hard palate passing through the PNS, RA = retropalatal airway cross section measured parallel to the PL plane at the narrowest part. (B) Measurement of airway volumes and cross sections. Nasopharyngeal airway volume between the PNS and PL planes. Intraoral airway volume between the palate and the tongue. Pharyngeal airway volume between the PL and EB planes. CSA = cross-sectional area, D = depth, W = width. (C) Volume rendering and numeric simulation of the three-dimensional upper airway (light blue arrow, inlet air flow; orange arrow, outlet air flow). (D) Evaluation of the upper airway ventilation condition. Left: yellow arrow indicates area of large negative pressure suspected as the site of pharyngeal airway collapse. Right: yellow arrow indicates area of higher velocity suspected as the obstruction site.
Functional evaluation of the upper airway
The 3D nasal airway was manually generated from CT data using volume-rendering software (INTAGE Volume Editor; Cybernet Systems, Tokyo, Japan).12,13 The airway was segmented primarily on the basis of image intensity, with the threshold set midway between the soft tissue and clear airway values. Subsequently, using mesh-morphing software (DEP Mesh Works/Morpher; IDAJ, Kobe, Japan), the 3D model was smoothed without compromising the patient-specific pattern of the airway shapes. The models were exported to CFD software (PHOENICS; CHAM Japan, Tokyo, Japan) as stereo lithographic files. CFDs of the nasal airway models were analyzed using a volumetric flow rate of 12 mL/s/kg, assuming that the wall surface is nonslippery. Simulations were performed to estimate airflow pressure; air flowed horizontally from the choana, and it was exhaled through both external nares. The nasal airway resistance model conformed to postnasal rhinomanometry, and nasal resistance value was calculated from air mass flow and the difference in pressure between the external nares and the choana according to Ohm law.11 However, the nasal airway resistance values vary depending on the air threshold and the method of mesh-morphing employed during the construction of the airway model. We, therefore, regulated the construction of airway model so that the nasal airway resistance value obtained by the CFD analysis corresponded to the nasal resistance value derived from rhinomanometry. Simulations were repeated 1,000 times to generate mean values.
We then conducted an inspiration simulation of the upper airway (air flowing in the nares at a volumetric flow rate of 12 mL/s/kg) using a method similar to that employed for the nasal airway described earlier,14 and estimated the pressures and velocity in different parts of the upper airway (nasal airway, NA, RA, and OA). Inspiratory pressures in each part of the upper airway were indicated by negative values. The maximum velocity and negative pressure are defined as the largest values measured in the upper airway. We calculated the resistance of the upper airway from differences in flow quantity and pressure between the external naris and hypopharynx.
Statistical analysis
The data were statistically analyzed using SPSS (version 24.0, Chicago, Illinois). The t test and Mann-Whitney U test were used to compare differences in measurements between the OSA and control groups. Fisher exact test was used to elucidate the distribution of AHI and maximum velocity and negative pressure in both the groups. For all tests, a value of P < .05 was considered statistically significant. Considering our hypothesis that CFD analysis of the upper airway would be a more sensitive correlate of OSA severity than morphologic analysis of the upper airway, we based a sample size calculation on the correlation between the upper airway pressure and AHI. On the basis of a previous study,6,8 the correlation coefficient was set to .60. With the significance and power having been set to .05 and .80, respectively, the correlation coefficient showed that the required sample size was 20. The results of correlation between the upper airway pressure and AHI confirmed the adequacy of the current sample size. All measurements were repeated after 1 week by the same investigator (T.I.), and Dahlberg formula was used to calculate the measurement error15: for the airway depth, width, CSA, pressure, and velocity the values of measurement error were 0.065 mm, 0.052 mm, 1.451 mm2, 0.712 Pa, and 0.057 m/s, respectively. These analyses suggested that the method errors were negligible.
RESULTS
Pharyngeal airway morphology
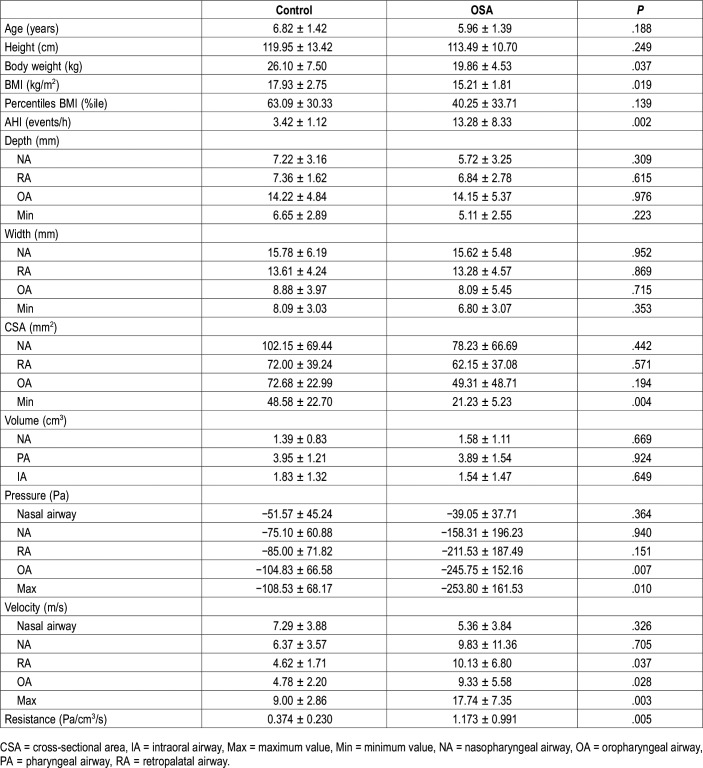
Among the various morphologic features studied, only the minimum CSA was significantly smaller in the OSA group than in the control group (P = .004) (Table 1). The others (airway depth, width, CSA, and airway volume) were not significantly different between the two groups.
Table 1.
Morphologic and functional evaluation of the upper airway.
Condition of upper airway ventilation
In the OSA group, the negative pressure difference from the external nares to the base of the epiglottis was −253.80 Pa (Table 1). The OA and maximum airway pressures were significantly higher in the OSA group than in the control group (P = .007 and P = .010, respectively). Retropalatal, oropharyngeal, and maximum airway velocity were significantly higher in the OSA group than in the control group (P = .037, P = .028, and P = .003, respectively). The resistance was significantly higher in the OSA group than in the control group (P = .005).
Correlation to AHI
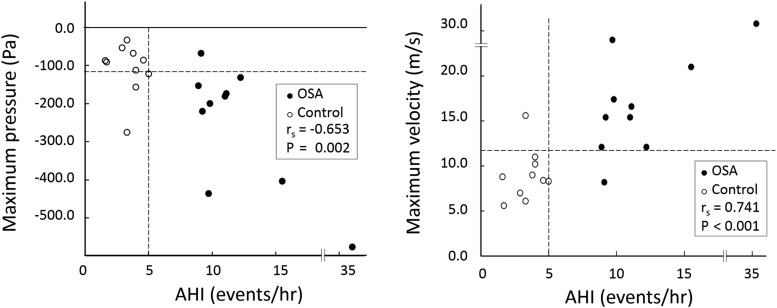
Other than a significant negative correlation between the minimum CSA and AHI (P = .028) (Table 2), no other negative correlations were found. On the contrary, with respect to the condition of the upper airway, both OA and maximum pressures were significantly negatively correlated with AHI (rs = −.674, P = .001; rs = −.653, P = .002, respectively) (Table 2, Figure 2). Nine of the 10 children with OSA exhibited a maximum negative pressure of < −120 Pa, whereas 7 of the 10 control patients had a maximum negative pressure of > −120 Pa. Consequently, the distributions of negative pressure (< −120 Pa) significantly differed between the two groups (P = .010). Furthermore, the RA, OA, and maximum velocities featured significant positive correlations with AHI and the correlation between the maximum velocity and AHI was the strongest (rs = .741, P < .001) (Figure 2). Nine of the 10 children with OSA showed a maximum velocity > 12 m/s, and 9 of the 10 control children exhibited a maximum velocity < 12 m/s. Consequently, the distributions of velocities > 12 m/s significantly differed between the two groups (P = .001).
Table 2.
Pearson and Spearman correlation coefficients between apnea-hypopnea index and each variable.
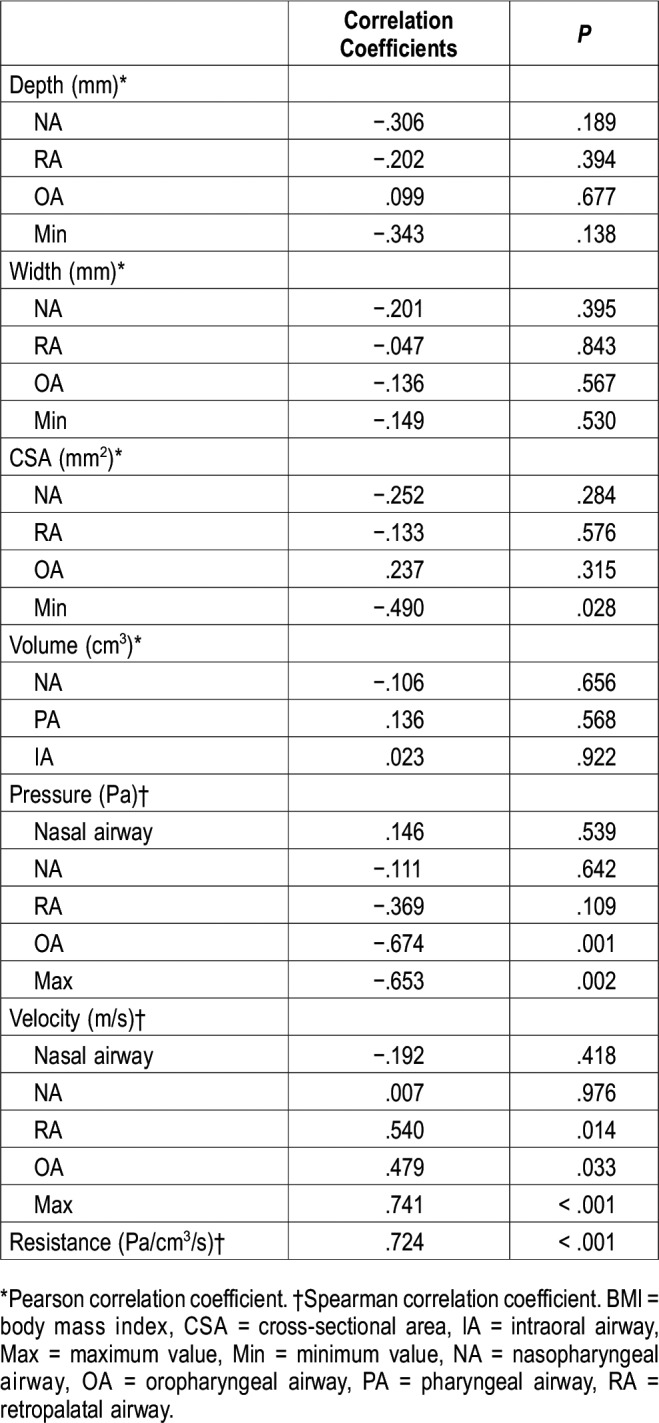
Figure 2. Distribution of AHI and maximum negative pressure and maximum velocity in the OSA and control groups.
Left: distribution of AHI and maximum negative pressure. The correlation of maximum negative pressure with AHI (rs) is shown (rs = −.653, P = .002). White markers indicate control data (AHI < 5 events/h); black markers, OSA data (AHI > 5 events/h). Right: distribution of AHI and maximum velocity. The correlation between maximum velocity and AHI (rs) was very strong (rs = .741, P < .001) and allowed the use of 12 m/s as a demarcation between the OSA and control groups. AHI = apnea-hypopnea index, OSA = obstructive sleep apnea.
Pressure and velocity
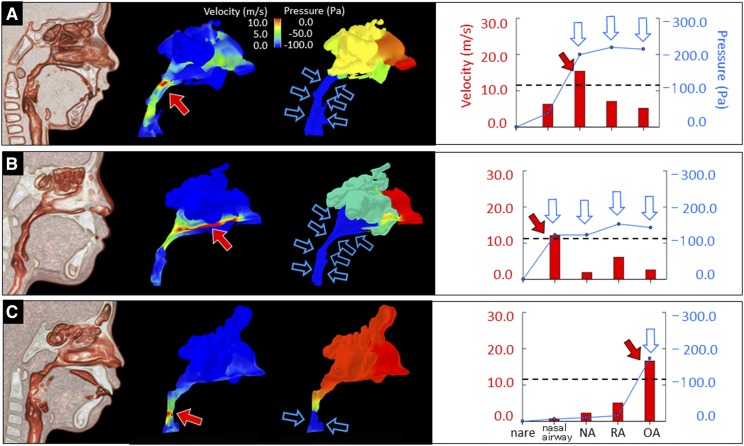
Various primary sites of velocities > 12 m/s were identified; in some cases of OSA, multiple sites were observed (Table 3). Multiple cases have shown that a rapid decrease in pressure occurs in the narrow region of the upper airway during inspiration7 (Figure 3). As cross-sectional area decreases, airflow velocity increases. Downstream of the site with minimum CSA, which is a primary site, a modest rise in the negative pressure is usually observed, regardless of the air velocity of the site (Figure 3, Table 3). This downstream large negative pressure is usually observed at the lower site of the upper airway, which becomes an obstruction site.
Table 3.
The distribution of primary site and collapsible conduit site that are expected in our study.
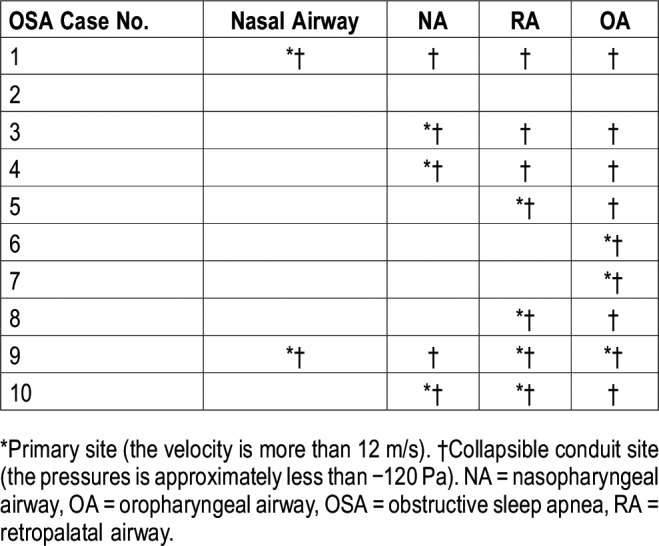
Figure 3. Relationship between pressure and velocity in children with OSA.
(A) In case 1, we simulated a high velocity (around 15.4 m/s, red arrow) and a large negative pressure in the NA (blue arrow). The negative pressures at the downstream sites (RA and OA) remained large; however, the velocities at these sites were low (blue arrows). (B) In case 2, we simulated a high velocity in the nasal airway (around 12 m/s, red arrow) and a large negative pressure in the nasal airway (blue arrows). The velocities at downstream sites (NA, RA, and OA) were slow, although the negative pressures at such sites remain large (blue arrow). (C) In case 3, we simulated a high velocity in the OA (around 16.6 m/s, red arrow) and a large negative pressure in the OA (blue arrow). The case featured matched velocity and pressure grades at each area (blue arrow). NA = nasopharyngeal airway, OA = oropharyngeal airway, RA = retropalatal airway.
Relationship between pressure and velocity of each site
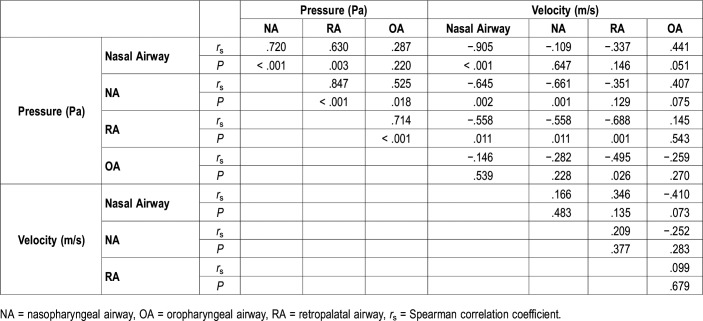
Nasal, nasopharyngeal, and retropalatal airway pressures featured significant negative correlations with velocity at the same sites (Table 4); upstream of these sites, this correlation persisted. After negative pressure had increased at the obstruction site, it remained high even if the velocity was lower downstream of the site (Table 4, Figure 3). Regarding associations among negative pressures, those at and upstream of the primary site were significantly correlated. Regarding associations among velocities, no significant correlations were observed among any of the sites.
Table 4.
Relationship between pressure and velocity.
CSA and pressure and velocity
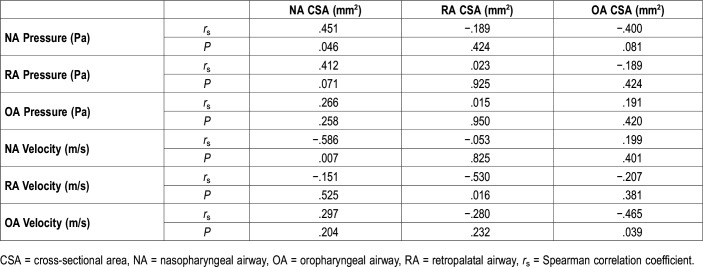
Significant correlations were observed between the CSA and velocity of each site (Table 5). Furthermore, CSA and pressure of NA were significantly correlated; however, no significant correlations were observed between the CSA and pressure at any other site.
Table 5.
Relationship between cross-sectional area and pressure and velocity.
DISCUSSION
The current study determined whether performing CFD analysis of an upper airway 3D model could identify the primary site of OSA in children. The CFD of the condition of the upper airway ventilation in children with OSA revealed not only the negative pressure-induced severity of OSA of the upper airway but also the primary site of OSA induced by the increased air velocity. In addition, we showed that the primary site of OSA was not necessarily the same as the collapsible conduit site.
Pressure
Wootton et al7 studied the condition of upper airway ventilation in girls with OSA and obesity using CFD analysis and reported that the pressure difference from the choana to the trachea was 229.4 Pa; we found this difference in pressure to be 206.70 Pa. Although the age and the BMI of the participants of the study conducted by Wootton et al differed from those of the current study, the data collected on pressure via CFD analysis were similar. On the contrary, another CFD study reported that the upper airway conductance of 6-year-old children with OSA was a third of that of children in the control group.16 Our study observed the upper airway resistance of the OSA group (1.173 ± 0.991 Pa/cm3/s) to be three times that of the control group (0.374 ± 0.230 Pa/cm3/s). Therefore, the conductance of the OSA group was one-third that of the control group because conductance is the reciprocal of resistance. The pressure values reported herein as well as those reported by other studies validated the present results.7,16 Kobayashi et al17 reported the normal nasal airway resistance of elementary school children to be 0.35 ± 0.17 Pa/cm3/s. The current study defined airway obstruction as 0.5 Pa/cm3/s, which corresponds to a resistance level equivalent to −120 Pa according to our flow quantity settings. We, therefore, concluded that obstruction occurs when negative pressure exceeds −120 Pa.
Pressure and AHI
Our study demonstrated a strong correlation between maximum pressure and AHI. Van Holsbeke et al16 reported that CFD-based parameters correlated more strongly with OSA severity than morphologic parameters. The results presented herein show a similar tendency. Arens et al1 reported that changes in upper airway CSA during tidal breathing are larger in children with OSA and that maximal narrowing will occur during inspiration when more negative intraluminal pressures are present. Previous reports indicate that the upper airway dilator muscle relaxes during sleep and that inspiratory negative pressure shrinks the pharyngeal airway to a greater degree during sleep than when awake1; this narrowing of the pharyngeal airway may lead to obstruction of ventilation, further suggesting a weak correlation between the CSA of the pharyngeal airway when awake and AHI. We, therefore, concluded that airway negative pressure greatly contributes to the severity of OSA.
Velocity
In the current study, the CFD-evaluated maximum velocity was higher in the OSA group than in the control group. The lack of associations among the velocities of different sites was ascribed to the strong influence of the CSA on the velocity of the same site.7 Wootton et al7 reported that the velocities of the upper airway in the CFD are inversely proportional to the CSA of the pharyngeal airway.
Similarly, our study found a significant negative correlation between the CSA and velocity at any given site along the pharyngeal airway (rs = −.465 to −.586). Furthermore, the correlation between maximum velocity and AHI was strong, suggesting that the CFD-evaluated maximum velocity could be used to evaluate the entire upper airway: from the nasal airway to the hypopharynx.14 With regard to the relationship between the airway CSA and ventilation obstruction, Warren et al18 reported that adults engage in mouth breathing when the nasal airway CSA becomes 0.40 cm2 or lower; furthermore, this study reported that a flow quantity of 450 mL/s corresponds to a velocity of 11.3 m/s.18,19 Wootton et al7 reported that the airway velocity from the choana to the trachea in 13-year-old children with OSA was 15.4 ± 10.0 m/s, whereas that of the children in the control group was 8.1 ± 5.7 m/s. Furthermore, the data distributions of AHI and the corresponding maximum velocities indicate that a velocity of 12 m/s differentiates children with OSA from those in the control group (Figure 2). Regarding the 12 m/s threshold velocity used to differentiate the control group from the OSA group and subsequently, to determine the primary site, the significance of this value was reported as P (.001). Thus, our own findings in conjunction with those of prior studies suggest that velocities ≥ 12 m/s indicate an obstruction site.7,18,19 Because the velocities of each upper airway site could be evaluated by CFD analysis,14 we were able to identify the suspected site of obstruction.
Furthermore, we found that the primary site varied from case to case (Table 4, Figure 3). The guidelines on the treatment of OSA in children reported the adenoid and palatine tonsils as the primary sites,2 and AT has, therefore, been performed as the first-line treatment. However, a significant proportion of patients are left with persistent OSA after AT,2 which is likely due to other risk factors that are associated with OSA in children.20,21 On the basis of CFD analysis of AT cases, Luo et al6 reported that 3 of 10 patients with OSA did not respond to AT, indicating that sites other than the adenoid and palatine tonsils could cause OSA. Our results indicate that the NA is affected by the adenoid, whereas the RA and OA are affected by the palatine tonsils; thus, judging from the velocity distributions among our study participants, our findings indicate that 7 of 10 patients would respond to AT (Table 3); these include NA as well as RA and OA obstructions thought to be caused by the adenoid and palatine tonsils, respectively. Hence, the three cases that were not expected to respond to AT are thought to originate because of obstruction in sites other than the adenoid and/or palatine tonsils. These incidences are similar to those that have been previously reported.6 The consistency between our study and that performed by Luo et al6 demonstrates the effectiveness of using the CFD-evaluated velocity in identifying the treatment site and suggesting the possibility of individualizing treatment for patients with OSA.
Pressure and velocity
Our study showed that maximum velocity is correlated with not only the large negative pressure of the same site but also with the large negative pressure of the downstream site (Table 4), indicating that major negative pressure originating from an area below the primary site collapses the airway. When the airway accepts the shrinking site in strong negative pressure, this indicates that the primary site may be above the shrinkage site.12 In brief, the primary site may differ from the obstruction site.
Donnelly suggests the possibility that negative pressure induced by the inspiration of the posterior nasal pharynx is associated with secondary collapse in the retroglossal airway.22 Our study indicated that secondary collapse is more likely to occur at sites of large negative pressure and low velocity downstream of the site of obstruction (Table 4, Figure 3). From these findings, even if the collapsible conduit site was detected by video diagnosis, endoscopy, or sleep MRI, the detected site of collapsible conduit may not be the primary site of the obstruction. In that case, the patient may not respond to treatment of the collapsible conduit site. Although many methods to detect the obstruction site(s) of the upper airway have been suggested,5 their efficacy has been insufficient on account of potential misidentification of the primary site as the site where a stenosis or obstruction occurred.
Morphologic measurement
The morphologic characteristics of the airways in children with OSA were only revealed through the minimum CSA. Numerous other morphologic studies have been conducted on the CSA of airways in children with OSA.1,16,23 Van Holsbeke et al16 reported that the minimum CSA of 6-year-old children with OSA is 17.9 mm2; similarly, our study found that the minimum CSA of patients with OSA was 21.23 mm2. Both findings indicate that CFD-evaluated results are more strongly correlated with OSA disease severity than with CSA.16
This study is subject to several limitations. The sample size was small, and ethical considerations rendered it impossible to use healthy children (AHI < 1 event/h) as control patients (AHI = 3.42 events/h). However, our study was able to characterize the airflow properties of children with OSA. This study was performed with CFD analysis of the rigid model constructed using data obtained while the participants were awake. However, these data may still be of use because even these CFD-evaluated values were found to be correlated with AHI.6,16 However, further research comparing the patient outcomes following treatment of the primary site detected by CFD analysis is warranted to confirm the efficacy of CFD analysis in identifying the primary site of OSA.
Clinical implications
Because treatment of OSA varies according to its primary site, the accurate identification of the primary site is crucial for securing optimal patient outcomes. However, the accuracies of detection methods used until now have demonstrated inefficiency in determining the exact primary site of OSA. The current study concluded that CFD analysis is effective for the identification of the primary site of OSA.
CONCLUSIONS
This study sought to establish a specific method to identify the primary site of OSA by using CFD analysis. We found that areas with velocities of more than 12 m/s indicated the primary site. Furthermore, this study demonstrated, using CFD analysis, that the site of primary flow limitation (which is the primary site) may differ from sites of airway collapse, which are driven by secondary airflow effects. CFD analysis may, therefore, be more useful than techniques that simply observe sites of obstruction or collapse. Data obtained from CFD analysis may thus help identify the appropriate intervention for treating OSA.
ABBREVIATIONS
- AHI
apnea-hypopnea index
- AT
adenotonsillectomy
- BMI
body mass index
- CFD
computational fluid dynamics
- CSA
cross-sectional area
- CT
computed tomography
- MRI
magnetic resonance imaging
- NA
nasopharyngeal airway
- OA
oropharyngeal airway
- OSA
obstructive sleep apnea
- PSG
polysomnography
- RA
retropalatal airway
DISCLOSURE STATEMENT
All authors have seen and approved the manuscript. This work was supported by Grants-in-Aid for Scientific Research (KAKENHI) from the Japan Society for the Promotion of Science (JSPS) (17K11965 and 18K09860). The authors report no conflicts of interest.
REFERENCES
- 1.Arens R, Sin S, McDonough JM, et al. Changes in upper airway size during tidal breathing in children with obstructive sleep apnea syndrome. Am J Respir Crit Care Med. 2005;171(11):1298–1304. doi: 10.1164/rccm.200411-1597OC. [DOI] [PMC free article] [PubMed] [Google Scholar]
- 2.Marcus CL, Brooks LJ, Draper KA, et al. Diagnosis and management of childhood obstructive sleep apnea syndrome. Pediatrics. 2012;130(3):e714–e755. doi: 10.1542/peds.2012-1672. [DOI] [PubMed] [Google Scholar]
- 3.Donnelly LF, Casper KA, Chen B, Koch BL. Defining normal upper airway motion in asymptomatic children during sleep by means of cine MR techniques. Radiology. 2002;223(1):176–180. doi: 10.1148/radiol.2231011023. [DOI] [PubMed] [Google Scholar]
- 4.Sateia MJ. International classification of sleep disorders-third edition: highlights and modifications. Chest. 2014;146(5):1387–1394. doi: 10.1378/chest.14-0970. [DOI] [PubMed] [Google Scholar]
- 5.Stuck BA, Maurer JT. Airway evaluation in obstructive sleep apnea. Sleep Med Rev. 2008;12(6):411–436. doi: 10.1016/j.smrv.2007.08.009. [DOI] [PubMed] [Google Scholar]
- 6.Luo H, Sin S, McDonough JM, Isasi CR, Arens R, Wootton DM. Computational fluid dynamics endpoints for assessment of adenotonsillectomy outcome in obese children with obstructive sleep apnea syndrome. J Biomech. 2014;47(10):2498–2503. doi: 10.1016/j.jbiomech.2014.03.023. [DOI] [PMC free article] [PubMed] [Google Scholar]
- 7.Wootton DM, Luo H, Persak SC, et al. Computational fluid dynamics endpoints to characterize obstructive sleep apnea syndrome in children. J Appl Physiol. 2014;116(1):104–112. doi: 10.1152/japplphysiol.00746.2013. [DOI] [PMC free article] [PubMed] [Google Scholar]
- 8.Wootton DM, Sin S, Luo H, et al. Computational fluid dynamics upper airway effective compliance, critical closing pressure, and obstructive sleep apnea severity in obese adolescent girls. J Appl Physiol. 2016;121(4):925–931. doi: 10.1152/japplphysiol.00190.2016. [DOI] [PMC free article] [PubMed] [Google Scholar]
- 9.Tokumura M, Nanri S, Kimura K, Tanaka T, Fujita H. Height-specific body mass index reference curves for Japanese children and adolescents 5-17 years of age. Pediatr Int. 2004;46(5):525–530. doi: 10.1111/j.1442-200x.2004.01949.x. [DOI] [PubMed] [Google Scholar]
- 10.Kushida CA, Efron B, Guilleminault C. A predictive morphometric model for the obstructive sleep apnea syndrome. Ann Intern Med. 1997;127(8 Pt 1):581–587. doi: 10.7326/0003-4819-127-8_part_1-199710150-00001. [DOI] [PubMed] [Google Scholar]
- 11.Iwasaki T, Sato H, Suga H, et al. Relationships among nasal resistance, adenoids, tonsils, and tongue posture and maxillofacial form in Class II and Class III children. Am J Orthod Dentofacial Orthop. 2017;151(5):929–940. doi: 10.1016/j.ajodo.2016.10.027. [DOI] [PubMed] [Google Scholar]
- 12.Iwasaki T, Takemoto Y, Inada E, et al. The effect of rapid maxillary expansion on pharyngeal airway pressure during inspiration evaluated using computational fluid dynamics. Int J Pediatr Otorhinolaryngol. 2014;78(8):1258–1264. doi: 10.1016/j.ijporl.2014.05.004. [DOI] [PubMed] [Google Scholar]
- 13.Iwasaki T, Suga H, Yanagisawa-Minami A, et al. Upper airway evaluation of children with unilateral cleft lip and palate using computational fluid dynamics. Am J Orthod Dentofacial Orthop. 2019;156(2):257–265. doi: 10.1016/j.ajodo.2018.09.013. [DOI] [PubMed] [Google Scholar]
- 14.Iwasaki T, Saitoh I, Takemoto Y, et al. Evaluation of upper airway obstruction in Class II children with fluid-mechanical simulation. Am J Orthod Dentofacial Orthop. 2011;139(2):e135–e145. doi: 10.1016/j.ajodo.2010.08.014. [DOI] [PubMed] [Google Scholar]
- 15.Dahlberg G. Statistical Methods for Medical and Biological Students. London, UK: Allen and Unwin, Ltd; 1940. [Google Scholar]
- 16.Van Holsbeke C, Vos W, Van Hoorenbeeck K, et al. Functional respiratory imaging as a tool to assess upper airway patency in children with obstructive sleep apnea. Sleep Med. 2013;14(5):433–439. doi: 10.1016/j.sleep.2012.12.005. [DOI] [PubMed] [Google Scholar]
- 17.Kobayashi R, Miyazaki S, Karaki M, et al. Measurement of nasal resistance by rhinomanometry in 892 Japanese elementary school children. Auris Nasus Larynx. 2011;38(1):73–76. doi: 10.1016/j.anl.2010.06.002. [DOI] [PubMed] [Google Scholar]
- 18.Warren DW, Hairfield WM, Seaton D, Morr KE, Smith LR. The relationship between nasal airway size and nasal-oral breathing. Am J Orthod Dentofacial Orthop. 1988;93(4):289–293. doi: 10.1016/0889-5406(88)90158-8. [DOI] [PubMed] [Google Scholar]
- 19.Warren DW. Nasal airway measurements. Am J Orthod Dentofacial Orthop. 1988;93(5):443–445. doi: 10.1016/0889-5406(88)90109-6. [DOI] [PubMed] [Google Scholar]
- 20.Manickam PV, Shott SR, Boss EF, et al. Systematic review of site of obstruction identification and non-CPAP treatment options for children with persistent pediatric obstructive sleep apnea. Laryngoscope. 2016;126(2):491–500. doi: 10.1002/lary.25459. [DOI] [PubMed] [Google Scholar]
- 21.Boudewyns A, Abel F, Alexopoulos E, et al. Adenotonsillectomy to treat obstructive sleep apnea: is it enough? Pediatr Pulmonol. 2017;52(5):699–709. doi: 10.1002/ppul.23641. [DOI] [PubMed] [Google Scholar]
- 22.Donnelly LF. Magnetic resonance sleep studies in the evaluation of children with obstructive sleep apnea. Semin Ultrasound CT MR. 2010;31(2):107–115. doi: 10.1053/j.sult.2009.12.001. [DOI] [PubMed] [Google Scholar]
- 23.Fregosi RF, Quan SF, Kaemingk KL, et al. Sleep-disordered breathing, pharyngeal size and soft tissue anatomy in children. J Appl Physiol. 2003;95(5):2030–2038. doi: 10.1152/japplphysiol.00293.2003. [DOI] [PubMed] [Google Scholar]


