Abstract
Background
Gastric cancer (GC) is the most common malignant tumor of the digestive tract and its molecular mechanism is not clear. HOXD9 plays an important role in tumor progression as transcription factor. In the current study, we explored the role of HOXD9 in GC.
Methods
We predicted the expression and potential mechanism of HOXD9 in GC through an online database. The expression of HOXD9 was detected in GC and adjacent tissues, and then we analyzed the relationship between HOXD9 and the prognosis of patients with GC. In vitro, we investigated the effects of HOXD9 on malignant biological behaviors such as proliferation, migration, and invasion of the GC cell line MCG-803. In addition, we have initially studied the underlying mechanism by Western blot.
Results
High expression of HOXD9 in GC was predicted by online database prediction and implied poor prognosis. In the clinical sample, we confirmed the above predictions. In vitro, we found that knockdown of HOXD9 could effectively inhibit the proliferation, migration, and invasion of GC cells. In terms of mechanism, HOXD9 may activate the TGF-β/Smad signaling pathway.
Conclusion
HOXD9 promotes the malignant biological process of GC, which may be a potential therapeutic target for GC.
Keywords: HOXD9, gastric cancer, prognosis, TGF-β/Smad pathway
Introduction
Gastric cancer (GC) is the most common malignant tumor of the digestive tract and the second leading cause of cancer-related death.1 According to statistics from 2018, annually, about approximately 1.033 million people are diagnosed with GC annually, and approximately 782,000 people die because of GC.2 In Europe and the United States, morbidity due to GC is gradually decreasing,3 while in East Asia, GC-related morbidity is the highest in the world. Furthermore, approximately half of the global cases of GC are in China.4 Compared to non-small cell lung cancer (NSCLC), GC lacks effective therapeutic targets. Tumor development involves the activation of oncogenes and the inactivation of tumor suppressor genes. Therefore, exploring the molecular mechanism of GC pathogenesis and identifying potential therapeutic targets are currently very important areas for research.
Homeobox (HOX) genes belong to the superfamily that participates in embryonic development and cell differentiation.5,6 The HOX-encoding protein, which serves as a highly conserved transcription factor, is an important regulatory factor of cellular biological behavior.7 The abnormal expression of HOX appears to play a crucial role in tumor progression, including translation, proliferation, angiogenesis, apoptosis, and migration.8 HOXD9 is one of the homeobox D cluster (HOXD) genes that is closest to the 3ʹ-terminus of the chromosome; HOXD9 is involved in the development of forelimb and axial skeleton.6 HOXD9 is strongly associated with the origin and development of numerous malignant tumors, such as ovarian cancer, esophageal cancer, glioma, and cervical cancer.9–12 However, the role of HOXD9 in GC has not yet been reported.
In this study, we predicted the expression of HOXD9 in GC using a bioinformatic online tool, which was verified in GC tissues and cells. We then constructed the HOXD9 knockdown cell model and analyzed its effect on the malignant biological behavior of GC cells. Finally, its potential action-mechanism was preliminarily explored.
Materials and Methods
Biological Information Analysis
Gene expression profile interaction analysis (GEPIA; http://gepia.cancer-pku.cn/) is an interactive network server that can evaluate mRNA expression levels in cancer and normal samples based on data from the Cancer Genome Atlas (TCGA) and the genotype tissue expression dataset project. GEPIA provides key interactive and customizable functions that include analysis of differential expression, plotting, correlation, patient survival, dimensionality reduction, and similar gene detection.13 The GEPIA online tool was employed to analyze the expression of HOXD9 in GC and normal samples.
The Kaplan-Meier plotter (http://kmplot.com/) online analysis tool was used to evaluate the effect of HOXD9 expression on the prognosis for GC patients. The Kaplan–Meier plotter is a commonly used web-based tool, which is utilized to evaluate the effect of a large number of genes on the survival of cancer patients based on databases such as TCGA. A total of 1440 GC samples are included in the Kaplan-Meier plotter database, and 205,604_at is the probe for analysis. The optimal cutoff value was automatically selected to divide GC patients into high and low HOXD9 expression groups. In addition, the hazard ratio together with the corresponding 95% confidence interval and the log-rank p-value were calculated; the level of significance was set at p < 0.05.
GSEA V2.2.3 software (www.broadinstitute.org/gsea) was employed to explore the potential mechanism of HOXD9 in the pathogenesis of GC. HOXD9 was divided into high expression and low expression groups. Subsequently, the Kyoto Encyclopedia of Genes and Genomes (KEGG) gene set was utilized for enrichment analysis.
Samples and Cell Culture
After obtaining informed consent from patients, a total of 120 surgical specimens, including cancer and para-carcinoma tissues, were collected from GC patients. These patients received surgical treatment at Zhongnan Hospital from January 2010 to December 2013. All patients were pathologically diagnosed as having GC and had not received radio-chemotherapy or immune therapy before surgery. The GC stage was determined according to the TNM classification system by the Union for International Cancer Control and the American Joint Committee on Cancer. Our study was approved by the Ethics Committee of Zhongnan Hospital of Wuhan University. Written informed consent was collected from all subjects and the study was conducted in accordance with the Declaration of Helsinki guidelines.
The GC cell lines AGS, MKN45, MGC-803, and SGC-7901, together with the normal gastric epithelial cell line GES-1, were purchased from Typical Culture Collection Committee Cell Bank of Chinese Academy of Sciences (Shanghai, China). The cells were cultured in Roswell Park Memorial Institute (RPMI) 1640 medium (Invitrogen; Thermo Fisher Scientific, Inc., Waltham, MA, USA) supplemented with 10% fetal bovine serum (FBS), 100 U/mL penicillin, and 100 mg/mL streptomycin. All cells were then incubated in a humidified 5% CO2 atmosphere at 37°C, and the medium was replaced every 3 days. After achieving 60–70% confluence, the cells were transferred to a 6-well plate, and small interfering RNA (siRNA) was used to suppress the expression of the target gene. The HOXD9 target sequence was GGACTCGCTTATAGGCCAT. Scrambled siRNA with no known gene sequence was used as the negative control. Lipofectamine 3000 (Invitrogen) was used for siRNA transfection according to the manufacturer’s protocol.
Immunohistochemistry
The tissue specimens were fixed, embedded in paraffin, and sectioned into 5 μm-thick sections. After de-waxing the sections, antigen retrieval was performed using citrate solution. Endogenous peroxidase was blocked using 5% normal goat serum. Subsequently, anti-HOXD9 antibody (1:100 dilution; Cambridge, MA, USA) was added as the primary antibody and incubated at 4°C overnight. The sections were then washed with phosphate-buffered saline and incubated with secondary antibody (goat anti-rabbit IgG, 1:500 dilution; Thermo Fisher Scientific, Inc.) for 30 min at room temperature. Finally, diaminobenzidine (DAB) staining and hematoxylin counter-staining were performed.
The slides were inspected by microscopy and interpreted by two independent pathologists. The staining scores, based on the number of positive tumor cells, were as follows: 0 point: <5%; 1 point: 5–24%; 2 points: 25–49%; and 3 points: 50–100%. The staining intensity scores were as follows: blank (0), weak (1), moderate (2) and strong (3). The semi-quantitative classification score of the HOXD9 protein expression level was determined according to the percentage of positively stained tumor cells and the staining intensity, with <4 indicating low expression and ≥4 indicating high expression.
Western Blot
Cells were lysed using the RIPA buffer (Beyotime, Shanghai, China) and protein was extracted. Protein concentration was determined using the BCA protein detection kit (Beyotime). Tissue specimens were first sufficiently ground using a mortar and the lysate was then subjected to sodium dodecyl sulfate-polyacrylamide gel electrophoresis. The resolved proteins were then transferred onto a polyvinylidene fluoride (PVDF) membrane (Millipore, Bedford, MA, USA). The membrane was then blocked using 5% skimmed milk and incubated with the anti-HOXD9 antibody (1:2000) at 4°C overnight, with glyceraldehyde 3-phosphate dehydrogenase (GAPDH; Multisciences, Hangzhou, China) as the internal reference. Subsequently, the membrane was incubated with goat anti-rabbit IgG secondary antibody (Thermo Fisher Scientific, Inc.). Other antibodies included those against transforming growth factor-beta 1 (TGF β1, 1:2000 dilution), TGF β2 (1:1000), Smad2 (1:2000), phospho-Smad2 (1:1000), Smad3 (1:1500), and phospho-Smad3 (1:2000). All the above antibodies were purchased from Abcam Inc. (Cambridge, MA, USA).
Cell Proliferation Assay
Cell viability was detected using Cell Counting Kit-8 (CCK-8, Dojindo Molecular Technologies, Kumamoto, Japan). Briefly, approximately 2×10³ cells were inoculated in wells of a 96-well plate. Then, 10 μL CCK8 reagent was added to each well and incubated at 37°C for 1 hr. The absorbance values at 450 nm were measured at 0, 24, 48, and 72 hrs using the Benchmark microplate reader (Bio-Rad Laboratories Inc., Hercules, CA, USA).
Transwell Analysis
Transwell chambers (BD Biosciences, San Jose, CA, USA) pre-covered with Matrigel were utilized for the invasion assay. Approximately 5×10⁴ cells were re-suspended in FBS-free culture medium in strict accordance with the manufacturer’s instruction and put in the upper Transwell chamber. Medium containing 10% FBS was put in the lower chamber. Cells were cultured for another 24 h. Cells in the upper chamber were scraped off the filter, and those in the lower chamber were fixed with 4% paraformaldehyde and stained with 0.1% crystal violet.
Wound Healing Assay
Cell migration capacity was detected using a wound healing assay. Approximately 5×10⁵ cells were inoculated in wells of a 6-well plate and incubated until growth was 90–100% confluent. Then, a 200-μL plastic pipette tip was used to gently scrape the growth to produce an even wound. The wound healing process was monitored at 0 and 24 hrs by microscopy and photographed.
Statistical Analyses
The functional experiments of cells were repeated three times. SPSS 19.0 statistical software (SPSS Inc., Chicago, IL, USA) was used for data analysis. Categorical variables were compared using chi-square test. Overall survival (OS) and disease-free survival (DFS) were used as outcome indices. Survival rate was determined using the Kaplan–Meier method, and the survival rates of patients between subgroups were compared using the Log-rank test. The Cox proportional hazard model was utilized for univariate and multivariate analyses. All statistical analyses were two-sided, and a difference of p < 0.05 was deemed statistically significant.
Results
Biological Information Analysis
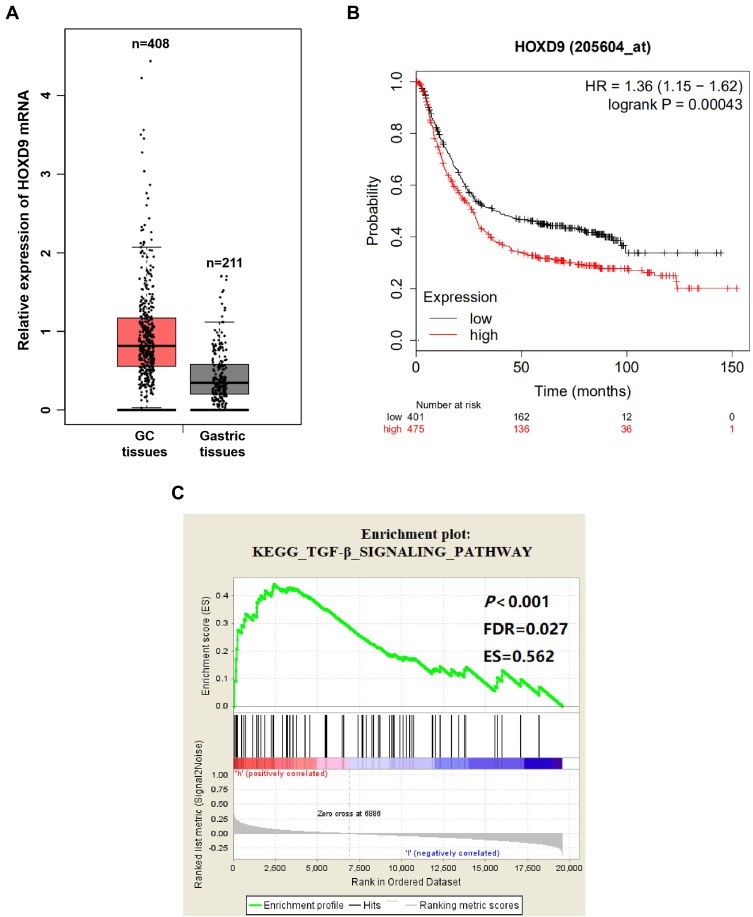
To explore the relationship between HOXD9 and GC, we first employed a bioinformatic online tool for preliminary prediction. The GEPIA dataset contained 408 GC tissues and 211 normal gastric tissues. The GEPIA prediction results suggested that, compared with that of normal gastric tissues, HOXD9 expression in GC tissues was upregulated (Figure 1A). At the same time, we also evaluated the effect of HOXD9 expression on the prognosis for GC patients using the Kaplan-Meier plotter online analysis tool. The Kaplan-Meier survival curve suggested that high HOXD9 expression indicated low survival rate for GC patients (Figure 1B). GSEA enrichment analysis based on KEGG discovered that HOXD9 was closely correlated with the TGF-β pathway (Figure 1C).
Figure 1.
Biological information analysis.
Notes: (A) GEPIA analysis showed that the expression level of HOXD9 mRNA in GC tissues was higher than that in normal gastric tissues. (B) The Kaplan–Meier survival curve suggested that high HOXD9 expression indicated a shorter survival for GC patients. (C) The abnormal expression of HOXD9 was closely related to TGF-β pathway based on GSEA enrichment analysis.
Abbreviations: ES, enrichment score; FDR, false discovery rate.
Expression of HOXD9 in GC Tissues
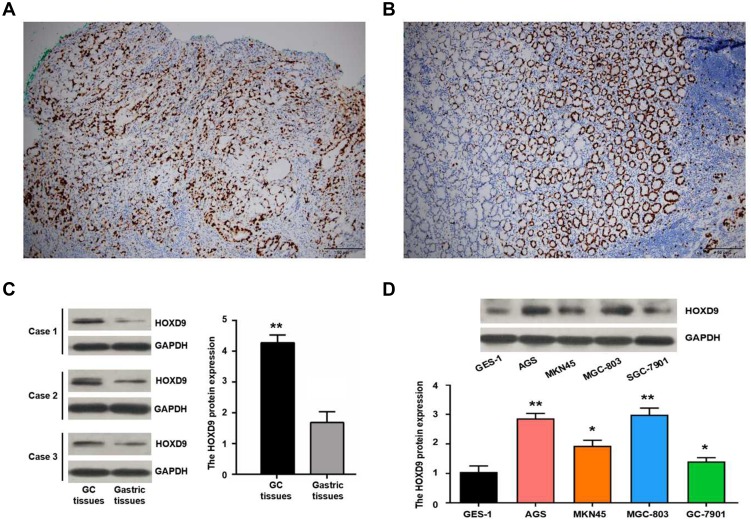
We detected HOXD9 expression in GC tissues and para-carcinoma tissues using immunohistochemistry (IHC) (Figure 2A and B). According to previously formulated evaluation criteria, the high expression rate of HOXD9 in the 120 GC tissues was 50% (60/120), which was markedly higher than that in para-carcinoma tissues (34.2%, 41/120; X2 = 6.171, p = 0.013). To verify the above detection results, we randomly selected three pairs of GC and para-carcinoma tissues to quantitatively estimate the HOXD9 expression level through Western blotting (The information of the 3 GC patients is as follows: Case 1, male, 52 years, moderate differentiation, III stage; Case 2, female, 70 years, poor differentiation, II stage; Case 3, male, 65 years, poor differentiation, III stage). The results suggested that the HOXD9 expression level in GC tissues was markedly higher than in para-carcinoma tissues (Figure 2C).
Figure 2.
Expression of HOXD9 protein in GC.
Notes: Expression of HOXD9 protein in GC tissue (A) and normal gastric tissue (B), some cells have stained nucleoli. (C) The expression level of HOXD9 protein in GC tissues is significantly higher than the matched paracancerous tissues. (D) HOXD9 protein is up-regulated in GC cell lines compared with normal gastric epithelial cells GES-1. Compared with the GES-1 cell line, **p<0.01, *p<0.05.
Using the IHC results, we divided the 120 GC patients into high (n = 60) and low HOXD9 expression group (n = 60). At the same time, we collected and carefully analyzed the data from these GC patients, to investigate the relationship between HOXD9 expression status and the clinicopathological features of GC patients. High HOXD9 expression was closely correlated with the degree of tumor differentiation, lymph node metastasis, vascular invasion, and TNM classification of GC patients (p < 0.05), but not with other variables, including age, sex, tumor location, and tumor site, as shown in Table 1.
Table 1.
Correlation Between the HOXD9 Expression and Clinicopathological Features of GC Patients
| Clinicopathological Features | Low HOXD9 Expression (n =60) | High HOXD9 Expression (n =60) | p |
|---|---|---|---|
| Age | 0.572 | ||
| <60 years | 21 | 24 | |
| ≥60 years | 39 | 36 | |
| Gender | 0.315 | ||
| Female | 20 | 15 | |
| Male | 40 | 45 | |
| Tumor location | 0.564 | ||
| Down | 41 | 38 | |
| Upper/middle | 19 | 22 | |
| Tumor size | 0.251 | ||
| <5 cm | 42 | 36 | |
| ≥5 cm | 18 | 24 | |
| Differentiation | 0.017 | ||
| Well/moderate | 33 | 20 | |
| Poor | 27 | 40 | |
| Lymph node metastasis | 0.016 | ||
| Negative | 31 | 18 | |
| Positive | 29 | 42 | |
| Vascular invasion | 0.006 | ||
| No | 34 | 19 | |
| Yes | 26 | 41 | |
| TNM stage | 0.014 | ||
| I/II | 29 | 16 | |
| III | 31 | 44 |
Abbreviations: HOXD9, Homeobox D9; GC, gastric cancer; TNM, tumor node metastasis.
Correlation of HOXD9 Expression with Survival of GC Patients
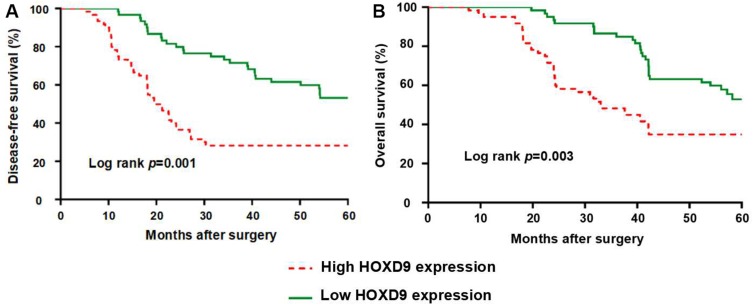
To evaluate the effect of HOXD9 expression status on the prognosis for GC patients, we followed-up the 120 GC patients, and survival curves were plotted for them based on different HOXD9 expression status. The Kaplan-Meier survival analysis suggested that high HOXD9 expression was related to poor OS and DFS, as presented in Figure 3A and B. As shown in Table 2, using univariate analysis we determined the prognostic factors for OS. These factors included lymph node status (p = 0.002), vascular invasion (p = 0.041), TNM classification (p = 0.002), and HOXD9 expression (p = 0.001). Five variables were identified as prognostic factors for DFS, including differentiation (p = 0.027), lymph node status (p = 0.004), vascular invasion (p = 0.034), TNM classification (p = 0.006), and HOXD9 expression (p < 0.001) (Table 3). To further determine the independent predicting factors of OS and DFS, we carried out multivariate Cox regression analysis, which revealed that the HOXD9 expression level was an independent prognostic factor for the survival of GC patients.
Figure 3.
GC Patients with high expression of HOXD9 have a worse prognosis.
Notes: (A) HOXD9 and disease-free survival of patients with GC. (B) HOXD9 and overall survival of patients with GC.
Table 2.
Univariate and Multivariable Analyses of OS
| Variables | Univariate | Multivariate | ||||
|---|---|---|---|---|---|---|
| HR | 95% CI | p | HR | 95% CI | p | |
| Age (≥60 years vs <60 years) | 0.677 | 0.416–1.103 | 0.117 | |||
| Gender (male vs female) | 1.093 | 0.636–1.879 | 0.747 | |||
| Tumor location (upper/middle vs down) | 1.190 | 0.717–1.975 | 0.501 | |||
| Tumor size (≥5cm vs <5 cm) | 1.223 | 0.743–2.011 | 0.429 | |||
| Differentiation (poor vs well/moderate) | 1.553 | 0.943–2.557 | 0.084 | |||
| Lymph node metastasis (positive vs negative) | 2.285 | 1.339–3.900 | 0.002 | 1.784 | 1.030–3.087 | 0.039 |
| Vascular invasion (yes vs no) | 1.690 | 1.022–2.796 | 0.041 | 1.267 | 0.748–2.148 | 0.379 |
| TNM stage (III vs I/II) | 2.454 | 1.392–4.327 | 0.002 | 2.035 | 1.139–3.637 | 0.016 |
| HOXD9 expression (high vs low) | 2.253 | 1.374–3.693 | 0.001 | 1.827 | 1.085–3.078 | 0.023 |
Abbreviations: OS, overall survival; HR, hazard ratio; Cl, confidence interval; TNM, tumor node metastasis; HOXD9, homeobox D9.
Table 3.
Univariate and Multivariable Analyses of DFS
| Variables | Univariate | Multivariate | ||||
|---|---|---|---|---|---|---|
| HR | 95% CI | p | HR | 95% CI | p | |
| Age (≥60 years vs <60 years) | 0.792 | 0.493–1.273 | 0.336 | |||
| Gender (male vs female) | 1.144 | 0.676–1.935 | 0.617 | |||
| Tumor location (upper/middle vs down) | 1.130 | 0.691–1.849 | 0.625 | |||
| Tumor size (≥5cm vs <5 cm) | 1.174 | 0.724–1.902 | 0.516 | |||
| Differentiation (poor vs well/moderate) | 1.734 | 1.065–2.824 | 0.027 | 1.428 | 1.087–2.344 | 0.038 |
| Lymph node metastasis (positive vs negative) | 2.081 | 1.257–3.446 | 0.004 | 1.564 | 0.932–2.627 | 0.091 |
| Vascular invasion (yes vs no) | 1.689 | 1.041–2.740 | 0.034 | 1.212 | 0.733–2.004 | 0.454 |
| TNM stage (III vs I/II) | 2.103 | 1.241–3.563 | 0.006 | 1.742 | 1.016–2.987 | 0.044 |
| HOXD9 expression (high vs low) | 2.545 | 1.574–4.115 | <0.001 | 2.120 | 1.284–3.502 | 0.003 |
Abbreviations: DFS, disease-free survival; HR, hazard ratio; Cl, confidence interval; TNM, tumor node metastasis; HOXD9, homeobox D9.
Effect of HOXD9 on Biological Behavior of GC Cells
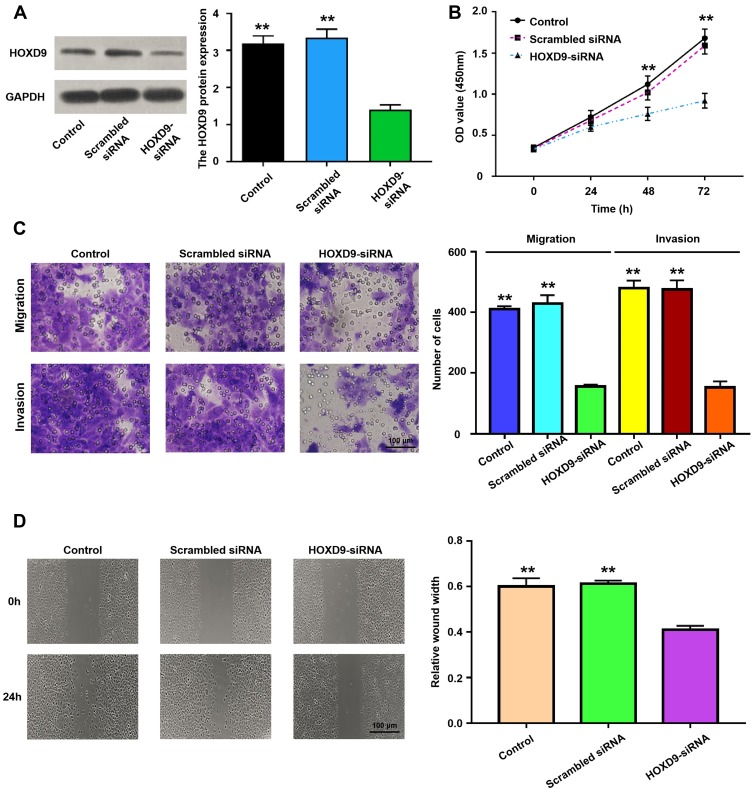
To explore the role of HOXD9 in the GC process, we first examined the expression level of HOXD9 protein in GC cell lines by Western blot. Compared with that in the normal gastric epithelial cell line, GES-1, HOXD9 was highly expressed in three GC cell lines (Figure 2D). Among them, HOXD9 displayed the highest expression level in the MGC-803 GC cell line. Therefore, we selected the MGC-803 cell line for subsequent functional verification, including downregulation of HOXD9 expression by siRNA and verification of the inhibitory efficiency of siRNA by Western blot (Figure 4A). The CCK-8 kit was used to assess whether downregulation of HOXD9 affected the proliferation of GC cells. As shown in Figure 4B, downregulation of HOXD9 significantly inhibited the proliferation of MGC-803 cells. We evaluated the effect of HOXD9 knockdown on migration and invasion of MGC-803 cells by Transwell experiments. The results indicated that downregulation of HOXD9 expression effectively inhibited the migration and invasion of MGC-803 cells (Figure 4C). Wound healing experiments confirmed that knockdown HOXD9 inhibited the migratory ability of GC cells (Figure 4D).
Figure 4.
The relationship of HOXD9 protein expression status and malignant biological behavior of GC cell.
Notes: (A) Using siRNA technology to effectively inhibit the expression of HOXD9 in MGC-803 cell line. (B) Knockdown of HOXD9 effectively inhibits proliferation of MGC-803 cells. (C) Silencing HOXD9 expression can inhibit the migration and invasion of MGC-803 cells. (D) Knockdown of HOXD9 effectively inhibits migration of MGC-803 cells. Compared with the HOXD9-siRNA group, **p<0.01.
HOXD9 Activates the TGF-β/Smad Signaling Pathway
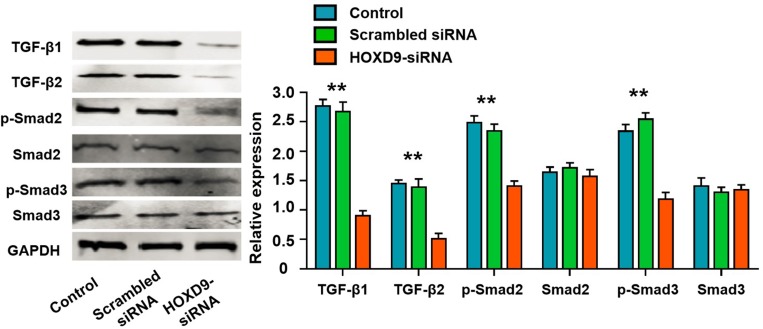
To explore the potential mechanism of HOXD9 in GC pathogenesis, we first performed GSEA enrichment analysis. The bioinformatics analysis suggested that the aberrant expression of HOXD9 was closely related to the TGF-β/Smad signaling pathway (Figure 1C). Therefore, we examined the major protein in the TGF-β/Smad pathway by Western blot. Inhibition of HOXD9 expression in MGC-803 cells affected the expression and phosphorylation levels of some proteins in the TGF-β/Smad signaling pathway, as shown in Figure 5. These results indicated that the high expression of HOXD9 can activate the TGF-β/Smad signaling pathway.
Figure 5.
High HOXD9 expression activated TGF-β/Smad signaling pathway in MGC-803 cells.
Notes: After knocked down of HOXD9, the expressions of TGF-β1, TGF-β2, and p-Samd2, p-Samd2 were significantly suppressed, while the expression levels of total Samd2 and Samd3 was not significantly changed. Compared with the HOXD9-siRNA group, **p<0.01.
Discussion
The HOXD9 gene is one of several HOXD genes located in the chromosomal region 2q31-2q37. Deletion of the entire HOXD gene cluster or the deficiency of the 5ʹ-terminus of that cluster is related to severe limb and genital abnormalities. HOX gene mutations will frequently result in obvious loss of cell proliferation, leading to regional hypoplasia.14 A study of mouse skin morphogenesis discovered that HOXD9 and HOXD11 genes were expressed only in the tail skin of mice at 14.5 days of gestation.15 In another mouse development study, HOXD9 and HOXD10 were closely correlated with the development of the neural duct, axial mesoderm, and limbs.16 Relative to the synovial cells in osteoarthritis patients, HOXD9 displayed a higher expression level in synovial cells in patients with rheumatic arthritis and was implicated with a partial effect on synovial cell proliferation.17 Researchers have suggested that HOXD9 participates in cell proliferation mainly through the upregulation of growth factors or enhancement of their transcription activities. However, few studies regarding the relationship between HOXD9 and malignant tumors are available at present.
Li et al discovered through reverse transcription-polymerase chain reaction (RT-PCR) that HOXD9 was highly expressed in cervical cancer cells, but not in normal cervical cells.12 In esophageal squamous cell carcinoma (ESCC), Liu10 detected the expression of HOXD9 protein in samples through IHC and found that over 60% of ESCC cells were stained for HOXD9 protein to varying degrees. Japanese scholars first discovered through PCR and IHC that HOXD9 is highly expressed in gliomas. They investigated the HOXD9 function in glioma cell lines, and their results suggested that silencing HOXD9 could effectively suppress the proliferation of U87 glioma cells and promote cell cycle arrest and apoptosis.11 A similar phenomenon was observed in glioma stem cells. In a study on liver cancer, HOXD9 was highly expressed in invasive hepatocellular carcinoma cells. In vitro experiments demonstrated that the over-expression of HOXD9 could remarkably enhance the migratory and invasive capacities of liver cancer cells and promote their epithelial–mesenchymal transition.18 Concerning the mechanisms, the interaction of HOXD9 with the promoter region of ZEB1 to promote its transcription has been suggested. Bao et al19 discovered through a bioinformatic analysis that the HOXD gene family is specifically upregulated in human lung squamous carcinoma, including HOXD9. In another glioma study,20 it was discovered that miR-205 could downregulate HOXD9, suppress epithelial–mesenchymal transition in tumor cells, and inhibit growth of human glioma. However, the relationship between HOXD9 and GC has not yet been reported. Therefore, we investigated HOXD9 expression and function in GC clinical samples and cells.
We detected HOXD9 expression in GC tissues and cell lines, and discovered that HOXD9 is upregulated in GC, where it is mainly located in the cytoplasm. High HOXD9 expression is related to tumor differentiation, lymph node status, vascular invasion, and disease stage in GC patients. GC patients with high HOXD9 expression were associated with poorer prognosis, and HOXD9 was identified as an independent risk factor for the poor prognosis of GC patients. Consequently, HOXD9 may play at least a partial role as an oncogene during the development of GC. Presently, HOXD9 expression in GC cells was effectively silenced using siRNA. The results suggest that HOXD9 knockdown can effectively suppress proliferative, invasive, and migratory capacities of GC cells, indicating that the role of HOXD9 as an oncogene.
In summary, HOXD9 has an oncogenic role in the GC process. In vitro, we demonstrated that HOXD9 affects the proliferation, migration, and invasion of GC cells by activating the TGF-β/Smad signaling pathway. HOXD9 may thus be a potential therapeutic target for GC.
Disclosure
The authors report no conflicts of interest in this work.
References
- 1.Karimi P, Islami F, Anandasabapathy S, Freedman ND, Kamangar F. Gastric cancer: descriptive epidemiology, risk factors, screening, and prevention. Cancer Epidemiol Biomarkers Prev. 2014;23(5):700–713. doi: 10.1158/1055-9965.EPI-13-1057 [DOI] [PMC free article] [PubMed] [Google Scholar]
- 2.Bray F, Ferlay J, Soerjomataram I, Siegel RL, Torre LA, Jemal A. Global cancer statistics 2018: GLOBOCAN estimates of incidence and mortality worldwide for 36 cancers in 185 countries. CA Cancer J Clin. 2018;68(6):394–424. doi: 10.3322/caac.v68.6 [DOI] [PubMed] [Google Scholar]
- 3.Edwards BK, Noone AM, Mariotto AB, et al. Annual Report to the Nation on the status of cancer, 1975–2010, featuring prevalence of comorbidity and impact on survival among persons with lung, colorectal, breast, or prostate cancer. Cancer. 2014;120(9):1290–1314. doi: 10.1002/cncr.28509 [DOI] [PMC free article] [PubMed] [Google Scholar]
- 4.Nie Y, Wu K, Yu J, et al. A global burden of gastric cancer: the major impact of China. Expert Rev Gastroenterol Hepatol. 2017;11(7):651–661. doi: 10.1080/17474124.2017.1312342 [DOI] [PubMed] [Google Scholar]
- 5.Jerković I, Ibrahim DM, Andrey G, et al. Genome-wide binding of posterior HOXA/D transcription factors reveals subgrouping and association with CTCF. PLoS Genet. 2017;13(1):e1006567. doi: 10.1371/journal.pgen.1006567 [DOI] [PMC free article] [PubMed] [Google Scholar]
- 6.Raines AM, Magella B, Adam M, Potter SS. Key pathways regulated by HoxA9,10,11/HoxD9,10,11 during limb development. BMC Dev Biol. 2015;15:28. doi: 10.1186/s12861-015-0078-5 [DOI] [PMC free article] [PubMed] [Google Scholar]
- 7.Holland PW. Evolution of homeobox genes. Wiley Interdiscip Rev Dev Biol. 2013;2(1):31–45. doi: 10.1002/wdev.78 [DOI] [PubMed] [Google Scholar]
- 8.Armat M, Ramezani F, Molavi O, Sabzichi M, Samadi N. Six family of homeobox genes and related mechanisms in tumorigenesis protocols. Tumori J. 2016;2016(3):236–243. doi: 10.5301/tj.5000495 [DOI] [PubMed] [Google Scholar]
- 9.Morgan R, Plowright L, Harrington KJ, Michael A, Pandha HS. Targeting HOX and PBX transcription factors in ovarian cancer. BMC Cancer. 2010;10:89. doi: 10.1186/1471-2407-10-89 [DOI] [PMC free article] [PubMed] [Google Scholar]
- 10.Liu DB, Gu ZD, Cao XZ, Liu H, Li JY. Immunocytochemical detection of HoxD9 and Pbx1 homeodomain protein expression in Chinese esophageal squamous cell carcinomas. World J Gastroenterol. 2005;11(10):1562–1566. [DOI] [PMC free article] [PubMed] [Google Scholar]
- 11.Tabuse M, Ohta S, Ohashi Y, et al. Functional analysis of HOXD9 in human gliomas and glioma cancer stem cells. Mol Cancer. 2011;10:60. doi: 10.1186/1476-4598-10-60 [DOI] [PMC free article] [PubMed] [Google Scholar]
- 12.Li H, Huang CJ, Choo KB. Expression of homeobox genes in cervical cancer. Gynecol Oncol. 2002;84(2):216–221. doi: 10.1006/gyno.2001.6498 [DOI] [PubMed] [Google Scholar]
- 13.Tang Z, Li C, Kang B, Gao G, Li C, Zhang Z. GEPIA: a web server for cancer and normal gene expression profiling and interactive analyses. Nucleic Acids Res. 2017;45(W1):W98–W102. doi: 10.1093/nar/gkx247 [DOI] [PMC free article] [PubMed] [Google Scholar]
- 14.Chen F, Capecchi MR. Paralogous mouse Hox genes, Hoxa9, Hoxb9, and Hoxd9, function together to control development of the mammary gland in response to pregnancy. Proc Natl Acad Sci U S A. 1999;96(2):541–546. doi: 10.1073/pnas.96.2.541 [DOI] [PMC free article] [PubMed] [Google Scholar]
- 15.Kanzler B, Viallet JP, Le Mouellic H, Boncinelli E, Duboule D, Dhouailly D. Differential expression of two different homeobox gene families during mouse tegument morphogenesis. Int J Dev Biol. 1994;38(4):633–640. [PubMed] [Google Scholar]
- 16.de la Cruz CC, Der-Avakian A, Spyropoulos DD, Tieu DD, Carpenter EM. Targeted disruption of Hoxd9 and Hoxd10 alters locomotor behavior, vertebral identity, and peripheral nervous system development. Dev Biol. 1999;216(2):595–610. doi: 10.1006/dbio.1999.9528 [DOI] [PubMed] [Google Scholar]
- 17.Khoa ND, Nakazawa M, Hasunuma T, et al. Potential role of HOXD9 in synoviocyte proliferation. Arthritis Rheum. 2001;44(5):1013–1021. doi: 10.1002/(ISSN)1529-0131 [DOI] [PubMed] [Google Scholar]
- 18.Lv X, Li L, Lv L, et al. HOXD9 promotes epithelial-mesenchymal transition and cancer metastasis by ZEB1 regulation in hepatocellular carcinoma. J Exp Clin Cancer Res. 2015;34:133. doi: 10.1186/s13046-015-0245-3 [DOI] [PMC free article] [PubMed] [Google Scholar] [Retracted]
- 19.Bao L, Zhang Y, Wang J, et al. Variations of chromosome 2 gene expressions among patients with lung cancer or non-cancer. Cell Biol Toxicol. 2016;32(5):419–435. doi: 10.1007/s10565-016-9343-z [DOI] [PubMed] [Google Scholar]
- 20.Dai B, Zhou G, Hu Z, et al. MiR-205 suppresses epithelial-mesenchymal transition and inhibits tumor growth of human glioma through down-regulation of HOXD9. Biosci Rep. 2019;39(5). doi: 10.1042/BSR20181989. [DOI] [PMC free article] [PubMed] [Google Scholar] [Retracted]


