Abstract
Using lightning flash data from the National Lightning Detection Network with an updated lightning nitrogen oxides (NOx) emission estimation algorithm in the Community Multiscale Air Quality (CMAQ) model, we estimate the hourly variations in lightning NOx emissions for the summer of 2011 and simulate its impact on distributions of tropospheric ozone (O3) across the continental United States. We find that typical summer-time lightning activity across the U.S. Mountain West States (MWS) injects NOx emissions comparable to those from anthropogenic sources into the troposphere over the region. Comparison of two model simulation cases with and without lightning NOx emissions show that significant amount of ground-level O3 in the MWS during the summer can be attributed to the lightning NOX emissions. The simulated surface-level O3 from a model configuration incorporating lightning NOx emissions showed better agreement with the observed values than the model configuration without lightning NOx emissions. The time periods of significant reduction in bias in simulated O3 between these two cases strongly correlate with the time periods when lightning activity occurred in the region. The inclusion of lightning NOx increased daily maximum 8 h O3 by up to 17 ppb and improved model performance relative to measured surface O3 mixing ratios in the MWS region. Analysis of model results in conjunction with lidar measurements at Boulder, Colorado during July 2014 corroborated similar impacts of lightning NOx emissions on O3 emissions estimated for other summers is comparable to the 2011 air quality. The magnitude of lightning NOx estimates suggesting that summertime surface-level O3 levels in the MWS region could be significantly influenced by lightning NOx.
INTRODUCTION
Due to its adverse impact on human health1 and ecosystem well being,2 tropospheric ozone (O3) has been at the center of air quality research during the past decades.3–5 Ground-level O3 is either produced through complex photochemical reactions involving nitrogen oxides (NOx) and volatile organic compounds (VOCs),6 with both anthropogenic and natural origins, or transported from other locations.7 As air quality regulations are tightened and the contribution of anthropogenic sources to tropospheric O3 levels is reduced in US and other economically-developed regions, the natural sources becomes more increasingly important.8–12
Lightning generates relatively large but uncertain quantities of NOx and thus strongly impacts the composition of trace gases in the troposphere.13–15 Globally, lightning is estimated to generate 2–8 Tg N per year16 which is considerably smaller than present-day global contributions from anthropogenic (~20.5 Tg N per year) and biomass burning (~5.5 Tg N per year) sources.17 Despite the strong influence on troposphere burdens of O3 and OH, impacts of lightning NOx emissions on the surface-level air composition and chemistry have been suggested by past studies to be generally small, and thus except for some applications with global models, regional air quality assessments have historically not included lightning NOx emissions.16 Uncertainties in lightning NOx emissions are influenced by limitations in the description of space and time variability in lightning frequency and intensity, NOx production rates from lightning flashes, and the vertical distribution and transport of lightning NOx after its production. Since lightning activity is often associated with deep convection in the atmosphere, the lightning flash rate can be parameterized using convection schemes.18,19 However, convection schemes in meteorological models generally show low skill in producing the convective precipitation and the lightning distribution.20,21 Though many studies report enhancement in surface-level NOx levels following thunderstorm activity, the impacts on surface-level O3 are ambiguous and typically complicated by the local photochemical conditions such as the availability of other precursors and sunlight.22–25 Regional modeling calculations have shown up to 10 ppb enhancements in simulated instantaneous O3 mixing ratios8,13,23,25 due to addition of lightning NOx.
Heath et al.26 demonstrated that assimilation of high-quality lightning data from the national lightning detection network (NLDN) in the weather research and forecast (WRF) model considerably improved the simulation of summertime convective activity and rainfall over the continental United States. In this study, we build upon this prior work26,27 by implementing lightning NOx production in the Community Multiscale Air Quality (CMAQ)28–31 model based on the NLDN lightning flash data32,33 and perform CMAQ simulations driven by the lightning-assimilated WRF outputs with (hereafter denoted NLDN) and without (denoted Base) the NLDN-lightning NOx production.
RESULTS
The model performance for O3 predictions, in terms of a particular implementation of lightning NOx production, depends on correct NOx emissions from other sources in the Base model. Uncertainties in specification of precise activity patterns of mobile and industrial sources lead to uncertainties in space and time variability in estimated emissions from these sources that then translate to biases and errors in model predicted O3 mixing ratios. The addition of lightning NOx emissions can then result in further deterioration of model performance for predicted O3 at many locations such as in the eastern U.S. as illustrated in Fig. 1a, which presents the change in bias in simulated surface daily maximum 8 h (DM8HR) O3 between the NLDN and Base simulations. However, significant impact of lightning NOx emissions on improving skill of model predictions of surface O3 in the Mountain West States (MWS: Arizona, New Mexico, Nevada, Utah, Colorado, and Wyoming) is illustrated in Fig. 1a, and further emphasized in Fig. 1b. During the summer of 2011 in the MWS region there were over 800 measured DM8HR O3 exceedances above 70 ppb as summarized in Table 1. Even though both model simulations with and without lightning NOx underestimated the observed values, the simulation incorporating impacts of lightning NOx reduced the mean bias across the measurement locations (Fig. 1b) significantly during periods with lightning activity (depicted in Fig. 1c). Significant impacts of lightning NOx on day to day variations in domain-mean surface DM8HR O3 over the MWS region is also noted in Fig. 1d, which illustrates that lightning NOx emissions increase region-average DM8HR O3 by up to 6 ppb and helps reduce the model low-bias. Recent modeling analysis34 in the southeast U.S. has speculated that NOx motor vehicle emissions in U.S. National Emission Inventory (NEI) may be overestimated. However, the role of uncertainties associated with other modeled processes as well as the inventory base year used in the analysis, on the magnitude of this overestimation, are not readily apparent (e.g., Simon et al.10). The MWS region which is the focus of our analysis is a sparsely populated area and consequently anthropogenic emissions in the region are relatively small. Thus, the relative impacts of uncertainties in anthropogenic NOx on the total NOx burden in the region is also comparatively smaller relative to other regions in the U.S. In recent complementary analyses,31 we have comprehensively compared model predicted NOx mixing ratios with observations for different regions, which also indicated that the model has the best performance over MWS for NOx predictions. Thus, the impact of uncertainties in characterizing NOx emissions from other sectors on the inferred impacts of lightning NOx emissions in the MWS region are expected to be negligible.
Fig. 1. Impact of lightning events on O3 production during summer 2011.
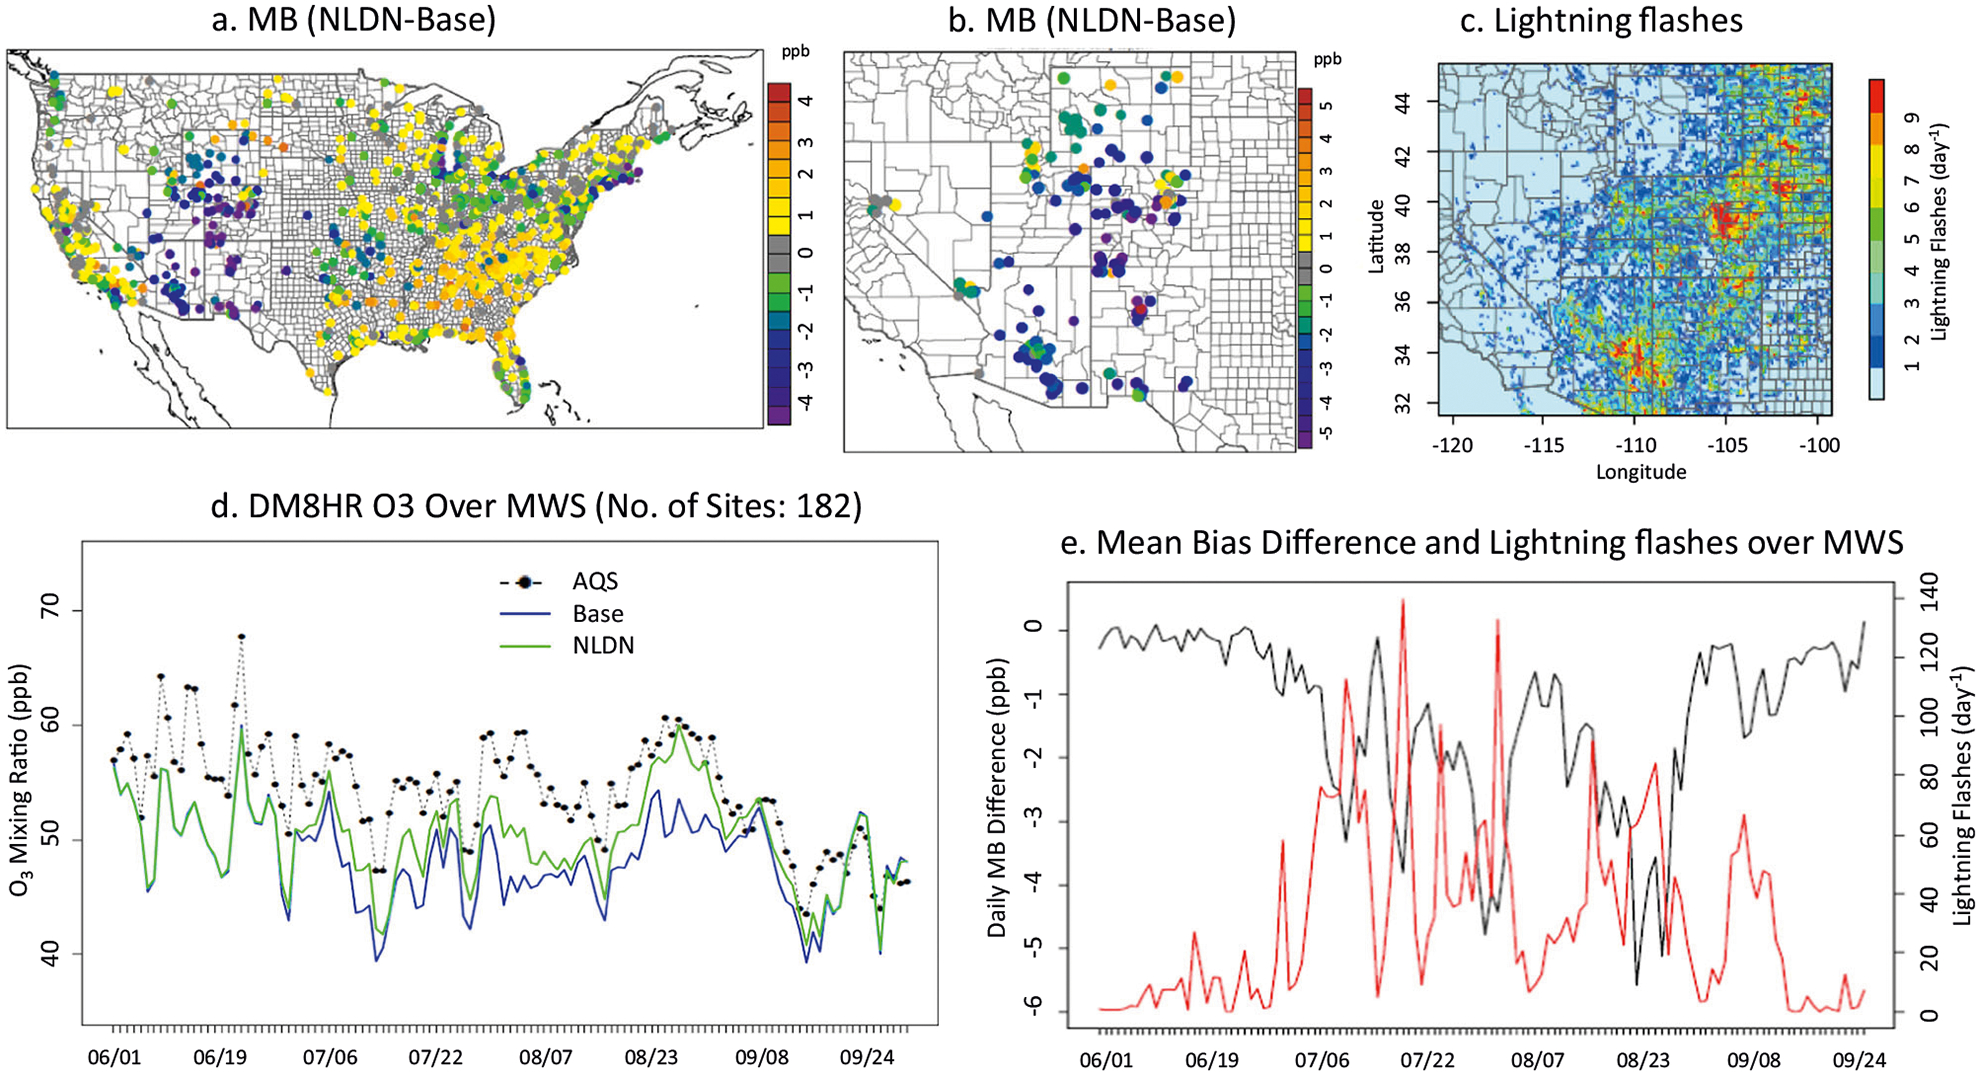
a Mean bias reduction over continental US between simulations with and without lightning NOx. b Same as a but focus on the MWS. c The average daily lightning flashes during July 2011. d Time series of observed and modeled DM8HR O3 mixing ratios. e Time series of the mean bias difference between the two simulations and the daily mean lightning flashes.
Table 1.
Summary of the observed and modeled DM8HR O3 mixing ratios in MWS.
| Event criteria (ppb) | Number of occurrences (site-day) |
|---|---|
| MD8HR O3 ≥ 70 (observed) | 803 |
| Simulated difference (NLDN - Base) ≥ 15 | 12 |
| Simulated difference ≥ 10 | 288 |
| Simulated difference ≥ 5 | 2494 |
| Maximum simulated difference: 17 | 1 |
To further delineate the impact of lightning activity on daily variations in surface O3, we examined the correlation between lightning activity and the change in model DM8HR O3 bias (Fig. 1e) (see the Supplementary Information (SI) and Supplementary Fig. 5 for detailed calculation of the lightning flashes; here the grid cell increments of ten are used). The time series of DM8HR O3 mixing ratios (Fig. 1d) and mean bias difference (Fig. 1e) clearly indicate that the model simulation with lightning NOx (NLDN) performed much better episodically in matching the observed values than the simulation without lightning NOx (Base). Days with highest lightning activity also corresponded to days when the largest improvements in DM8HR O3 mean bias were realized through the incorporation of lightning NOx emissions, strongly suggestive of the large role of lightning NOx emissions in modulating surface-level O3 mixing ratios in this region. The comparison of the daily average mean bias in DM8HR O3 over the AQS sites in the MWS for both the Base and the NLDN cases presented in Supplementary Fig. 3 further illustrates the improvement in model skill in capturing variations in surface DM8HR O3 in the region due to inclusion of lightning NOx emissions.
The relative importance of lightning as a source of reactive nitrogen in the troposphere over the MWS region is further highlighted in Fig. 2 which compares the strength of this source with other sources traditionally considered in estimating O3 in the region. Figure 2a–c show the spatial distributions of NOx emissions from anthropogenic, soil, and lightning sources over the MWS region for July 2011. Figure 2d presents the relative contributions of these three source categories to daily NOx emissions, while Fig. 2e quantifies the daily fraction of total NOx emissions that can be attributed to lightning. Note, for Fig. 2d, e, we limit the analysis to portions of the MWS region east of the 115°W longitude to minimize the influence of urban centers. As indicated in Fig. 2e, the lightning produced NOx constitutes 15–50% of daily NOx emissions in these remote regions and on average ~30% during July 2011, resulting in the significant impact on surface O3 illustrated earlier. The release of lightning NOx in such magnitudes into the atmosphere in this region could also potentially modulate atmospheric nitrogen deposition amounts in the region, and further emphasizes the need for air quality models to include lightning NOx emissions to accurately simulate both atmospheric chemistry and deposition in the MWS region.
Fig. 2. NOX emissions from different sources in time and space during July, 2011.
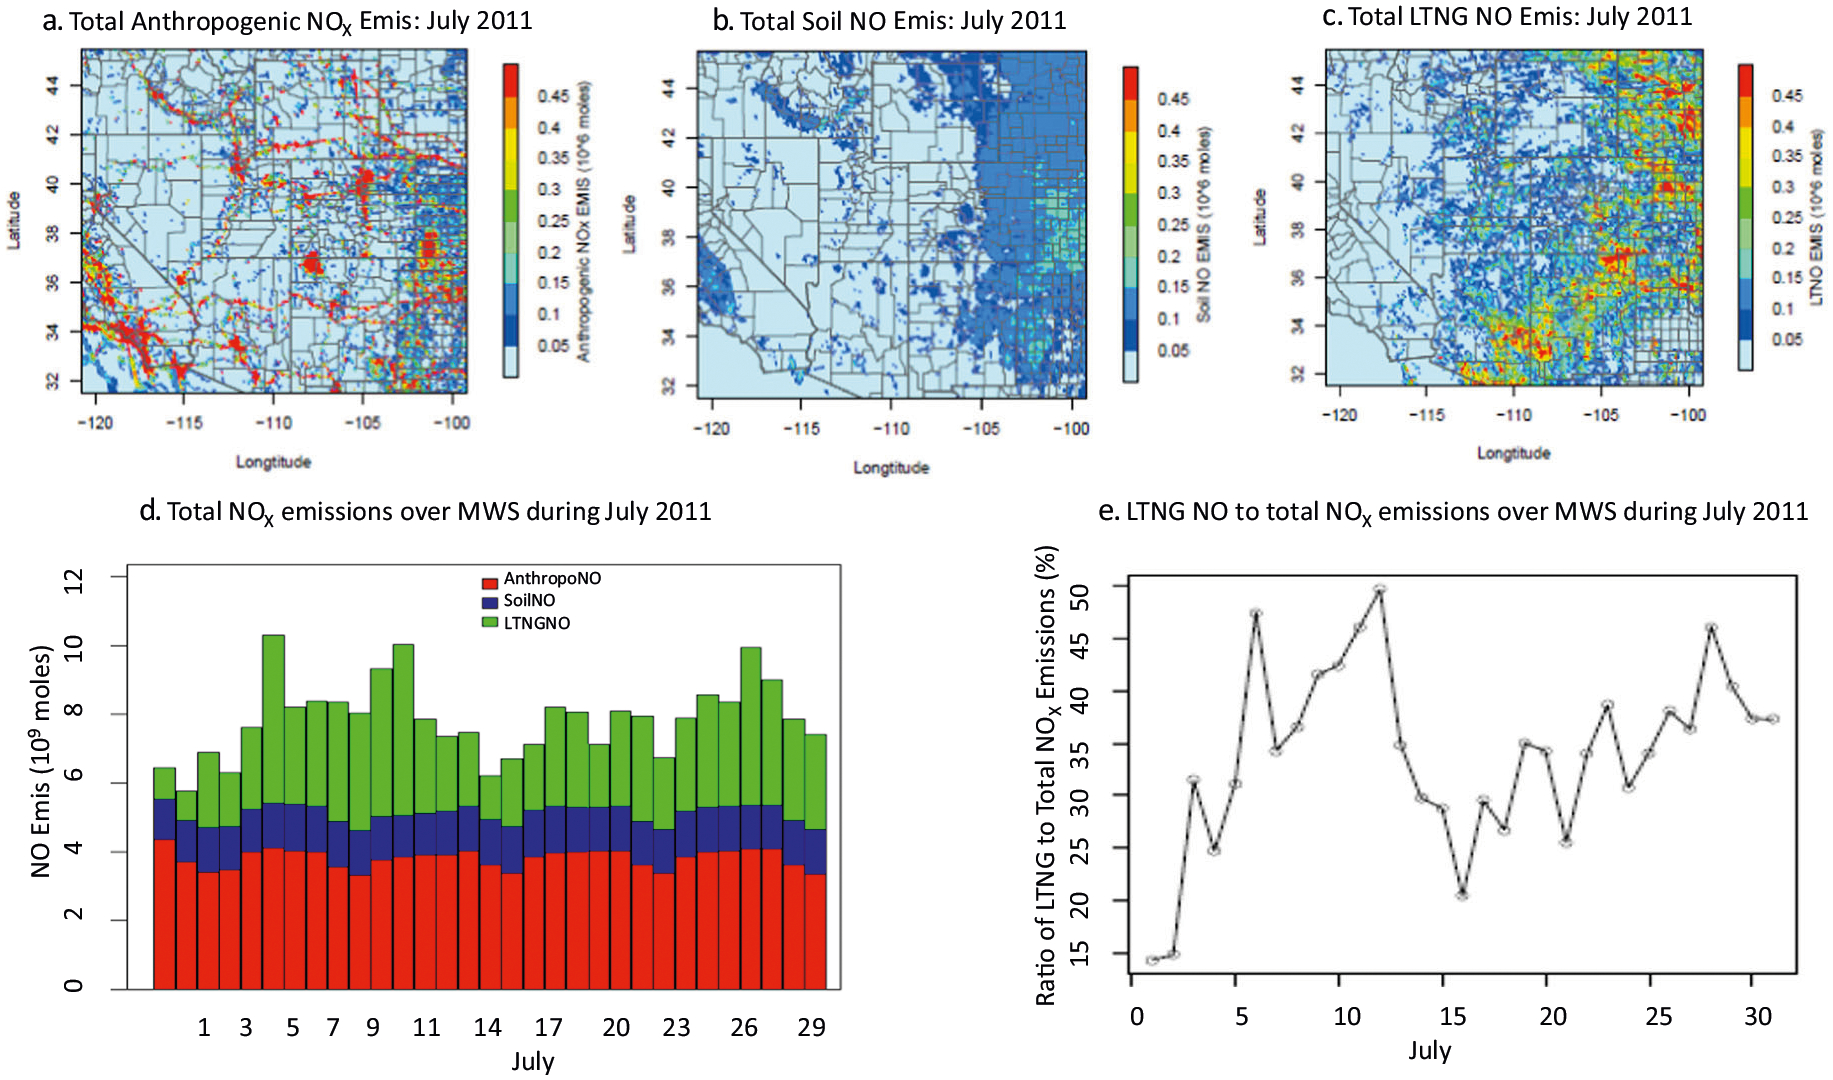
a Anthropogenic NOX emissions. b Soil NOX emissions. c Lightning NOX emissions. d Daily total emissions excluding those from the area west of −115° longitude. e The daily lightning NOx ratio to the total NOX emissions.
The significant impacts of lightning on air quality in the MWS region are however not unique to the summer of 2011. To leverage observations from the 2014 DISCOVER-AQ (Deriving Information on Surface Conditions from COlumn and VERtically Resolved Observations Relevant to Air Quality) field campaign, as a case study, WRF-CMAQ model simulations with (NLDN) and without (Base) lightning NOx emissions were performed for a period encompassing the field study and model results were compared with measurements at the Boulder Atmospheric Observatory (BAO) site. Maximum surface-level O3 mixing ratios were observed on July 28th, and the evolution of vertical O3 structure inferred from the lidar measurements during 26–29 July 2014 is shown in Fig. 3a. In these illustrations, the observed lidar O3 profiles are aggregated to the model vertical grid and temporally averaged to hourly values. Figure 3b shows the corresponding Base model (without lightning NOx) simulated values and Fig. 3c shows the corresponding simulated values when lightning NOx is included. Significant discrepancies are noted between the simulated and observed evolution of vertical O3 distributions on these days, with the model generally underestimating the development of high O3. Also, noted in the observed lidar profiles on most days, is the existence of localized high O3 aloft, suggestive of in situ production rather than intrusion of stratospheric air from higher altitudes. Comparison of Fig. 3a, b, c indicates that the simulated evolution of vertical O3 distribution and values with lightning NOx (Fig. 3c) matched the observations more closely than the case without lightning emissions. In general, the Base model shows overestimation on July 26th and underestimation on July 28th and 29th, while the simulation with lightning NOx improved the predicted O3 values for both these cases, i.e., decreased values on July 26th and increased values on July 28th and 29th. The difference between the two model cases is illustrated in Fig. 3d. The evolution of peak O3 over this period is further depicted in Fig. 4a, b that compare model and observed vertical profiles of daily maximum O3 mixing ratios for both model cases. From July 26 to 29, the observed peak values increased by over 20 ppb at the surface (from below 70 ppb to above 90 ppb), while the simulated values without lightning NOx decreased by 10 ppb (from 80 to 70 ppb); the simulations changed from more than 10 ppb over-prediction on July 26th to more than 20 ppb under-prediction on July 29th. However, when lightning NOx is included (Fig. 4b), the simulated surface daily maximum O3 mixing ratios are much closer to the observed values (compared to the Base case, the simulated O3 values decreased from 87 to 72 ppb on July 26th and increased from 76 to 89 ppb on July 29th, respectively). Lightning flash data for this period (see Supplementary Fig. 10) indicate periods of active lightning strikes in the region, especially on July 28th and 29th, further suggesting the contribution of lightning NOx to the observed aloft O3 and subsequent contribution to surface enhancements. These changes in model simulated O3 mixing ratios during this period in response to the injection of lightning NOx emissions further indicate the non-linear relationship between O3 and its precursors. Depending on the location and timing of its injection, lightning NOx emissions can either produce or destroy O3. In proximity of the lightning location, O3 is chemically consumed due to titration by the freshly emitted NO. In contrast, when NOx from lightning is transported to locations downwind of the lightning flash, in the presence of sunlight it reacts with VOCs in the surrounding air to produce O3. Note that the uniform distribution of simulated O3 values under about 2 km shown in Fig. 4 and Supplementary Fig. 11 is due to the fact that maximum O3 values typically occur during early afternoon hours when the planetary boundary layer (PBL) is well mixed.
Fig. 3. Lidar measured and simulated O3 mixing ratios at BAO site.
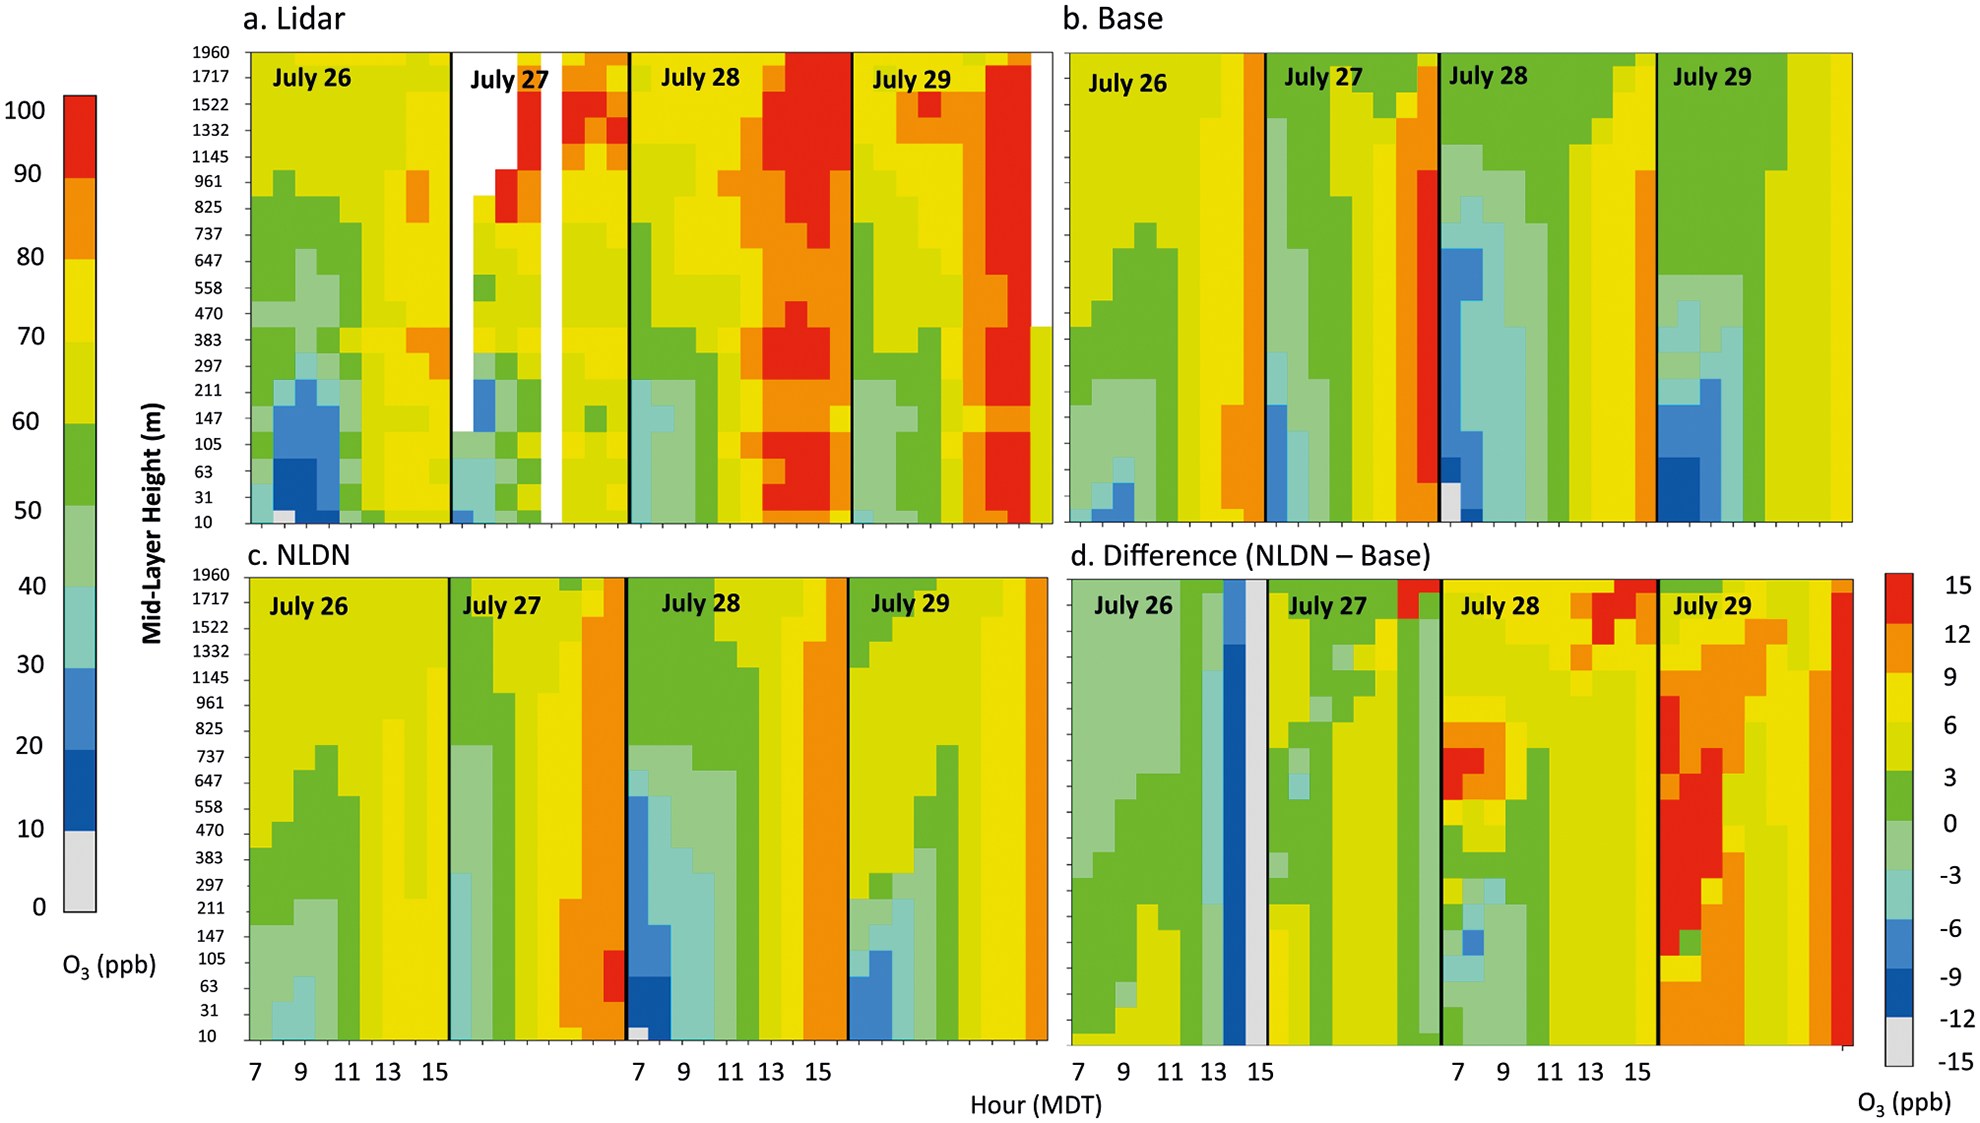
a Lidar measurements, b base simulations, c simulations with NLDN, d simulation difference (NLDN – Base). The legend on the left is for a–c and the legend at the right bottom is for d.
Fig. 4. Lidar measured and simulated O3 mixing ratios at BAO site.
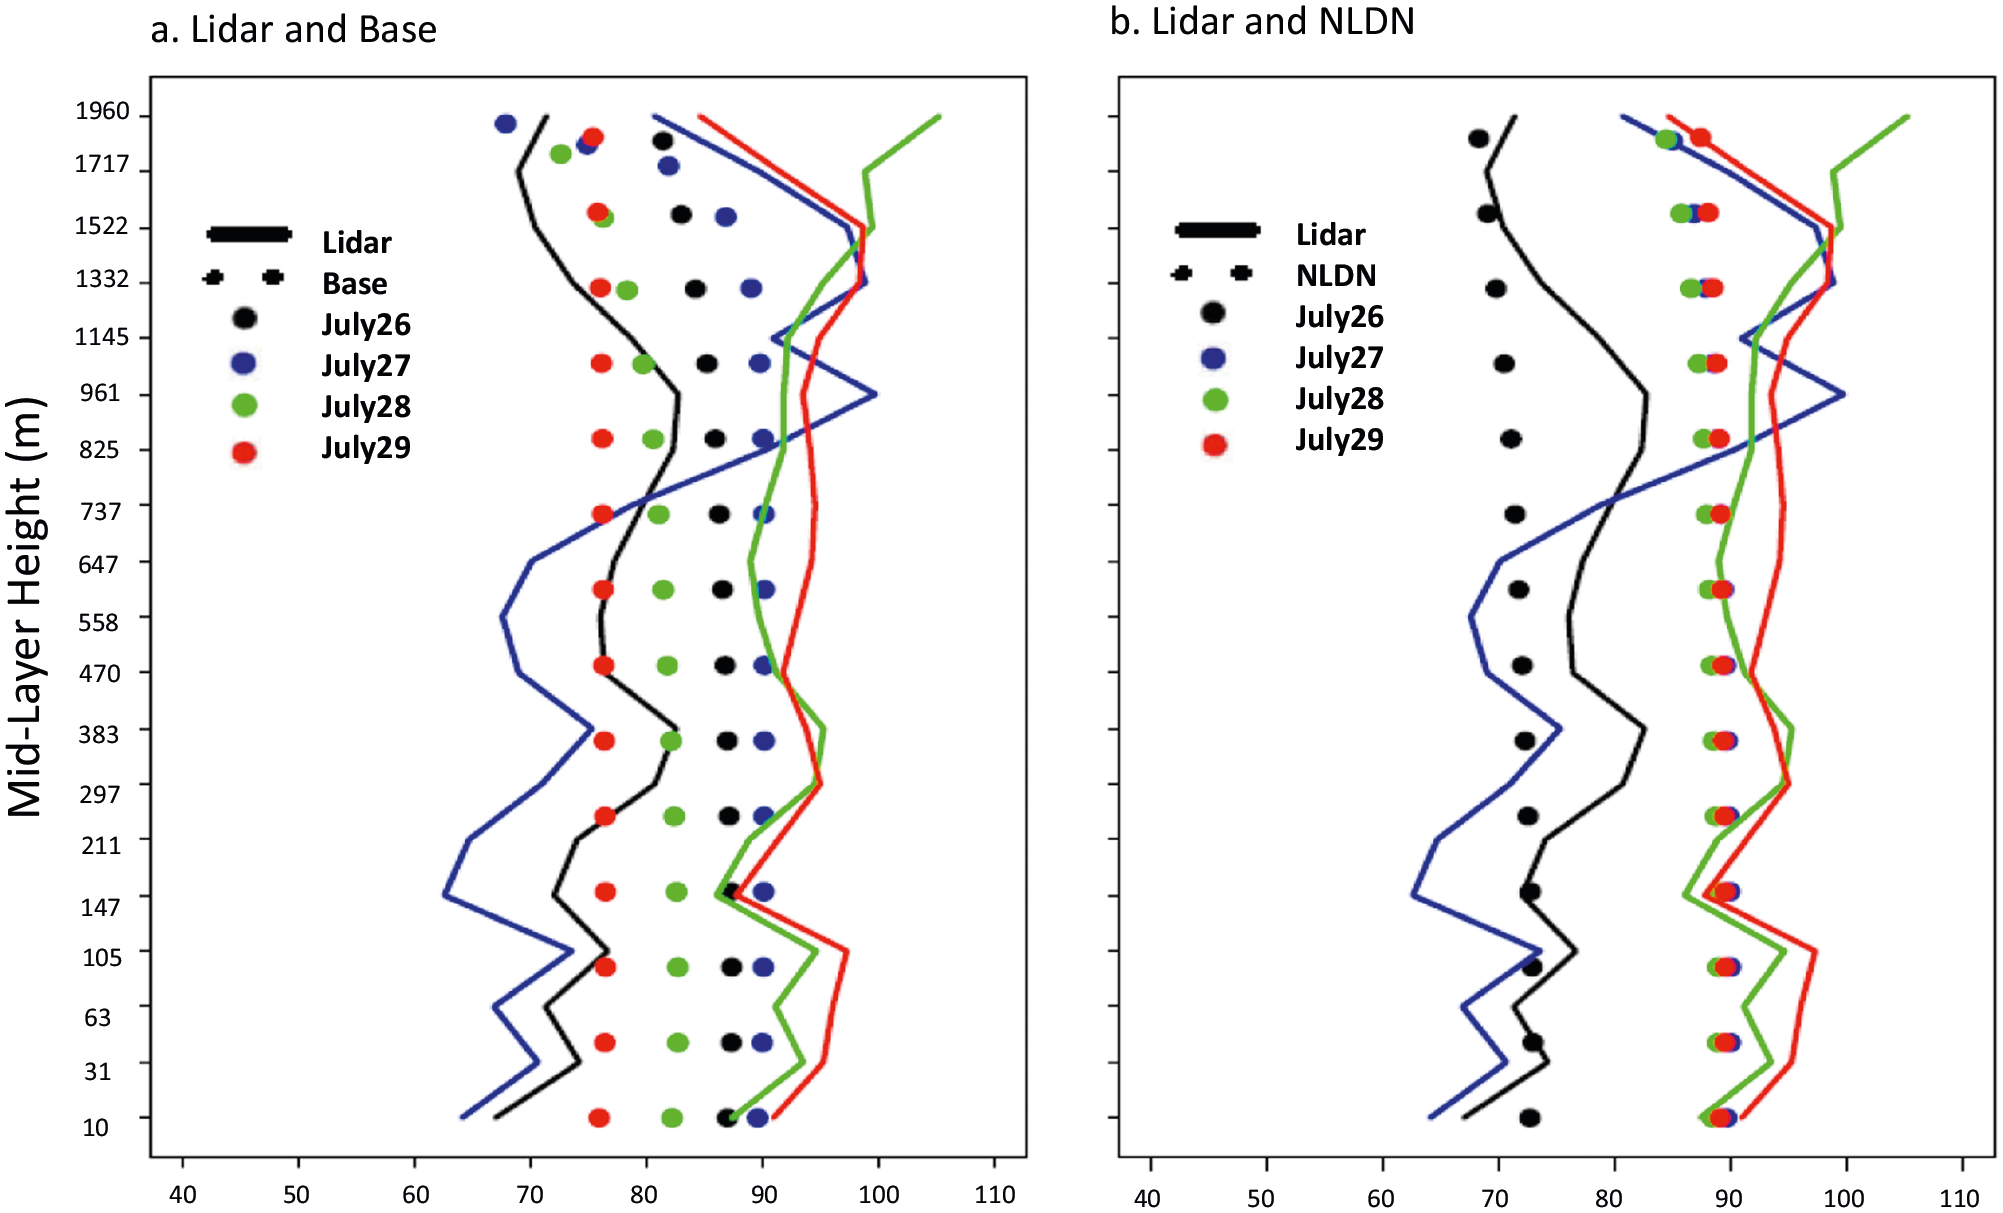
a Maximum O3 mixing ratios across the layers on each day over the episode (Lidar and Base), and b The same as a, but for Lidar and NLDN. Note that solid lines represent lidar measurements on different days while the circles are the model values.
The importance of lightning NOx as a modulator of tropospheric chemistry in the MWS region is further illustrated in Fig. 5 which presents the observed daily mean lightning flashes across the MWS region for the month of July for the years 2011 through 2016 (similar patterns are also observed for August as illustrated in the SI). Figure 6 shows the estimated NOx emissions released due to these lightning flash rates using the NOx production algorithm implemented in CMAQ.30,31 Similar intensity of lightning activity occurs every summer (Fig. 5) resulting in comparable amounts of lightning NOx emissions released into the atmosphere in the MWS region suggesting that summertime O3 levels in the region could be significantly modulated by this natural source.
Fig. 5.
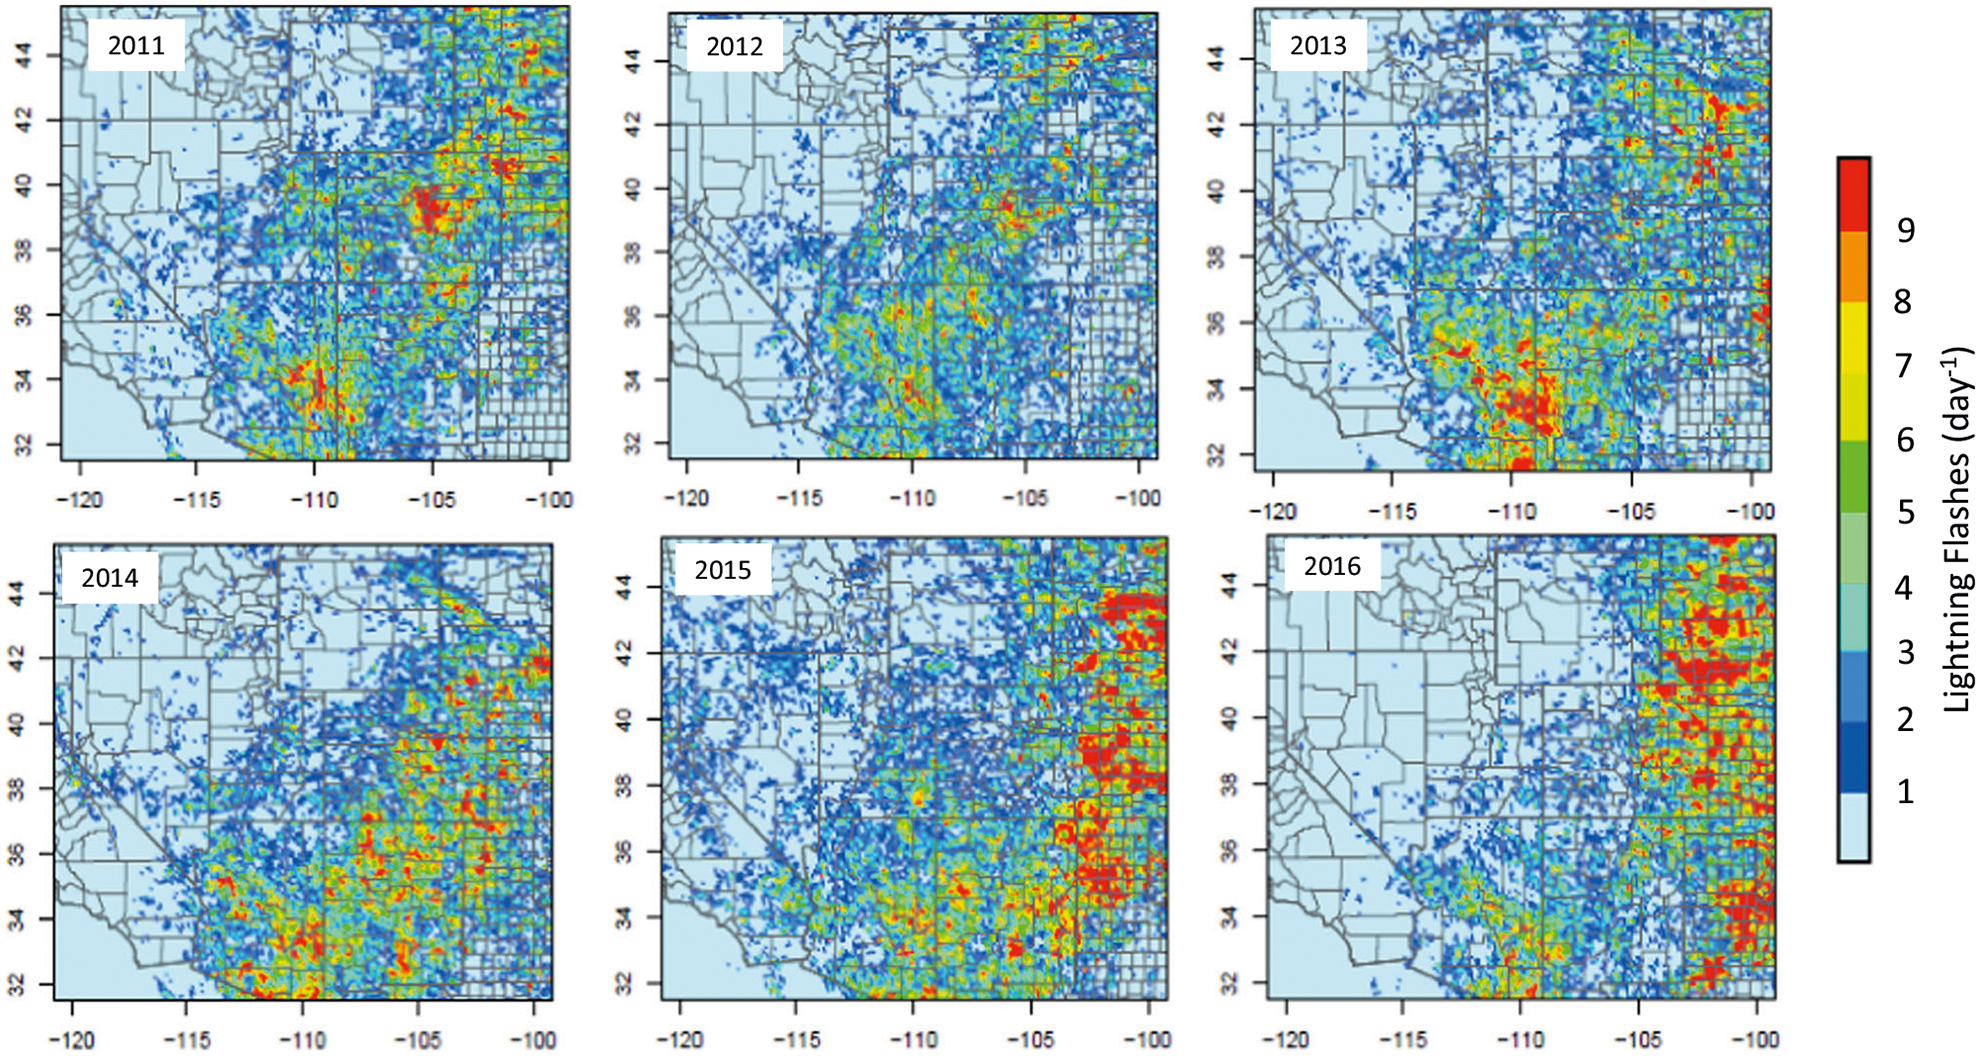
Daily mean lightning flashes over MWS during July from 2011 to 2016.
Fig. 6.
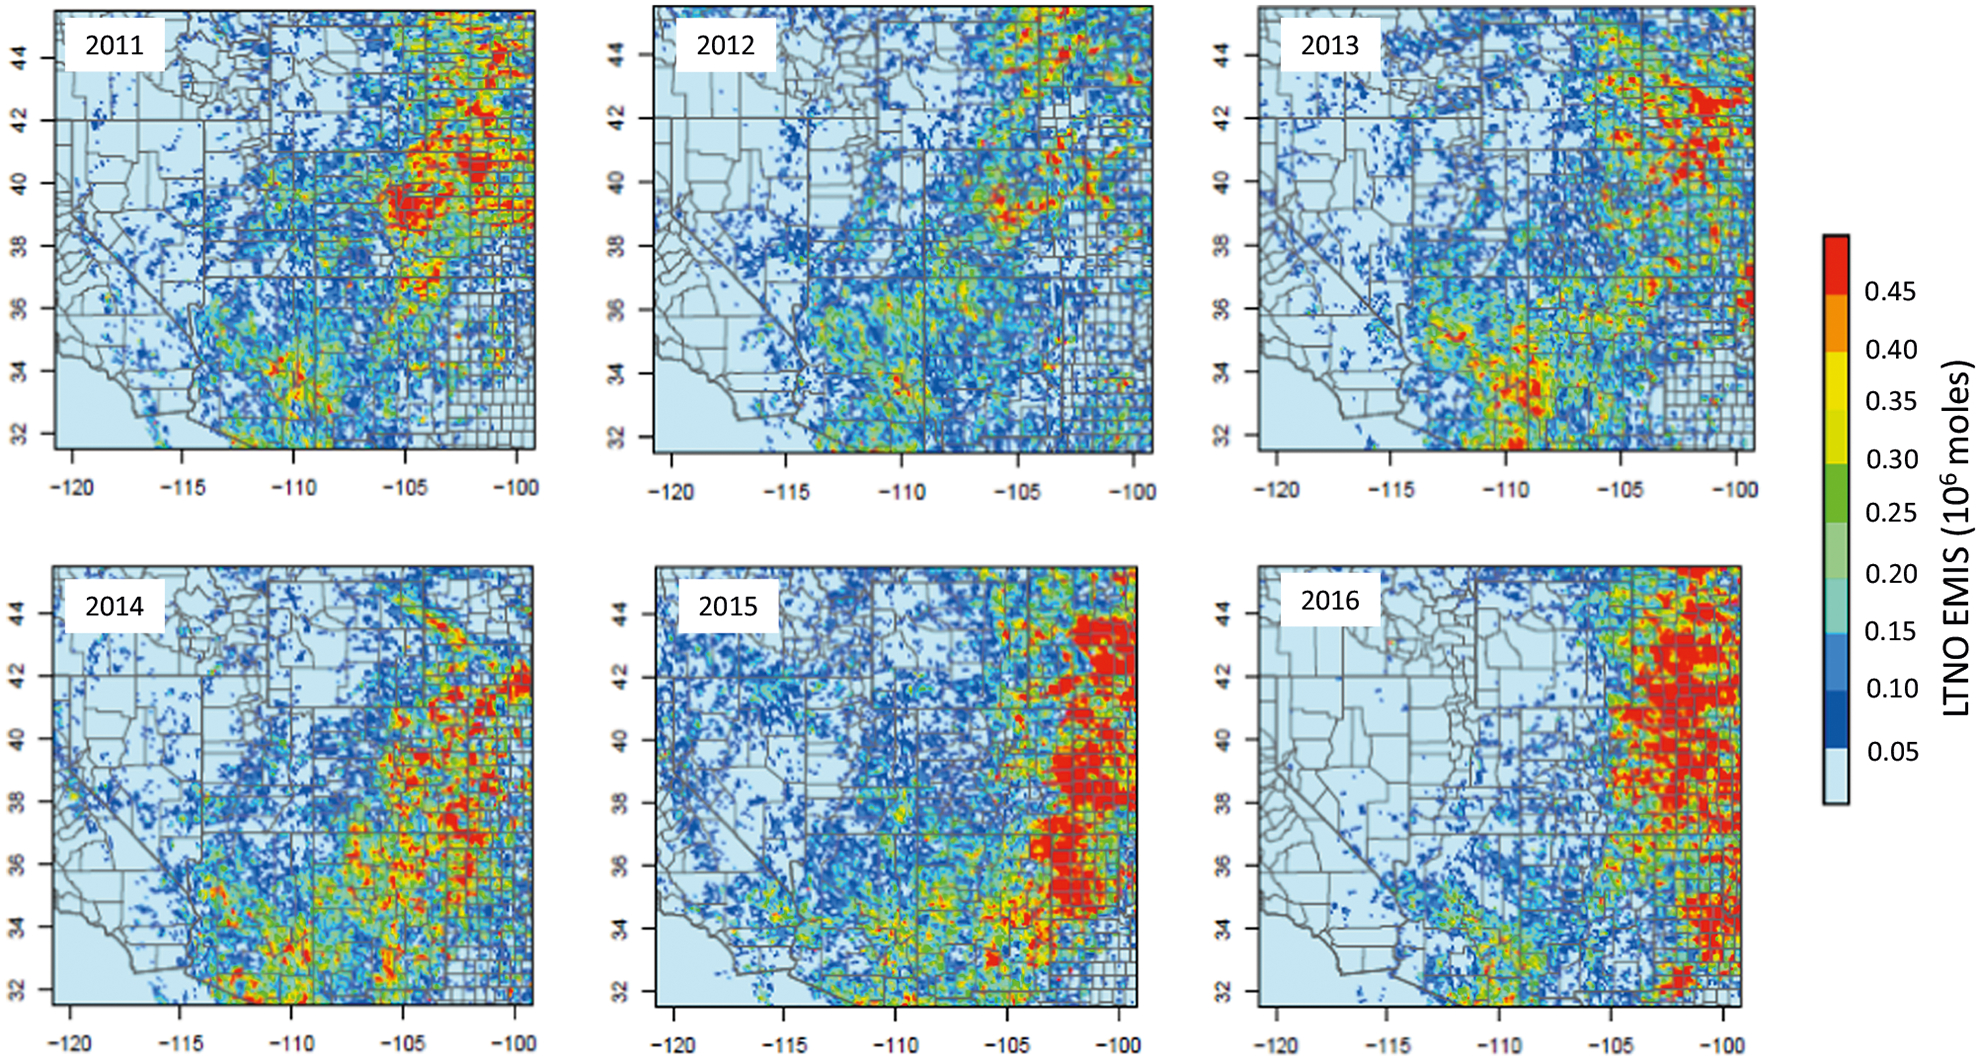
NOx emissions from lightning in July from 2011 to 2016 over MWS.
DISCUSSION
With the most up-to-date lightning NOx production schemes and the vertical distribution algorithm in CMAQ as described and evaluated in recent publications,30,31 we examined the importance of lightning NOx as a modulator of tropospheric chemistry in the U.S. Mountain West States. During summer, lightning NOx emissions provide a continuous NOx input to the airshed over the remote MWS region with average monthly contributions to the total NOx budget of 30%. As a result, significant impact on O3 air quality is both observed and confirmed through analysis of detailed model simulations with and without lightning NOx emissions and their detailed comparisons with available routine network and specialized field campaign observations of surface and aloft O3 in the region.
As revealed by the detailed model calculations for summer 2011, lightning NOx can contribute up to 21 ppb (or 43%) of the hourly values of surface-level O3 in the region. Given the comparable level of lightning activity in other years, similar levels of contribution of lightning to surface O3 across the region can be expected. More importantly, as technological advances and regulatory measures reduce anthropogenic NOx emissions in the region, the relative contributions of lightning NOx to O3 levels in the region may increase. Consequently, accurate quantification of lightning NOx emissions, its contribution to background O3 levels, and its role in modulating air quality in the region will become increasingly important.
METHODS
CMAQ simulations are performed for the April–September 2011 period over a domain encompassing the contiguous United States and discretized with 12 km horizontal grid spacing. The Base model configuration and simulation details are the same as those detailed in Kang et al.31 with the CB6 chemical mechanism and emissions input data from the 2011 NEI for 2011 simulations. For simulations during the year 2014, the emissions input data are still based on 2011 NEI with 2014 year-specific emissions for EGU (electric generating units), fire, and biogenic sectors from the three states (Colorado, Utah, and Wyoming) constituting the MWS study region. NOx emissions from electric generating units are based on Continuous Emissions Monitoring and thus are relatively well constrained. The NEI utilizes the MOVES (https://www.epa.gov/moves) modeling system which incorporates detailed information of motor vehicle fleets, miles traveled, fuel information, and the latest emission factors to estimate emissions from this sector. Emissions from wildfires are based on year-specific daily fire-activity from the Hazard Mapping System fire detections and the SMARTFIRE system (http://www.getbluesky.org/smartfire/docs/Raffuse2007.pdf). The lightning-induced NOx is calculated based on the NLDN observed cloud-to-ground (CG) lightning flashes that are gridded to the model grid as hourly total flashes, and intra-cloud (IC) flashes based on the climatological IC-to-CG ratio. The vertical distribution of lightning NOx release follows Kang et al.30 The lightning NOx production rate over land-based grid cells is set to 350 moles/stroke (this value is about the middle of the range suggested by recent studies13 that have explicitly reported lightning-NOx yields using observational constraints). To evaluate the performance of the two model cases for 2011, we compare simulated hourly and DM8HR O3 mixing ratios with corresponding measured values at sites from the air quality system network. To further examine the impact of lightning NOx emissions on atmospheric composition and chemistry we conducted model simulations for the period of the 2014 DISCOVER-AQ field campaign in Colorado and analyzed model time-height O3 distributions in conjunction with those inferred from lidar measurements taken by the National Oceanic and Atmospheric Administration’s Earth System Research Laboratory35,36 at BAO.
DATA AVAILABILITY
CMAQ model documentation and released versions of the source code, including all model code used in his study, are available at https://www.epa.gov/cmaq. The data processing and analysis scripts are available upon request. The WRF model is available for download through the WRF website (http://www.wrf-model.org/index.php). All data used to create the tables and illustrations in the manuscript are available at https://zenodo.org/record/3246375. Additional input/output data for CMAQ model utilized for this analysis are available through contact with the corresponding author. The lightning flash observation data in their native form are available for purchase from Vaisala Inc. (https://www.vaisala.com/en/products/systems/lightning-detection).
Supplementary Material
ACKNOWLEDGEMENTS
We thank ESRL/NOAA for making available the ozone lidar measurement. The authors thank Christian Hogrefe, James Kelly, and Thomas Pierce (U.S. EPA) for their constructive comments and suggestions during the internal review process. The views expressed in this paper are those of the authors and do not necessarily represent the views or policies of the U.S. EPA.
Footnotes
COMPETING INTERESTS
The authors declare no competing interests.
Supplementary information is available for this paper at https://doi.org/10.1038/s41612-020-0108-2.
Publisher’s note Springer Nature remains neutral with regard to jurisdictional claims in published maps and institutional affiliations.
REFERENCES
- 1.Lippmann M Health effects of ozone a critical review. JAPCA 39, 672–695 (1989). [DOI] [PubMed] [Google Scholar]
- 2.Arneth A et al. Terrestrial biogeochemical feedbacks in the climate system. Nature 3, 525–532 (2010). [Google Scholar]
- 3.Lu X et al. Severe surface ozone pollution in China: a global perspective. Environ. Sci. Tech. Lett 5, 487–494 (2018). [Google Scholar]
- 4.Sun L et al. Impacts of meteorology and emissions on summertime surface ozone increases over central eastern China between 2003 and 2015, atmos. Chem. Phys 19, 1455–1469 (2019). [Google Scholar]
- 5.Ding AJ, Wang T, Thouret V, Cammas J-P & Nédélec P Tropospheric ozone climatology over Beijing: analysis of aircraft data from MOZAIC program. Atmos. Chem. Phys 8, 1–13 (2008). [Google Scholar]
- 6.Haagen-Smit AJ Chemistry and physiology of Los Angeles smog. Ind. Eng. Res 44, 1342–1346 (1952). [Google Scholar]
- 7.Cooper OR, Langford OA, Parrish DD & Fahey DW Challenges of a lowered U.S. ozone standard. Science 348, 1096–1097 (2015). [DOI] [PubMed] [Google Scholar]
- 8.Zhang L et al. Sources contributing to background surface ozone in the US Intermountain West. Atmos. Chem. Phys 14, 5295–5309 (2014). [Google Scholar]
- 9.Jaffe DA & Ray J Increase in surface ozone at rural sites in the western US. Atmos. Environ 41, 5452–5463 (2007). [Google Scholar]
- 10.Simon H, Reff A, Wells B, Xing J & Frank N Ozone trends across the United States over a period of decreasing NOX and VOC emissions. Environ. Sci. Technol 49, 186–195 (2015). [DOI] [PubMed] [Google Scholar]
- 11.Cooper OR, Gao RS, Tarasick D, Leblanc T & Sweeney C Long-term ozone trends at rural ozone monitoring sites across the United States, 1990–2010. J. Geophys. Res. Atmos 10.1029/2012JD018261 (2012). [DOI] [Google Scholar]
- 12.Parrish DD et al. Long-term changes in lower tropospheric baseline ozone concentrations at northern mid-latitudes. Atmos. Chem. Phys 12, 11485–11504 (2012). [Google Scholar]
- 13.Murray LT Lightning NOX and impacts on air quality. Curr. Pollut. Rep 10.1007/s40726-016-0031-7 (2016). [DOI] [Google Scholar]
- 14.Ott LE et al. Production of lightning NOX and its vertical distribution calculated from three-dimensional cloud-scale chemical transport model simulations. J. Geophys. Res 10.1029/2009JD011880 (2010). [DOI] [Google Scholar]
- 15.Labrador LJ Strong sensitivity of the global mean OH concentration and the tropospheric oxidizing efficiency to the source of NOX from lightning. Geophys. Res. Lett 31, L06, 102 (2004). [Google Scholar]
- 16.Schumann U & Huntrieser H The global lightning-induced nitrogen oxides source. Atmos. Chem. Phys 7, 3823–3907 (2007). [Google Scholar]
- 17.Lamarque JF et al. Historical (1850–2000) gridded anthropogenic and biomass burning emissions of reactive gases and aerosols: methodology and application. Atmos. Chem. Phys 10, 7017–7093 (2010). [Google Scholar]
- 18.Clark SK, Ward DS & Mahowald NM Parameterization-based uncertainty in future lightning flash density. Geophys. Res. Lett 10.1002/2017GL073017 (2017). [DOI] [Google Scholar]
- 19.Luo C, Wang Y & Koshak WJ Development of a self-consistent lightning NOX simulation in large-scale 3-D models. J. Geophys. Res. Atmos 10.1002/2016/JD026225 (2017). [DOI] [Google Scholar]
- 20.Finney DL, Doherty RM, Wild O & Abrham NL The impact of lightning on tropospheric ozone chemistry using a new global lightning parameterization. Atmos. Chem. Phys 16, 7507–7522 (2016). [Google Scholar]
- 21.Tost H, Joeckel PJ & Lelieveld J Lightning and convection parameterizations-uncertainties in global modeling. Atmos. Chem. Phys 7, 4553–4568 (2007). [Google Scholar]
- 22.Pickering KE, Wang Y, Tao WK, Price C & Muller JF Vertical distributions of lightning NOX for use in regional and global chemical transport models. J. Geophys. Res 103, 31204–31216 (1998). [Google Scholar]
- 23.Wang L et al. Estimating the influence of lightning on upper tropospheric ozone using NLDN lightning data and CMAQ model. Atmos. Environ 67, 219–228 (2013). [Google Scholar]
- 24.Miyazaki K, Eskes HJ, Sudo K & Zhang C Global lightning NOx production estimated by an assimilation of multiple satellite data sets. Atmos. Chem. Phys 14, 3277–3305 (2014). [Google Scholar]
- 25.Kaynak B et al. The effect of lightning NOx production on surface ozone in the continental United States. Atmos. Chem. Phys 8, 5151–5159 (2008). [Google Scholar]
- 26.Heath NK, Pleim JE, Gilliam RC & Kang D A simple lightning assimilation technique for improving retrospective WRF simulations. J. Adv. Model. Earth Syst 10.1002/2016MS000735 (2016). [DOI] [PMC free article] [PubMed] [Google Scholar]
- 27.Allen DJ et al. Impact of lightning-NO on eastern United States photochemistry during the summer of 2006 as determined using the CMAQ model. Atmos. Chem. Phys 12, 1737–1758 (2012). [Google Scholar]
- 28.Byun DW & Schere KL Review of the governing equations, computational algorithms, and other components of the models-3 community multiscale air quality (CMAQ) modeling system. Appl. Mech. Rev 59, 51–77 (2006). [Google Scholar]
- 29.Appel KW et al. Description and evaluation of the community multiscale air quality (CMAQ) modeling system version 5.1. Geosci. Model Dev 10, 1703–1732 (2017). [DOI] [PMC free article] [PubMed] [Google Scholar]
- 30.Kang D et al. Simulating lightning NOx production in CMAQ: evolution of scientific updates. Geosci. Model Dev 12, 3071–3083 (2019). [DOI] [PMC free article] [PubMed] [Google Scholar]
- 31.Kang D et al. Simulating lightning NO production in CMAQv5.2: performance evaluations. Geosci. Model Dev 12, 4409–4424 (2019). [DOI] [PMC free article] [PubMed] [Google Scholar]
- 32.Cummins KL et al. A combined TOA/MDF technology upgrade of the U.S. National lightning detection network. J. Geophys. Res 103, 9035–9044 (1998). [Google Scholar]
- 33.Nag A, Murphy MJ, Cummins KL, Pifer AE & Cramer A Recent evolution of the U.S. National Lightning Detection Network. 23rd International Lightning Detection conference & 5th International Lightning Meteorology Conference, 18–21 March, Tucson, Arizona (2014). [Google Scholar]
- 34.Travis KR et al. Why do models overestimate surface ozone in the Southeast United States? Atmos. Chem. Phys 16, 13561–13577 (2016). [DOI] [PMC free article] [PubMed] [Google Scholar]
- 35.Sullivan JT et al. Lidar observations revealing transport of O3 in the presence of a nocturnal low-level jet: Regional implications for “next-day” pollution. Atmos. Environ 158, 160–171 (2017). [Google Scholar]
- 36.Wang L et al. Evaluation of lightning-induced tropospheric ozone enhancements observed by ozone lidar and simulated by WRF/Chem. Atmos. Environ 115, 185–191 (2015). [Google Scholar]
Associated Data
This section collects any data citations, data availability statements, or supplementary materials included in this article.
Supplementary Materials
Data Availability Statement
CMAQ model documentation and released versions of the source code, including all model code used in his study, are available at https://www.epa.gov/cmaq. The data processing and analysis scripts are available upon request. The WRF model is available for download through the WRF website (http://www.wrf-model.org/index.php). All data used to create the tables and illustrations in the manuscript are available at https://zenodo.org/record/3246375. Additional input/output data for CMAQ model utilized for this analysis are available through contact with the corresponding author. The lightning flash observation data in their native form are available for purchase from Vaisala Inc. (https://www.vaisala.com/en/products/systems/lightning-detection).


