

Abstract
Little is known concerning the effects of abiotic factors on in vivo RNA structures. We applied Structure-seq to assess the in vivo mRNA structuromes of Arabidopsis thaliana under salinity stress, which negatively impacts agriculture. Structure-seq utilizes dimethyl sulfate reactivity to identify As and Cs that lack base-pairing or protection. Salt stress refolded transcripts differentially in root versus shoot, evincing tissue specificity of the structurome. Both tissues exhibited an inverse correlation between salt stress-induced changes in transcript reactivity and changes in abundance, with stress-related mRNAs showing particular structural dynamism. This inverse correlation is more pronounced in mRNAs wherein the mean reactivity of the 5′UTR, CDS, and 3′UTR concertedly change under salinity stress, suggesting increased susceptibility to abundance control mechanisms in transcripts exhibiting this phenomenon, which we name “concordancy.” Concordant salinity-induced increases in reactivity were notably observed in photosynthesis genes, thereby implicating mRNA structural loss in the well-known depression of photosynthesis by salt stress. Overall, changes in secondary structure appear to impact mRNA abundance, molding the functional specificity of the transcriptome under stress.
Keywords: RNA structure, salinity, Structure-seq, structurome, tissue-specific
INTRODUCTION
Transcriptome analyses often center on measuring changes in mRNA abundance invoked by a stimulus, stress, or developmental process (Walley and Dehesh 2010). In particular, regulation of mRNA abundance by the epigenome (Jiang et al. 2014; Wong et al. 2017) and by transcription factors (Song et al. 2016) has been a primary focus in elucidation of mechanisms responsible for dynamic environmental regulation of the transcriptome. Post-transcriptional regulation, including alternative polyadenylation, splicing, localization, and degradation has received less attention, but also can substantially impact mRNA abundance (Floris et al. 2009; Walley and Dehesh 2010; Feng et al. 2015; Kawa and Testerink 2017; Wong et al. 2017; Gu et al. 2018; Sorenson et al. 2018). Changes in mRNA secondary and tertiary structures influence post-transcriptional processes (Bevilacqua et al. 2016), as revealed by many examples based on in depth analysis of specific transcripts (Zaug and Cech 1995; Hull et al. 2016). More recently, techniques have become available to query mRNA structure in vivo and genome-wide (Ding et al. 2014; Rouskin et al. 2014; Talkish et al. 2014; Wan et al. 2014), which allows the possibility to elucidate general principles underlying relationships between mRNA structure, post-transcriptional regulation, and transcript abundance.
Plants, as poikilothermic multicellular organisms subject to many extreme environmental stressors known to affect RNA structure in vitro (Lambert and Draper 2007), provide an ideal system in which to study in vivo RNA structure and its regulation by tissue-type and environment. Accordingly, here we utilized Structure-seq to resolve the in vivo structuromes of shoot and root tissue of the model plant species, Arabidopsis thaliana, under both unstressed and salt stressed conditions. Structure-seq (Ding et al. 2014; Ritchey et al. 2017) employs dimethyl sulfate (DMS) (Tijerina et al. 2007) as a chemical probe of in vivo RNA secondary structure. DMS methylates unpaired and unprotected adenosines (As) and cytosines (Cs) on the Watson–Crick (WC) face, blocking subsequent reverse transcription. The resulting truncated complementary DNAs (cDNAs) are analyzed by next-generation sequencing methods, reading out a reverse transcription stop one position prior to each DMS-modified nucleobase.
Salinity (NaCl) stress is one of the most common environmental stresses affecting crop productivity worldwide (Roy et al. 2014). Elevated soil salinity affects 932 million hectares (Rengasamy 2006) of agricultural fields (roughly the size of the entire United States) and causes US$ 27.3B in crop losses annually (Tester and Davenport 2003; Qadir et al. 2014). Saline soils cause cellular dehydration by thermodynamically opposing plant water uptake, and Na+ and Cl− accumulation in plant tissues negatively affects plant growth by hampering metabolic processes, disrupting K+ homeostasis, promoting oxidative stress, and reducing photosynthetic efficiency (Tester and Davenport 2003; Abogadallah 2010; Deinlein et al. 2014). Non-selective cation channels are a major conduit for Na+ entry into plant cells (Isayenkov and Maathuis 2019); conversely, the Na+/H+ antiporter, SOS1/NHX7, exports Na+ ions (Zhu 2002). Classic genetic screens revealed that null mutation not only of SOS1, but also of a serine-threonine kinase, SOS2, or of a Ca2+ binding protein, SOS3, result in hypersensitivity to saline conditions (Zhu 2002) identifying Ca2+- and kinase-dependent processes in salinity sensing. In addition, recent studies have implicated the receptor-like kinase (RLK) FERONIA (FER) and its peptide ligand, RALF1, in cellular responses that regulate cell wall integrity and seedling growth under salt stress (Feng et al. 2018; Yu and Assmann 2018).
In addition to transport and cell signaling events triggered by Na+, salt stress has dramatic impacts on the transcriptome of Arabidopsis (Kreps et al. 2002; Anderson et al. 2018) as well as on the transcriptomes of important crops such as maize (Zhang et al. 2015), rice (Wang et al. 2018), tomato (Sun et al. 2010), barley (Bahieldin et al. 2015), sorghum (Cui et al. 2018), and cotton (Zhu et al. 2018). Transcript abundance reflects the balance between mRNA transcription and mRNA turnover, and post-transcriptional regulation is known to play vital roles in plant responses to environmental factors (Floris et al. 2009). For example, salt stress changes alternative splicing patterns (Feng et al. 2015) and mRNA decay pathways as assessed in Arabidopsis and other species (Kawa and Testerink 2017), which provides layers of regulation on the transcriptome and encoded proteome (Floris et al. 2009).
Based on in vitro studies, salt is generally known to enhance RNA folding and disrupt RNA–protein interactions (Bloomfield et al. 2000), with implications for salt balance in both plants and metazoans. RNA structure in vitro is also known to be unfolded by proline (Lambert and Draper 2007), a compatible solute synthesized in plants during salt stress (Tester and Davenport 2003). However, the impact of salt stress on RNA structures in vivo, both individually and as emergent properties of the RNA structurome, has not been studied in any organism. Our results, presented here, reveal compelling tissue-specific and stress-modulated aspects of the mRNA structurome, with attendant implications for mechanisms of post-transcriptional regulation.
RESULTS
NaCl treatment and Structure-seq library preparation and evaluation
We applied our Structure-seq2 protocol (Ritchey et al. 2017; Su et al. 2018) to 24-d-old hydroponically grown Arabidopsis with or without treatment with 100 mM NaCl for 48 h. We confirmed the effectiveness of this salt stress treatment by observation of reduced rosette growth (Fig. 1A vs. B) and by significant increases in proline and Na+ content in our salt-stressed plants (see below).
FIGURE 1.

The effect of salt stress on Arabidopsis phenotypes and structurome coverage. (A,B) 24-d-old hydroponically grown Arabidopsis (A) exhibits growth reduction (B) after exposure to 48 h of 100 mM NaCl stress. (C) Total number of transcripts with Structure-seq coverage within and between each tissue and condition surveyed. (D) Differences in reactivity at a single-nucleotide resolution on the transcript of FERONIA (AT3G51550.1) between shoot and root under control conditions. White dashed lines indicate the boundaries of the 5′UTR, CDS, and 3′UTR.
Custom Structure-seq libraries (Supplemental Fig. S1, three independent biological replicates per condition) were generated from plants subjected to control and salt stress conditions (See Materials and Methods). Ultimately, we had 16,699 and 16,872 mRNAs that met criteria (See Materials and Methods) to derive reliable DMS reactivity under control and salt conditions in shoot tissue, and 17,282 and 16,334 corresponding mRNAs in root tissue (Fig. 1C). Among all four data sets, a remarkable 12,978 mRNAs had sufficient coverage in all tissues and conditions (Fig 1C), allowing structural comparison of a set of common mRNAs. Reactivity data on all transcripts and transcript regions (5′UTR, CDS, 3′UTR) used in all analyses are available (Supplemental Data 1, 2), and are searchable by their At locus identifier. The single-nucleotide resolution of Structure-seq, and its ability to resolve reactivities of all three canonical eukaryotic transcript regions (5′UTR, CDS, 3′UTR) is illustrated in Figure 1D, depicting the difference of reactivity of FERONIA (AT3G51550.1) for each A and C nucleotide between shoot and root control conditions. FERONIA (FER) encodes a receptor-like kinase (Haruta et al. 2014) that perceives RALF peptide ligands; both FER and RALF are essential elements in salinity response (Feng et al. 2018; Yu and Assmann 2018).
Tissue-specific alteration of the mRNA structurome by salt stress
We took advantage of the genome-wide nature of Structure-seq data to determine universal structural trends in salt stress response. For the majority of these analyses, we deliberately focus on DMS reactivity changes, as the most direct readout of changes in the structurome. We observe a small but significant decrease in the average mean transcript reactivity in shoot following salt stress (t.test P = 1.80 × 10⁻¹⁰; Table 1; Fig. 2A; Supplemental Data 3: Table S1A), while in root we observe the opposite trend, with an appreciable increase in the average mean reactivity of transcripts following salt stress (t.test P < 2.20 × 10⁻¹⁶; Table 1; Fig. 2B; Supplemental Data 3: Table S1A). The distributions of per transcript change of mean reactivity (Fig. 2C) illustrate the tissue specificity of salt stress-induced change.
TABLE 1.
Summary of reactivity changes

FIGURE 2.

Structuromes are tissue-specific and converge upon NaCl stress. We compared the distributions of mean reactivity of each transcript as box-violins. (A,B) Distributions of transcript mean DMS reactivity are plotted for intra-tissue (control vs. NaCl) comparisons, with control conditions colored in blue and NaCl-treated in yellow. Each line represents the change in mean reactivity between distributions of one transcript; strong changes (≥0.075) have a more intense shading to highlight differences. (C) The distribution of per transcript Δ mean reactivity after NaCl treatment is negative in shoot (decrease of DMS reactivity) and positive in root (increase of DMS reactivity). (D,E) Distributions of mean reactivity are plotted for inter-tissue (shoot vs. root) comparisons, with shoot conditions colored in blue and root in yellow. (F) The distribution of per transcript mean Δ reactivity between shoot and root is negative in both conditions, but less extreme under NaCl stress, illustrating structurome convergence under NaCl stress. A statistical summary of these results can be found in Table 1 and Supplemental Data S3: Table S1A. Additional plots detailing transcript regions (5′UTR, CDS, 3′UTR) are provided (Supplemental Figs. S2, S4)
Studies on yeast and mammalian cells (Kertesz et al. 2010; Wan et al. 2012, 2014; Rouskin et al. 2014), as well as on rice seedlings (Su et al. 2018), have indicated that RNA structure is not uniform along the length of mRNAs. We accordingly separated our whole transcript reactivity data into distinct transcript regions (5′UTR, CDS, 3′UTR) in both shoot and root and compared them in the same fashion as whole transcripts (Table 1; Supplemental Fig. S2; Supplemental Data 3: Table S1A). In both tissues, 5′UTRs and 3′UTRs exhibit greater standard deviation in mean reactivity than the CDS in both control and stress conditions, suggesting that UTR regions are more structurally malleable than CDS regions. These results highlight the potential of UTRs as structural mediators of regulation, consistent with their multiple functions (Srivastava et al. 2018). We also calculated the Gini index of reactivity (Rouskin et al. 2014) as an additional metric of variability between conditions (Supplemental Fig. S3; Supplemental Data 3: Table S1C).
Root and shoot structuromes converge following NaCl stress
A comparison of the composite shoot and root structuromes against each other in both control and salt stressed conditions revealed noteworthy patterns. We found a strong trend wherein the global average of the mean transcript reactivity (Table 1; Fig. 2D,E; Supplemental Data 3: Table S1A) and the mean reactivity of each transcript region (5′UTR, CDS, 3′UTR; Table 1; Supplemental Fig. S4; Supplemental Data 3: Table S1A), is distinctly lower in root as compared to shoot (t.test P < 2.20 × 10⁻¹⁶, all regions). This trend is evident under both control (Fig. 2D) and salt stress (Fig. 2E) conditions. However, while these differences between the global averages of shoot and root transcripts persist under salt stress, they become smaller, because the shoot transcriptome decreases in mean DMS reactivity (Fig. 2A) while the root transcriptome increases in mean reactivity under salt stress (Fig. 2B). The density of change between shoot and root is shifted closer to the 0.0 line under salt stress relative to control conditions (Fig. 2F), illustrating this convergence. To elaborate on this concept of structurome relatedness under stress, we found that every inter-tissue correlation (whole transcript, 5′UTR, CDS, 3′UTR) had a stronger correlation coefficient in salt stress than in control (Table 1; Supplemental Data 3: Table S1A). Thus, transcript structures appear more similar between tissues in salt stress than in control conditions. To further compare these and proceeding correlations, we used Fisher Z-tests; in this case, verifying the correlations for transcripts, and each region between tissues were indeed stronger in salt (Supplemental Data 3: Table S1A). Additionally, we did a parallel analysis correlating the abundances of transcripts (See Materials and Methods) between tissues in both conditions (Supplemental Data 3: Table S1B), demonstrating that, at least among transcripts present and resolvable in both tissues, their abundances were more different in salt than in control, though their mean reactivities were more similar. We also calculated the Gini index of reactivity (Rouskin et al. 2014) as an additional metric of variability between tissues (Supplemental Fig. 5; Supplemental Data 3: Table S1C).
We sought to identify the physiological/biophysical basis of structurome convergence under salt stress. Proline, a denaturant of RNA secondary structure (Lambert and Draper 2007), is commonly accumulated in plants as a compatible solute following salt stress (Tester and Davenport 2003). We also observed this phenomenon in both shoots and roots (Fig. 3A; Supplemental Data 3: Table S2A). Metal ions, including Na+ and K+, also impact RNA structure (Bloomfield et al. 2000). We quantified significantly increased Na+ content in both shoots and roots of NaCl-treated plants (Fig. 3B; Supplemental Data 3: Table S2B). Root tissue often shows decreased K+ content post-salt stress (Sun et al. 2015; Yu and Assmann 2015). We also observed this phenomenon (Fig. 3C); shoot and root K+ content differed significantly under control conditions, but converged to statistically identical levels under salt stress (Fig. 3C; Supplemental Data 3: Table S3). These solute changes further confirm the efficacy of our salt treatments. The observation that RNA refolding cosolutes, proline, sodium, and potassium, are present at similar levels in both tissues post salt-stress provides a possible mechanistic explanation for the stress-induced convergence of shoot and root mRNA structuromes (see Discussion).
FIGURE 3.

Root and shoot ion content converges after 48 h of NaCl stress. (A–C) NaCl stress significantly increases the proline and sodium content of both shoots and roots, while significantly reducing the potassium content of roots, resulting in convergence of ion content between shoot and root under NaCl treatment. (D–H) NaCl stress (D) significantly decreases magnesium content in shoots, (E) significantly decreases phosphorus content in roots, (F) has no significant effect on manganese content, (G) significantly decreases zinc content in roots, and (H) significantly decreases iron content in roots. All accompanying measurements and statistics are provided (Supplemental Data S3: Tables S2A,B) as well as analysis of these data via ANOVA (Supplemental Data S3: Table S3). Different letters used in the figures indicate P < 0.05 between treatments or tissues via t.test.
Tissue-type strongly influences the RNA structurome
To further assess the impact of tissue type on the RNA structurome, we compared all of the intra-tissue (control vs. salt stress) correlations to the inter-tissue correlations (shoot vs. root) (Supplemental Data 3: Table S1A). These comparisons reveal that control and salt-stressed structuromes within a tissue are more related than are the shoot and root structuromes within a condition. In other words, tissue is a stronger determinant of the structurome than salt stress, although both are significant. This pattern was confirmed via a combined ANOVA approach (see Materials and Methods; Supplemental Fig. 6; Supplemental Data 3: Table S4).
Within each intra-tissue comparison, we next divided transcripts into two categories: (i) those found only in shoot or only in root in our data sets, approximating transcripts that are tissue-specific (unique), and (ii) those present in both tissues (shared). Then, in each tissue, we compared several metrics between unique and shared transcripts (Supplemental Data 3: Table S5A, S5B). Shoot unique transcripts showed 24% more DMS reactivity change in response to salt (t.test P < 2.20 × 10⁻¹⁶) and root unique transcripts showed 12% more reactivity change in response to salt (t.test P = 6.91 × 10−06) than shared transcripts, that is, the absolute value of mean salt-induced reactivity change was higher in both sets of unique transcripts compared to their respective shared sets, suggesting greater plasticity in the former. These results reinforce an interaction between tissue type and stress in determination of RNA structure, as confirmed by ANOVA.
Salinity-induced DMS reactivity changes inversely correlate with mRNA abundance changes
To assess a possible relationship between salinity effects on transcript structure and transcript abundance we compared changes in mean transcript reactivity between control and salt conditions (Δ reactivity) to changes in transcript abundance between control and salt conditions (Δ abundance), with the latter calculated from respective −DMS libraries and expressed as log2 (TPM) (transcripts per kilobase-million). We performed this analysis in both shoot and root, for whole transcripts and each transcript region (Table 2A; Fig. 4A–D; Supplemental Fig. S7; Supplemental Data 3: Table S6A).
TABLE 2.
Δ mean reactivity vs. Δ abundance correlations

FIGURE 4.

Change in DMS reactivity inversely correlates with change in abundance. (A–D) For each transcript and transcript region in shoot, we assessed the relationship between change in mean DMS reactivity (Δ mean reactivity, NaCl-treatment mean reactivity − control mean reactivity, x-axis) and change in relative abundance [Δ abundance, log2(TPMNaCl) − log2(TPMcontrol), y-axis] between control and NaCl treatment. This revealed a strong inverse correlation (Table 2A; Supplemental Data 3: Table S6A). (E–H) Transcripts that share the same sign of Δ mean reactivity amongst their 5′UTR, CDS, and 3′UTR regions were subset as concordant. For each transcript and transcript region of these fully concordant transcripts, we assessed the relationship between the change in mean reactivity (Δ mean reactivity, NaCl mean reactivity − control mean reactivity, x-axis) and the change in relative abundance [Δ abundance, log2(TPMNaCl) − log2(TPMcontrol), y-axis] between control and NaCl-treatment in shoot, revealing a strong enhancement of the inverse correlation in all regions (Table 2C; Supplemental Data 3: Table S6A,D). The identical analyses for root data are provided (Supplemental Fig. S7).
We found a prominent inverse correlation between Δ reactivity and Δ abundance (P < 2.20 × 10⁻¹⁶, both tissues, all regions). In each tissue, whole transcript (Fig. 4A) and CDS (Fig. 4C) showed the strongest negative correlation, followed by 5′UTR (Fig. 4B) and lastly 3′UTR (Fig. 4D) with root results mirroring this trend (Supplemental Fig. S7). The relationship was stronger in each shoot comparison than in each root comparison (e.g., whole transcript shoot r = −0.73, root r = −0.58). In both root and shoot, tissue-specific transcripts exhibited stronger correlations than tissue-shared transcripts (Table 2B; Supplemental Data 3: Table S6B; see Discussion).
Concordancy of transcript regions strengthens the inverse relationship between reactivity changes and abundance changes
The observation that the strongest inverse correlation of Δ reactivity to Δ abundance occurred in the CDS (Table 2A; Fig. 4; Supplemental Data 3: Table S6A) was unexpected given that previous analyses appear to implicate UTRs as more structurally dynamic and tied to mechanisms of mRNA turnover (Narsai et al. 2007; Wan et al. 2012; Su et al. 2018). To further assess the influence of UTRs, we developed a new principle and coined the term “concordancy.” We define transcripts as concordant if all three transcript regions (5′UTR, CDS, 3′UTR) share the same sign of Δ reactivity in response to salt stress, that is, transcripts wherein all three transcript regions show either an average increase or an average decrease in DMS reactivity. Conversely, transcripts were defined as discordant if all three regions did not share the same sign of Δ reactivity. In both shoot and root, we compared the Δ reactivity of each region against the Δ reactivity of each other region in the transcript (5′UTR:CDS, 3′UTR:CDS, 5'UTR:3'UTR) (Supplemental Figs. S8, S9 [left-most columns]; Supplemental Data S3: Table S6C), finding no overall relationship between the reactivity change between specific pairs of transcript regions.
We parsed out transcripts wherein all three transcript regions were concordant in their salt-induced reactivity changes. Out of the 15,875 shoot and 15,725 root transcripts resolved, 3155 and 3175, respectively, were fully concordant (∼20%), leaving 12,720 and 12,550 (∼80%) that were discordant (meaning two of the three regions have different changes in reactivity in response to NaCl relative to the third region). Thus, concordancy amongst all regions of a transcript is uncommon.
When all regions are concordant in their direction of NaCl-induced change in reactivity both whole transcripts and each transcript region show a stronger Δ reactivity to Δ abundance correlation (Table 2C; Fig. 4E–H; Supplemental Fig. S7; Supplemental Data S3: Table S6D), as evidenced by stronger r values for each respective correlation (Fig. 4E–H as compared to Fig. 4A–D). The impact of concordancy is observed in both shoot (Fig. 4) and root tissues (Table 2C, Supplemental Fig. S7; Supplemental Data S3: Table S6D, P < 2.20 × 10⁻¹⁶, both tissues, all regions): for example, concordant whole transcripts shoot r = –0.82, root r = –0.65, contrasted to all transcripts whole transcript shoot r = –0.73, root r = –0.58 (Fig. 4; Supplemental Fig. S7). Interplay, that is, pairwise concordancy, between the structuredness of two different transcript regions (5′UTR, CDS, 3′UTR) can also strengthen the Δ reactivity versus Δ abundance relationship (Supplemental Figs. S8 [shoot] and S9 [root]; Supplemental Data 3: Table S6E).
Of the 3155 and 3175 fully concordant transcripts in shoot and root, respectively, 2596 (∼82%) and 2688 (∼84%) were present in both tissues, but only 628 (∼23%) of these shared transcripts were fully concordant in both tissues, suggesting that tissue-type is a strong determinant of a transcript's concordancy. Within this small set of 628 concordant shared transcripts, only 321 (∼51%) also showed the same direction of concordancy change in both tissues (Supplemental Data S3: Table S7), further pointing toward tissue specificity of the concordancy relationship.
Abundant transcripts preferentially show reactivity increases and abundance losses
When we assess our individual structuromes for the relationship between whole transcript mean reactivity and transcript abundance, we find a strong positive correlation (Supplemental Fig. S10) which is further confirmed in our contrasted structuromes (Fig. 5A; Supplemental Fig. S11; Supplemental Data 3: Tables S8A,B), that is, those used to investigate how this relationship is affected by changes between conditions. Gregory and coworkers reported a similar relationship based on in vitro structurome analysis (Li et al. 2012). These results may seem to be in contradiction with our in vivo observations of an inverse relationship governing changes in these two parameters. Our further investigation resolved this apparent paradox as follows. Transcripts that increase in reactivity in response to salt stress have a higher mean abundance in control conditions compared to transcripts that decrease in reactivity [Fig. 5B, Mean log2(TPM) increases 4.56, decreases 3.61, t.test P = 2.2 × 10⁻¹⁶)]. Transcripts that decrease in abundance in response to salt stress also have a higher mean abundance in control conditions compared to transcripts that increase in abundance under salt [Fig. 5C, Mean log2(TPM) decreases 5.07, increases 3.65, t.test P = 2.2 × 10⁻¹⁶]. The 5% most extreme changes of reactivity (Fig. 5B) and abundance (Fig. 5C) in shoot highlight these patterns; root data exhibited largely parallel results (Supplemental Fig. S11; Supplemental Data 3: Table S8C). Taken together, highly abundant (i.e., high reactivity) transcripts disproportionately increase in reactivity and decrease in abundance under salt stress. In other words, the transcripts undergoing a loss in abundance, correlated with an increase in reactivity, were abundant to start with. Conversely, low abundance (i.e., low reactivity) transcripts disproportionately further decrease in reactivity and increase in abundance following salt stress. As an additional validation of this trend, insuring it was not a methodological artifact, we implemented a down scaling analysis of our data and obtained the same general trends within experimental error (Supplemental Fig. 12; Supplemental Data 3: Table S8D; see Materials and Methods).
FIGURE 5.

Relationship between DMS reactivity and abundance and its modulation by salt stress. (A) Transcript mean reactivity in shoots is positively correlated with transcript abundance under control conditions. A similar direct relationship was observed for the shoot transcriptome under NaCl stress, as well as for the root transcriptome under both conditions (Supplemental Fig. S10, all tests in Supplemental Data S3: Tables S8A,B). (B) Transcripts within the top and bottom 5% most extreme salt stress-induced reactivity increases and decreases [Mean log2(TPM) increases 5.77, decreases 3.73, t.test P = 2.2 × 10⁻¹⁶]. (C) Transcripts within the top and bottom 5% most extreme salt stress-induced abundance changes [Mean log2(TPM) of decreases 5.89, increases 3.04, t.test P = 2.2 × 10⁻¹⁶]. Transcripts with high initial abundance in control conditions tend to increase in reactivity and decrease in abundance, while transcripts with initial low abundance tend to decrease in reactivity and increase in abundance (Supplemental Data S3: Table S8C). Similar patterns are observed for the root transcriptome (Supplemental Fig. S11; Supplemental Data S3: S8C). All data shown are under the initial, unstressed conditions, that is, reactivity increases are those transcripts that increase in reactivity after salt stress.
Gene ontology analyses reveal key reactivity changes in photosynthetic and stress-related mRNAs
We next discovered that different functional categories of genes exhibit different structural responses to salt stress and tissue type, thereby reshaping the encoded functionality of the transcriptome. We performed GO analyses via agriGOv2 (Tian et al. 2017) to identify the enrichment of functional categories that change in each comparison (Supplemental Data 4). In both tissues, transcripts from genes related to the ribosome and ribonucleoprotein complex, abiotic stress, and response to oxidative stress gain reactivity; there is also a pronounced shoot-specific gain of reactivity in transcripts encoding photosynthesis-related genes (Fig. 6A). In both tissues, transcripts that lose reactivity were enriched in abiotic stimulus, response to water deprivation, and response to both osmotic and salt stress (Fig. 6B). We analyzed our inter-tissue results in the same way (Supplemental Fig. S13).
FIGURE 6.

Gene ontology analyses reveal enrichment of stress-related transcripts in transcripts with NaCl responsive structures. Results from multiple GO analyses are combined and displayed as heat maps, where color indicates the significance of enrichment within an analysis. Categorical enrichment of transcripts and transcript regions within the top 5% of reactivity increases (A) or decreases (B) after salt stress are displayed. The full results of these GO analyses are provided (Supplemental Data S4). The total number of genes classified within a GO category are listed beside each category name.
We then performed GO analyses (Tian et al. 2017) on the subsets of fully concordant transcripts, examining transcripts that increased in abundance and lost reactivity (concordant protection) and those that decreased in abundance and increased in reactivity (concordant exposure) between conditions in both tissues (Supplemental Data 4).
The striking impact of concordancy is illustrated by photosynthesis genes in shoot, which are categorically overrepresented in transcripts that gain reactivity across all transcript regions and lose abundance under salt stress (Fig. 7A). Single transcripts of four well-known photosynthesis-related genes (Fig. 7B–E) illustrate the single nucleotide reactivity increases in all transcript regions following salt stress. Conversely, in both tissues (Fig. 7A; Supplemental Data 4), concordant loss of reactivity/gain in abundance transcripts are enriched in functions related to response to salt stress, osmotic stress, and response to water deprivation. Figure 7F–I illustrates single nucleotide reactivity changes of four “response to salt stress” genes from shoot data, visualizing this decrease in reactivity upon salt stress.
FIGURE 7.

Concordant transcripts reveal suppression of photosynthesis genes. (A) Concordant transcripts from shoot were separated into those that increased in abundance and decreased in mean reactivity (+abundance/−reactivity) and those that decreased in abundance and gained in mean reactivity (−abundance/+reactivity) after salt stress. These subsets were used in a series of GO analyses (Tian et al. 2017) and summarized as a heatmap. The full results for shoot and root are also provided (Supplemental Data S4: Tables G33–G36). The set of (+abundance/−reactivity) transcripts shows enrichment in categories pertinent to salt stress response. Conversely, the set of (−abundance/+reactivity) transcripts shows functional categories not specifically associated with salt stress, and particularly illustrates that photosynthesis genes concordantly gain in reactivity and lose abundance under salt stress. Concordant change of all three transcript regions therefore may particularly modulate stress-induced abundance changes. (B–E) Single nucleotide changes of select concordant photosynthesis related genes. (F–I) Single nucleotide changes of select concordant salt response transcripts. For both sets of single nucleotide plots, only A and C nucleotides are plotted; plots are extended to the last 3′ nucleotide where a change in reactivity could be resolved.
Tissue sensitivity of changes in predicted RNA structures
To approximate in vivo structural effects induced by salt, we used our DMS reactivity profiles as restraints to guide transcript folding (Deigan et al. 2009; Ding et al. 2014; Tang et al. 2015; Tack et al. 2018) (see Materials and Methods; Supplemental Data 5). We found that fewer base-pairings were conserved between salt stress and control conditions in root compared to shoot (Fig. 8), mirroring the greater root change in mean reactivity following stress. The 5% of transcripts with the most or the fewest shared base-pairings in the two conditions (high or low Positive Predictive Value [PPV], respectively) were separately subjected to GO analysis (Tian et al. 2017). In both tissues, transcripts with high PPV are categorically enriched in translation and ribosome biogenesis (Fig. 8; Supplemental Data 4), as illustrated with the predicted structures of two ribosomal proteins (Fig. 8G,H). In root, but not shoot, GO categories “response to stimulus” and “protein transport” are enriched in the 5% of transcripts with lowest PPV (Fig. 8B). This low PPV category is illustrated in Figure 8E,F by RALF1 and “low temperature and salt responsive protein family” genes. Interestingly, RALF1 is a peptide ligand for the RLK, FERONIA, and both have been implicated in tissue sensitivity to salt (Feng et al. 2018; Yu and Assmann 2018).
FIGURE 8.

Folding analyses suggest core function of RNA structure in salt stress response. (A) PPV distribution of 15,708 mRNAs in shoot (green) and 15,557 mRNAs in root (gray). PPV is the fraction of base pairs that appear in two different structures of the same RNA; thus it is bounded by 0 and 1, with 1 indicating 100% identical base pairings. Thus, PPV values quantify the structural differences between control and salt stressed conditions. Dashed lines indicate the mean PPV in root (gray; mean: 46.96) and shoot (green; mean: 51.30). (B) Tails of the PPV distribution were submitted to agriGOv2 (Tian et al. 2017). GO categories “response to stimulus” and “protein transport” are overrepresented in the 5% of the transcripts with lowest PPV in root (but not in shoot). (C) Transcripts involved in translation and ribosome biogenesis are enriched in the 5% of transcripts with highest PPV in shoot. (D) Transcripts involved in translation and ribosome biogenesis are also overrepresented in the 5% of transcripts with highest PPV in root. (E) A low PPV transcript example (AT1G02900.1, RAPID ALKALINIZATION FACTOR 1 [RALF1], PPV = 22.7) showing structural changes between control condition (left) and salt stress (right). (F) Another low PPV transcript example (AT4G30660.1, low temperature and salt responsive protein family gene, PPV = 0) with dramatic structural change between control (left) and salt stress (right). (G) A high PPV transcript example (AT3G02190.1, 60S ribosomal protein L39 [RPL39B], PPV = 87.79) with similar structure between control and salt stress. (H) Another high PPV transcript example (AT2G19740.1, 60S ribosomal protein L31 [RPL31A], PPV = 97.38) with similar structure between conditions. For E–H, all structures were generated from root data. Circle plots provide an abstraction of the base-pairing (Reuter and Mathews 2010). Nucleotides are arranged in sequence order around the circle. Black lines link bases paired only in control; red lines link bases paired only in salt stress, green lines link bases paired in both conditions. GO analysis results (Supplemental Data S4: Tables G37–G40) and all PPV statistics (Supplemental Data S5) are provided.
DISCUSSION
RNA performs many distinct roles in the cell and has the ability to switch conformations in differing chemical environments. Examples of changes in RNA structure that confer molecular function include RNAs functioning as small molecules and assisting in translational control in mammalian cells (Parker and Sheth 2007). We and others have developed ways to probe RNA structure in vivo and genome-wide, implicating functional roles of RNA structure in splicing and polyadenylation (Ding et al. 2014; Rouskin et al. 2014; Wan et al. 2014; Bevilacqua and Assmann 2018; Ritchey et al. 2019) while suggesting the broad conservation of structure between two plant species (Deng et al. 2018). However, little is known concerning how abiotic factors known to affect structures of in vitro transcribed RNAs impact the in vivo structurome. There is strong evidence that specific motifs in prokaryotes act as thermal sensors or “RNA thermometers” (Narberhaus et al. 2006) and that mRNA secondary structure globally modulates protein expression during cold shock (Zhang et al. 2018). Additionally, we have recently observed dynamic changes in RNA structure following heat shock in rice, which suggest that heat-induced RNA unfolding increases susceptibility to degradation machineries (Su et al. 2018). Despite these advances, studies to date have not investigated the tissue specificity of the structurome nor the importance of the three primary transcript regions. Here we provide the initial investigation of genome-wide RNA structural changes at the single nucleotide level invoked in two distinct plant tissues by a long-term, salinity stress treatment (Fig. 1).
RNA-seq methods have revolutionized the study of tissue and cell-specific transcriptomes (Pennisi 2018), but comparable studies on the RNA structurome are lacking. Structurome studies focused on viruses, yeast, or mammalian cell lines have made important contributions (Kertesz et al. 2010; Rouskin et al. 2014; Dethoff et al. 2018) but cannot address this issue. Here, we directly compared the structuromes of two distinct plant organs, discovering that tissue type has a stronger influence on the structurome than salinity stress (Table 1; Fig. 2; ANOVA analyses [Supplemental Fig. S6; Supplemental Data S3: Table S4]). In particular, we found that transcripts that were tissue-specific in our data sets had greater mean reactivity change between control and salt conditions (Supplemental Data S3: Tables S5A and S5B) and stronger Δ reactivity to Δ abundance correlations (Table 2B; Supplemental Data S3: Table S6B) than transcripts that were shared between tissues. These results hint that tissue-specific transcripts may have implicit structural malleability calibrated for their tissue environment. In the future, it will be of interest to further dissect these tissue-specific signatures via Structure-seq analyses of the component cell types of each tissue (Dinneny et al. 2008).
Tissue specificity of the RNA structurome might have been anticipated, but the convergence of the two structuromes under salinity stress is surprising. This convergence arises as a result of the shoot transcriptome losing reactivity and the root transcriptome gaining reactivity (Table 1; Fig. 2; Supplemental Data S3: Table S1A). Probing the mechanistic basis of this effect, we measured proline and ion content in the two tissue types under both conditions (Fig. 3). We surmise that the structurome convergence may partially be explained by NaCl-induced loss of the high K+ levels present in the root tissue under control conditions (Fig. 3) leading to nearly the same total K+ levels in both tissues (Yu and Assmann 2015). Monovalent cations generally promote RNA folding and disfavor RNA–protein interaction (Bloomfield et al. 2000). Although available techniques do not discriminate where these ions reside within the cell, this trend is nonetheless consistent with the shoot becoming less DMS reactive and the root becoming more DMS reactive upon salt stress. One caveat is that increasing levels of monovalent cations can disfavor RNA folding when adequate divalent ions are present (Manning 1972; Heilman-Miller et al. 2001). Another caveat is that transcripts that are translationally repressed might become more reactive to DMS owing to a lack of ribosome protection, although our recent study in a mammalian cell line has not found evidence for this (Waldron et al. 2019), and increased ribosome occupancy had a slight overall positive effect on DMS reactivity in our study in rice (Su et al. 2018). Slow translation speed has been associated with mRNA decay in bacteria, yeast, trypanosomes, and metazoans (Bazzini et al. 2016; Böel et al. 2016; Harigaya and Parker 2016; Mishima and Tomari 2016; Narula et al. 2019). Nevertheless, the observed trends suggest that under salinity stress root and shoot transcriptomes converge toward a common structural optimum. Owing to a read length of 150 nt (see Materials and Methods), many reads arising from genes with potential for alternative splicing could not be uniquely assigned to individual transcript isoforms. Thus, we cannot identify changes in reactivity that arise from changes in the ratio of alternative isoforms; nonetheless, we believe such effects are minor because RNA folding is typically determined by local interactions.
We observed a striking inverse relationship between salt stress-induced DMS reactivity changes and transcript abundance changes (Table 2A; Fig. 4A–D; Supplemental Data S3: Table S6A). This relationship was present in both shoot and root structuromes, even though the mean reactivities of those structuromes changed in the opposite direction in response to NaCl stress. We also observed this inverse correlation in rice seedlings in response to heat shock (Su et al. 2018). Its robustness leads us to now propose a general mechanism: Stress-induced mRNA unfolding contributes to decreases in mRNA abundance. In rice (Su et al. 2018), further analyses suggested that transcript unfolding promotes degradation by the exosome and the 5′ exonuclease XRN4 (Nagarajan et al. 2013). Here, detection of this relationship over a much longer stress period, with ample time for transcriptional as well as post-transcriptional regulation, raises the additional hypothesis that structures of nascent mRNA transcripts may influence their transcription rate and ultimately their abundance (Watters et al. 2016).
Separate from RNA structure, a study on Arabidopsis (Anderson et al. 2018) discovered a role of m6A modification in protecting mRNAs from cleavage under salinity stress, providing one example of post-transcriptional regulation. That study and ours show similar impacts of salinity stress on the transcriptome (Supplemental Fig. S14). However, upon excluding from our data sets all transcripts with an m6A methylation site detected in that report, our inverse relationship between change in transcript reactivity and change in transcript abundance is preserved (Supplemental Fig. S15). This result further reinforces the role of RNA structure as an environmental sensor and principal driver that reshapes the transcriptome in response to the environment.
We observed that the CDS shows a particularly strong (inverse) correlation of stress-induced changes in DMS reactivity and abundance (Fig. 4C). This was unexpected given conventional wisdom wherein UTRs play primary regulatory roles; as the CDS region is under selection for peptide sequence and translational efficiency, it is reasonable to posit that less constrained selection on the UTR regions would have allowed the evolution of dynamic, stress-responsive sequence and structural elements. Indeed, sequence motifs in the 3′UTR that control transcript degradation are documented (Rabani et al. 2017), although little information is available on how structure plays into this. A recent study on mRNA decay in Arabidopsis showed that transcripts with enriched A content and depleted G content in 5′ UTRs exhibited faster decay rates (Sorenson et al. 2018). Given that AU base-pairing is weaker than GC base-pairing, those results may implicate salt-induced 5′ UTR unfolding (increased reactivity) as a mechanism that exposes transcripts to ribonuclease attack. Indeed, our present study also reveals particular diversity in the structural responses of the UTR regions compared to the CDS regions following stress, here salinity stress (Table 1A; Fig.4B,D; Supplemental Data S3: Table S1A). New research suggests that the UTR sequence itself, which undoubtedly encompasses structural correlates, may be predictive of expression level (Washburn et al. 2018).
To untangle the apparent conundrum between the primacy of the CDS region in the inverse relationship and the expected regulatory functionality of UTRs, we develop here a new concept, that of concordancy between transcript regions. We discovered that when all three regions (5′UTR, CDS, 3′UTR) increase in DMS reactivity or all three regions decrease in DMS reactivity, both defined as “concordancy,” the effect of reactivity change on transcript abundance change is considerably more pronounced (Fig. 4A–D vs. Fig. 4E–H; Table 2A vs. C; Supplemental Data 3: Table S6A vs. D). This result illustrates the importance of the UTRs and suggests concerted protection from or concerted exposure to various mechanisms of mRNA abundance regulation. Moreover, concordant change of reactivity between transcript regions is synergistic (Supplemental Figs. S8, S9; Supplemental Data 3: Table S6E). However, we do note that the majority of mRNAs (∼80%) are discordant, with transcript regions changing in different directions under salt stress. If we consider that each coding sequence is flanked by two structural switches (the UTRs), this opens the possibility of three-level combinatorial regulation, which may allow more nuanced post-transcriptional regulation of abundance for the bulk of the transcriptome.
Concordant reactivity increases may provide concerted access to 5′ and 3′ exonucleases, as well as single-strand-specific endonucleases. The strong effect of concordant reactivity increases in promoting abundance decreases is consistent with the communication known to occur between 5′UTRs and 3′UTRs during stress (Vicens et al. 2018). For example, it is well-established that shortening of the poly(A) tail promotes decapping and subsequent 5′ to 3′ exonucleolytic degradation (Muhlrad et al. 1994; Yamashita et al. 2005; Jiao et al. 2008). That 5′ and 3′ ends of mRNAs interact is supported by our own structurome data sets (Supplemental Fig. S8L vs. O). Conversely, concordant reactivity decreases may accompany protective mechanisms. For example, in mammalian systems sequestration of transcripts in stress granules, which is thought to protect transcripts from degradation, is associated with overall transcript compaction (folding) (Khong and Parker 2018), which our assay would detect as a concordant decrease in DMS reactivity.
It is of interest that concordant reactivity change in response to salt stress is tissue-specific, that is, only a small fraction (∼23%) of mRNAs are fully concordant in both tissues, and an even smaller set (∼12%) show concordancy in the same direction in both tissues (see Results for specific numbers). These observations support mRNA structural plasticity between tissues in their stress responses. Our GO analysis (Fig. 7) of fully concordant transcripts under salinity stress shows enrichment in both tissues of encoded functions related to stress and to abiotic stimuli, particularly for those transcripts that gain abundance and lose reactivity under salt stress, suggesting that structural mechanisms promote increased net expression of suites of stress-related transcripts in each tissue. Our GO analysis of fully concordant transcripts that gain reactivity and lose abundance under salt stress in shoot shows a particular enrichment in genes related to photosynthesis (Fig. 7). This structure-related loss in transcript abundance mirrors, and likely contributes to, the well-known depression of photosynthesis under salt stress (Takahashi and Murata 2008; Stepien and Johnson 2009). In short, the concerted structural change appears to retool the transcriptome to coordinate the physiological response to stress, enriching stress-related mRNAs and depleting photosynthesis-related mRNAs.
We further studied the distribution of structurally responsive transcripts across the transcriptome (Fig. 5; Supplemental Data S3: Table S8C). We found that abundant transcripts preferentially show concomitant abundance decreases and reactivity increases following salt stress, while rare transcripts preferentially show concomitant abundance increases and reactivity decreases. Our GO analyses (Figs. 6–8) support that the latter are enriched in specialized stress-related mRNAs that are up-regulated in response to salinity, while the former include transcripts encoding everyday metabolic functions. In both tissues, transcripts with the largest changes of reactivity between control and salt stress were enriched in salt stress, response to osmotic stress, and ion binding gene ontology (GO) categories (Fig. 6). These results indicate that much of the structural dynamism between conditions centers on genes that respond to stresses. This pattern may reflect a repartitioning of resources away from basic metabolism and photosynthesis and toward stress amelioration, perhaps analogous to growth-defense trade-offs (Huot et al. 2014).
Our previous study (Ding et al. 2014) on unstressed Arabidopsis seedlings compared in silico versus in vivo structures of ∼10,000 mRNAs, and raised the hypotheses that housekeeping genes exhibit more stable structures, perhaps having evolved to maintain homeostasis under diverse conditions, and that signaling and stress-related genes are highly plastic in their structures, possibly as an intrinsic component of their environmental responsiveness (Ding et al. 2014). As compared to solely assaying unstressed plants as in the earlier study (Ding et al. 2014), our present experiments compare the in vivo structuromes of stressed versus unstressed tissues, allowing a direct test of these hypotheses. We find them to be supported: GO analyses reveal an enrichment of “ribosome biogenesis” and “translation” categories among the high PPV transcripts of both root and shoot (Fig. 8C,D). Analysis of the extremes of DMS reactivity changes (Fig. 6) highlights overrepresentation of GO categories such as “response to abiotic stimulus” and “response to stress” in both the 5% of transcripts with greatest salt-induced reactivity increases and decreases (Fig. 6A,B), conveying their malleability.
In conclusion, differences in transcript abundance, both within and between transcriptomes, appear innately tied to changes in RNA structure. In the future, parallel probing with DMS and EDC, a U- and G-specific probe (Mitchell et al. 2019; Wang et al. 2019), to report on absence of base-pairing for all four nucleobases will allow improved description of the RNA structurome and its biophysical nature, for example, determination of whether certain structural motifs are more prone to stress-specific refolding events. A deeper understanding of these mechanisms could augment efforts to engineer more salt-stress resistant crops (Roy et al. 2014), and some structural elements have already been implicated as targets (Vashisht and Tuteja 2006). Soil salinization arises from irrigation practices and, increasingly, from seawater inundation as a result of climate change (Vu et al. 2018). Given a predicted world population of 9.1 billion by 2050, improvements in crop stress tolerance and resilience to cultivation on marginal lands will be critical to increase production, highlighting a need for understanding the molecular basis of how plants survive and thrive in challenging environments.
MATERIALS AND METHODS
Plant growth and salt treatment
Arabidopsis accession Col-0 was used in this study. Sterilized Arabidopsis seeds were spread on agar plates containing 1⁄2 strength Murashige and Skoog (MS) medium with 1% sucrose and 0.8% agar (A1296; Sigma) and stratified at 4°C in the dark for 2 d. After stratification, the plates were transferred to a growth chamber set at 21°C with an 8 h light/16 h dark photoperiod with light intensity of 150 mol m−2 s−1and held vertically for 12 d. Seedlings were then transferred to a hydroponic setup (Yu and Assmann 2015) and grown hydroponically for another 12 d. The hydroponic growth solution was 1⁄4 strength Hoagland's solution [0.25 mM KH2PO4, 3.71 µM FeNa-EDTA, 0.5 mM MgSO4, 1.26 mM KNO3, 1.26 mM Ca(NO3)2, 11.56 µM H3BO3, 2.29 µM MnCl2, 0.20 µM ZnCl2, 0.073 µM CuCl2, 0.026 µM Na2MoO4]. Solutions were changed twice per week. After a total of 24 d of growth, half of the plants were exposed to salt stress by addition of 100 mM NaCl (final concentration) to the hydroponic solution, while the rest of the plants were maintained in the original solution. After 48 h of NaCl or control treatment, the plants were treated with DMS as described in a subsequent section below.
Proline and ion content measurements
Twenty-four-day-old hydroponically grown seedlings were treated with or without 100 mM NaCl as above for 48 h. Shoots and roots were separated, gently blotted dry using paper towels, frozen in liquid nitrogen and dried in a CentriVap centrifugal vacuum concentrator. Dry weight of each sample was measured, and proline content was determined with a colorimetric assay (Ábrahám et al. 2010). Briefly, plant tissues were ground in 3% sulfosalicylic acid and centrifuged at 13,200 rpm for 5 min at room temperature using a benchtop centrifuge. Supernatant (100 µL) was transferred to a premade solution of 100 μL of 3% sulfosalicylic acid, 200 μL glacial acetic acid and 200 μL acidic ninhydrin. The reaction mixture was incubated at 96°C for 60 min, followed by addition of 1 mL toluene and vortexing to terminate the reaction. After centrifugation for 2 min at 10,000g, the absorbance at 520 nm of the chromophore in the toluene phase was measured with a spectrometer. The proline concentration was determined using a standard concentration curve of L-proline (Sigma) and calculated on a dry weight basis. Three independent replicates were performed with three biological samples in each replicate. Dry weight measurements are found in (Supplemental Data S3; Table S2A). We also measured the levels of several ions on the same batch of seedlings as used for proline measurement (Supplemental Data S3: Table S2B) with three independent replicates, using inductively coupled plasma atomic emission spectroscopy (Yu and Assmann 2015). All ion data were also analyzed via ANOVA (Supplemental Data S3: Table S3).
In vivo DMS probing of Arabidopsis root and shoot tissue
To obtain “single-hit” modification kinetics (Ding et al. 2014; Su et al. 2018) in our DMS treatments, the duration of in vivo DMS treatment was first optimized. All DMS treatment procedures and RNA extraction procedures were conducted with proper safety equipment following the instructions in our publications (Ding et al. 2015; Ritchey et al. 2017; Su et al. 2018; Ritchey et al. 2019). For single-hit kinetics determination, we separately tested shoot and root tissue from Arabidopsis plants treated with/without 100 mM NaCl (control and salt stress). For the shoot tissue test, the shoots from five individual plants were used for each sample. For each condition, non-DMS-treated (−DMS) and DMS-treated (+DMS) samples were prepared. For the +DMS sample, the excised shoots were immersed in 20 mL DMS reaction buffer (40 mM HEPES (pH 7.5), 100 mM KCl, and 0.5 mM MgCl2) in a 50 mL conical centrifuge tube. Then 150 µL DMS (D186309, Sigma-Aldrich) was immediately added to the solution to a final concentration of 0.75% (∼75 mM) with the following durations of DMS treatment: 1, 5, 10, 15, and 20 min. After DMS treatment, dithiothreitol (DTT) at a final concentration of 0.5 M was supplied to quench DMS in the reaction for 2 min followed by two washes with deionized water before immediately drying and freezing the tissue in liquid nitrogen. The −DMS sample was processed through the same procedure by placing materials in the DMS buffer for 20 min but without addition of DMS. All procedures for the root tissue test were identical as for shoot treatments, except that the initial material was the root tissue from five plants, due to the lesser per plant mass of roots versus shoots. RNA was extracted from frozen samples using the NucleoSpin RNA Plant kit (Cat# 740949, Macherey-Nagel, Germany) following the manufacturer's protocol.
Gene-specific reverse transcription for single-hit kinetics determination
Gene-specific reverse transcription (RT) of 18S rRNA was performed following the previous protocol (Ding et al. 2014). For each RT reaction, 1 µg total RNA in 5.5 µL total volume of RNase-free water was prepared. After adding 1 µL of 32P-radiolabeled primer (∼250,000 cpm/µL) to target 18S rRNA (5′-AACTGATTTAATGAGCCATTCGCAG-3′), the solution was incubated at 75°C for 3 min, then cooled to 35°C. Then 2 µL of reverse transcription reaction buffer (5×) was added to a final concentration of 20 mM Tris–HCl (pH 7.5), 1 mM DTT, 100 mM KCl, 8 mM MgCl2, and 1 µL of 1 mM dNTPs. Annealing was allowed to proceed at 35°C for 5 min, after which the reaction solution was heated to 55°C for 1 min, 0.5 µL of Superscript III reverse transcriptase (Invitrogen; 100 U total) was added to the reaction, and the RT reaction was allowed to proceed at 55°C for 15 min. Next, 1 µL of 1 N NaOH was added to the solution, which was heated to 95°C for 5 min to hydrolyze all RNAs and denature the reverse transcriptase. The RT product mixed with an equal volume of 2× loading dye was then loaded onto a 10% denaturing polyacrylamide gel (8.3 M urea) and run at 90 W for ∼2 h. The gel was dried and exposed using a PhosphorImager (Molecular Dynamics) cassette. Gel images were collected with a Typhoon PhosphorImager 9410, and bands were quantified using ImageQuant 5.2. Based on these results (Supplemental Fig. S16), we chose 5 min DMS treatment for shoot and 1 min DMS treatment for root to achieve similar single hit kinetics for the two distinct tissue types. We then utilized these conditions for DMS treatment and subsequent Structure-seq library construction.
Preparation of Structure-seq libraries
After determination of single-hit kinetics for each condition, the plant materials for Structure-seq library generation were prepared. For each individual library, ∼40 hydroponically grown Arabidopsis plants were used, which were dissected into shoot and root tissue. For the +DMS shoot sample, 40 excised shoots from control or NaCl treatment were immersed in 20 mL DMS reaction buffer (40 mM HEPES [pH 7.5], 100 mM KCl, and 0.5 mM MgCl2) in a 50 mL conical centrifuge tube. Then 150 µL DMS (D186309, Sigma-Aldrich) was immediately added to the solution to a final concentration of 0.75% (∼75 mM) for 5 min of DMS treatment, after which dithiothreitol (DTT) at a final concentration of 0.5 M was supplied to quench DMS in the reaction for 2 min, followed by two washes with deionized water before immediately drying and freezing the tissue in liquid nitrogen. The −DMS sample was processed through the same procedure by placing materials in the DMS buffer for 20 min but without addition of DMS. Three independent biological replicates were prepared for both control and NaCl-treated shoot libraries, and for both −DMS and +DMS libraries, for a total of three control −DMS libraries, three control +DMS libraries, three +NaCl −DMS libraries, and three +NaCl +DMS libraries. All procedures for generation of root Structure-seq libraries were identical as for shoot library preparation, starting with the root tissue from 40 plants each of control or NaCl treatment, except for a different duration of DMS treatment to maintain comparable single hit kinetics (Supplemental Fig. S16). Frozen samples were subjected to RNA extraction using the NucleoSpin RNA Plant kit (Cat# 740949, Macherey-Nagel, Germany) following the manufacturer's protocol.
Structure-seq libraries then were prepared according to the gel-based Structure-seq2 protocol (Ritchey et al. 2017; Su et al. 2018) starting with ∼250 µg total RNA. In total, 24 Structure-seq libraries were generated. Library cDNA size distribution and consistency between biological replicates were assessed from Bioanalyzer traces (Agilent 2100, Agilent Technologies). After qPCR to quantify library molarity, a pool of all libraries at equal molarity was made, and libraries were subjected to next-generation sequencing on an Illumina HiSeq 2500 at the Genomics Core Facility of Penn State University to generate 150 nt single-end reads. Five HiSeq runs were performed to collect sufficient reads for downstream analyses, yielding a total of 1,109,349,671 reads (Supplemental Data S6: Table W1).
Data handling and processing
All sequenced libraries (FASTQ format) were first trimmed with Cutadapt (Martin 2011) (version 1.14) via StructureFold2 (Tack et al. 2018) to remove 5′ and 3′ adapters, as well as low quality base calls on the 3′ ends of reads (Supplemental Data S6: Table W1). All individual sequencing runs of each library were combined (Supplemental Data S6: Table W1) into a single FASTQ file representing a biological replicate before aligning to the TAIR10 (The Arabidopsis Information Resource [TAIR], https://www.arabidopsis.org) cDNA reference sans ribosomal sequences, using Bowtie2 (Langmead and Salzberg 2012) (version 2.3.2) via StructureFold2 (Supplemental Data S6: Table W2; Tack et al. 2018); this yielded an average of 90.3% of reads mapping to the transcriptome. These mappings were then post-processed using SAMtools (Li et al. 2009) (version 0.1.19) to remove reads aligned to the opposite strand, as well as reads with more than three mismatches or indels compared to the reference, as well as any read with a mismatch at the first (5′) position of the read via StructureFold2 (Supplemental Data S6: Table W3). Every filtered SAM file was then changed into an RTSC (reverse transcriptase stop count) file via StructureFold2 (Tack et al. 2018) before continuing with analysis. RT stop specificity was calculated from these RTSC files, showing high specificity to adenines (As) and cytosines (Cs) in DMS treated samples (Supplemental Data S6: Table W4).
DMS library RT stop correlation analyses
We pooled the RTSCs for all +DMS biological replicates of each condition to calculate total transcript coverage within that condition (Supplemental Data S6: Tables W1–W3) via StructureFold2 (Tack et al. 2018). We define coverage as the number of sequenced RT stops per A and C present in each transcript in the pool of all +DMS biological replicates of a condition. Thus, our coverage threshold of ≥1 mandates that we sequenced an average of one or more RT stops for each A or C residue of a given transcript within a condition in order to consider the structural information for that transcript to be resolvable (Kertesz et al. 2010). For all transcripts with coverage ≥1 in a condition, we correlated the component biological replicates within the condition in two ways. First, we performed all pairwise correlations between each pair of biological replicates on the entire transcriptome for each condition, that is, correlated the number of RT stops on each A and C on every base in the transcriptome from transcripts above the combined coverage threshold for that condition using R (R Core Team 2019) (cor.test) and plotting with ggplot (Wickham 2016; Supplemental Fig. S1, hexbins); the DMS-induced RT stops in the replicate libraries under each condition were highly reproducible (mean r = 0.95). Second, we used the plyr (Wickham 2011) package to organize our data such that we could perform a sub-correlation (cor.test) for the RT stop values of each individual transcript between each biological replicate in each condition, plotting the distribution of each of these r values using ggplot (Supplemental Fig. S1, violins). Given the high reproducibility, library data from the three replicate libraries of each condition were merged as the final data sets for downstream analyses (Ding et al. 2015).
Reactivity calculations and statistical analyses
We calculated per base reactivity separately for each sample analyzed in each individual contrast using StructureFold2 (Tack et al. 2018), subtracting pooled −DMS reads indicative of natural stops and natural stop-inducing modifications from corresponding +DMS modification RT stops (see StructureFold2 manual for equations, “rtsc to react module”). Every sample within each contrast was normalized to the same 2%–8% normalization scale (Low and Weeks 2010), where each scale contains separate 2%–8% values for each transcript. The particular 2%–8% scale used for normalization is relative, as all data sets being contrasted are normalized to the same scale. This normalization of raw reactivity values from multiple samples by such a common scale (average reactivity of the top 8% of bases’ reactivities after ignoring the top 2%) ensures that all reactivity measurements between samples are relative to the same set of highly reactive bases. In both intra-tissue comparisons, the respective control scale was applied to the salt data, in both inter-tissue comparisons, the respective shoot scale was applied to the root data (Supplemental Data 1). The shoot control scale was used when comparing all four data sets (Supplemental Data 1). When there was no direct comparison between structuromes, for example, when comparing abundance to mean reactivity (Supplemental Data 2; Supplemental Fig. S10), each structurome's internal 2%–8% scale was used for normalization.
Transcript reactivities were summarized by the reactivity statistics module in StructureFold2, filtering the data to include only those transcripts with an overlapping coverage ≥1 in all samples present in a given contrast. As an additional filter, we restricted analysis to transcripts containing 10 or more As plus Cs before the last 30 bp of the transcript, such that mean reactivity values had a suitable number of measurements. These processed data can be found in Supplemental Data S1; shoot control versus salt (D1–D4), root control versus salt (D5–D8), control shoot versus root (D9–D12), salt shoot versus root (D13–D16), and four-way (D17–D20) comparisons. We estimated transcript abundance via the StructureFold2 (Tack et al. 2018) RTSC abundance module, calculating TPM (transcripts per kilobase-million) from the reads in our corresponding pooled −DMS biological replicates for each sample (Supplemental Data S1: Tables D21–24). Data for the individual structuromes are also summarized (Supplemental Data S2: Tables R1–R16). Unless specified, all downstream analysis was done with R (R Core Team 2019) and plots were generated via the ggplot (Wickham 2016) package. Base R functionality was used for all tests and analyses; all t-tests were carried out using t.test(), all correlations carried out using cor.test(), aov() was used for ANOVA and information was extracted with summary() and TukeyHSD(). We note that for reporting P-values, P < 2.2 × 10⁻¹⁶ is the smallest floating point number that base R reports by default. StructureFold2 formats all such data to be readily used by R. Concordant transcripts and regions were grouped by comparing the reactivity change of transcript regions between conditions via subset(), that is, regions that shared the direction of reactivity change were considered concordant. For computing the P-value of the Fisher Z-test between two correlations, we used the cocor.indep.groups() function from the R cocor package (Diedenhofen and Musch 2015); by default this package displays P-values to four decimal places, thus all Z-tests have a different formatting for P-values than those derived with base R. When determining the membership of shared and unique transcript regions (i.e., 5′UTR, CDS, 3′UTR), we used the shared/unique status of the transcript (Supplemental Data 3: Table S5A). As an additional set of tests, we determined shared and unique based on the individual regions (Supplemental Data 3: Table S5B); to be shared a region had to be from a shared transcript and resolved in both tissues, whereas it only had to originate from a shared transcript in the former analysis.
To downscale our data, we used the StructureFold2 rtsc_downscale module at 0.50, 0.25, and 0.125 ratio settings on both fractional (the stop counts on each base are multiplied by the ratio) and random read (each individual stop has the specified ratio random chance of being retained) modes on both (−) and (+) RTSC files for shoot control, and recalculated all derived statistics (Supplemental Fig. S12; Supplemental Data 2: Table R17; Supplemental Data 3: Table S8D).
GO analyses
For our intra-tissue contrasts, we examined the top and bottom 5% of increased and decreased mean reactivity between control and NaCl stress conditions, for whole transcript and each transcript region, in both tissues (Supplemental Data S4: Tables G1–G16). For our inter-tissue contrasts, we examined the top and bottom 5% of increased and decreased mean reactivity between shoot and root, for whole transcript and each transcript region, in both conditions (Supplemental Data S4: Tables G17–G32). For the GO analyses on concordant transcripts, we qualitatively subset our transcripts into those that increased in abundance and lost reactivity (concordant protection) and those that decreased in abundance and increased in reactivity (concordant exposure) (Supplemental Data S4: Tables G33–G36). For the GO analyses using PPV, we selected the 5% top and bottom extremes of PPV between conditions (Supplemental Data S4: Tables G37–G40). All transcript subsets were reduced to reflect their gene locus of origin before use in GO analyses via agriGOv2 (Tian et al. 2017), which was done because the 150 nt maximum read length results in a number of reads that cannot be mapped to a unique isoform. These individual results were then combined via a custom Python script back into a convenient csv for easy analysis and plotting of several GO analyses simultaneously using R and ggplot (Figs. 6, 7; Supplemental Fig. S13; Wickham 2016).
ANOVAs of mean reactivity
To contrast all of our structuromes together, we implemented a series of large scale ANOVAs. We used the 2%–8% normalization scale from shoot control and also applied it to shoot salt, root control, and root salt as a common normalization scale such that all the data would be comparable. Moreover, we used only transcripts that had a coverage ≥1 in the corresponding +DMS sample of every condition (Fig. 1C; Supplemental Data 1; D17–D20). This allowed four two-way ANOVAs (whole transcript: n = 12,978, 5′UTR: n = 12,117 UTRs, CDS: n = 12,870, 3′UTR: n = 12,278) comparing the mean reactivity of whole transcript and each region against their treatment and tissue (mean reactivity ∼ treatment × tissue). We combined the separate transcript regions, and ran a three-way ANOVA such that region could also be used as determinant of mean reactivity (mean reactivity ∼ treatment × tissue × region) (Supplemental Fig. S6; Supplemental Data S3: Table S4). Tissue and treatment:tissue were always stronger effects than treatment alone. When “region” was included as a factor, it was also a stronger determinant than treatment.
Structure prediction and derived statistics
Reactivity files generated from intra-tissue comparisons were used as restraints to guide folding of each transcript and transcript region above the coverage threshold in both control and NaCl conditions within a tissue via the RNAStructure (Reuter and Mathews 2010) Fold program with StructureFold2 (Tack et al. 2018). The output is a predicted minimum free energy structure for each transcript and transcript region. We then calculated PPV (Positive Predictive Value) between each pair of in vivo restrained folds by driving the RNAStructure scorer program with StructureFold2, thereby assaying how similar the folds of each transcript were between conditions (Supplemental Data S5: F1–F8). Circle plots between folds were generated with CircleCompare (Reuter and Mathews 2010) and GO analyses were performed on the top and bottom 5% most extreme PPV values in both tissues via agriGOv2 (Tian et al. 2017).
Comparison to Anderson et al. (2018) data
We extracted the salt stress-induced gene fold changes from Supplemental Table S3 of Anderson et al. (2018). These fold changes were used as overlay colors on all transcripts of these genes in our shoot Δ mean reactivity versus Δ transcript abundance plot (Supplemental Fig. S14), showing high parity of salinity-induced abundance changes between studies. We extracted the genomic coordinates of high confidence m6A modifications from Supplemental Table S4 of Anderson et al. (2018), and assigned these peaks to genes. All transcripts of genes with a detected m6A peak in either condition were removed from our shoot data, and the remaining transcripts were plotted exactly as in our Δ reactivity and Δ abundance plots, showing the inverse correlation of Δ reactivity and Δ abundance is retained in transcripts with no detected m6A modifications (Supplemental Fig. S15).
DATA DEPOSITION
Library sequences are available at the NCBI Gene Expression Omnibus (GEO) database as accession GSE124866.
SUPPLEMENTAL MATERIAL
Supplemental material is available for this article.
Supplementary Material
ACKNOWLEDGMENTS
This research was supported by National Science Foundation grant IOS-1339282 to P.C.B. and S.M.A. We thank Dr. Elizabeth Jolley and Megan Sylvia for reading the manuscript and providing feedback.
Footnotes
Article is online at http://www.rnajournal.org/cgi/doi/10.1261/rna.072850.119.
Freely available online through the RNA Open Access option.
REFERENCES
- Abogadallah GM. 2010. Insights into the significance of antioxidative defense under salt stress. Plant Signal Behav 5: 369–374. 10.4161/psb.5.4.10873 [DOI] [PMC free article] [PubMed] [Google Scholar]
- Ábrahám E, Hourton-Cabassa C, Erdei L, Szabados L. 2010. Methods for determination of proline in plants. Methods Mol Biol 639: 317–331. 10.1007/978-1-60761-702-0_20 [DOI] [PubMed] [Google Scholar]
- Anderson SJ, Kramer MC, Gosai SJ, Yu X, Vandivier LE, Nelson ADL, Anderson ZD, Beilstein MA, Fray RG, Lyons E, et al. 2018. N6-methyladenosine inhibits local ribonucleolytic cleavage to stabilize mRNAs in Arabidopsis. Cell Rep 25: 1146–1157.e3. 10.1016/j.celrep.2018.10.020 [DOI] [PubMed] [Google Scholar]
- Bahieldin A, Atef A, Sabir JS, Gadalla NO, Edris S, Alzohairy AM, Radhwan NA, Baeshen MN, Ramadan AM, Eissa HF, et al. 2015. RNA-seq analysis of the wild barley (H. spontaneum) leaf transcriptome under salt stress. C R Biol 338: 285–297. 10.1016/j.crvi.2015.03.010 [DOI] [PubMed] [Google Scholar]
- Bazzini AA, Del Viso F, Moreno-Mateos MA, Johnstone TG, Vejnar CE, Qin Y, Yao J, Khokha MK, Giraldez AJ. 2016. Codon identity regulates mRNA stability and translation efficiency during the maternal-to-zygotic transition. EMBO J 35: 2087–2103. 10.15252/embj.201694699 [DOI] [PMC free article] [PubMed] [Google Scholar]
- Bevilacqua PC, Assmann SM. 2018. Technique development for probing RNA structure in vivo and genome-wide. Cold Spring Harb Perspect Biol 10: a032250 10.1101/cshperspect.a032250 [DOI] [PMC free article] [PubMed] [Google Scholar]
- Bevilacqua PC, Ritchey LE, Su Z, Assmann SM. 2016. Genome-wide analysis of RNA secondary structure. Annu Rev Genet 50: 235–266. 10.1146/annurev-genet-120215-035034 [DOI] [PubMed] [Google Scholar]
- Bloomfield VA, Crothers DM, Tinoco I Jr. 2000. Nucleic acids: structures, properties, and functions. University Science Books, Sausalito, California. [Google Scholar]
- Böel G, Letso R, Neely H, Price WN, Wong KH, Su M, Luff J, Valecha M, Everett JK, Acton TB, et al. 2016. Codon influence on protein expression in E. coli correlates with mRNA levels. Nature 529: 358–363. 10.1038/nature16509 [DOI] [PMC free article] [PubMed] [Google Scholar]
- Cui J, Ren G, Qiao H, Xiang X, Huang L, Chang J. 2018. Comparative transcriptome analysis of seedling stage of two sorghum cultivars under salt stress. J Plant Growth Regul 37: 986–998. 10.1007/s00344-018-9796-9 [DOI] [Google Scholar]
- Deigan KE, Li TW, Mathews DH, Weeks KM. 2009. Accurate SHAPE-directed RNA structure determination. Proc Natl Acad Sci 106: 97–102. 10.1073/pnas.0806929106 [DOI] [PMC free article] [PubMed] [Google Scholar]
- Deinlein U, Stephan AB, Horie T, Luo W, Xu G, Schroeder JI. 2014. Plant salt-tolerance mechanisms. Trends Plant Sci 19: 371–379. 10.1016/j.tplants.2014.02.001 [DOI] [PMC free article] [PubMed] [Google Scholar]
- Deng H, Cheema J, Zhang H, Woolfenden H, Norris M, Liu Z, Liu Q, Yang X, Yang M, Deng X, et al. 2018. Rice in vivo RNA structurome reveals RNA secondary structure conservation and divergence in plants. Mol Plant 11: 607–622. 10.1016/j.molp.2018.01.008 [DOI] [PMC free article] [PubMed] [Google Scholar]
- Dethoff EA, Boerneke MA, Gokhale NS, Muhire BM, Martin DP, Sacco MT, McFadden MJ, Weinstein JB, Messer WB, Horner SM, et al. 2018. Pervasive tertiary structure in the dengue virus RNA genome. Proc Natl Acad Sci 115: 11513–11518. 10.1073/pnas.1716689115 [DOI] [PMC free article] [PubMed] [Google Scholar]
- Diedenhofen B, Musch J. 2015. cocor: a comprehensive solution for the statistical comparison of correlations. PLoS One 10: e0121945 10.1371/journal.pone.0121945 [DOI] [PMC free article] [PubMed] [Google Scholar]
- Ding Y, Tang Y, Kwok CK, Zhang Y, Bevilacqua PC, Assmann SM. 2014. In vivo genome-wide profiling of RNA secondary structure reveals novel regulatory features. Nature 505: 696–700. 10.1038/nature12756 [DOI] [PubMed] [Google Scholar]
- Ding Y, Kwok CK, Tang Y, Bevilacqua PC, Assmann SM. 2015. Genome-wide profiling of in vivo RNA structure at single-nucleotide resolution using Structure-seq. Nat Protoc 10: 1050–1066. 10.1038/nprot.2015.064 [DOI] [PubMed] [Google Scholar]
- Dinneny JR, Long TA, Wang JY, Jung JW, Mace D, Pointer S, Barron C, Brady SM, Schiefelbein J, Benfey PN. 2008. Cell identity mediates the response of Arabidopsis roots to abiotic stress. Science 320: 942–945. 10.1126/science.1153795 [DOI] [PubMed] [Google Scholar]
- Feng J, Li J, Gao Z, Lu Y, Yu J, Zheng Q, Yan S, Zhang W, He H, Ma L, et al. 2015. Skip confers osmotic tolerance during salt stress by controlling alternative gene splicing in Arabidopsis. Mol Plant 8: 1038–1052. 10.1016/j.molp.2015.01.011 [DOI] [PubMed] [Google Scholar]
- Feng W, Kita D, Peaucelle A, Cartwright HN, Doan V, Duan Q, Liu MC, Maman J, Steinhorst L, Schmitz-Thom I, et al. 2018. The FERONIA receptor kinase maintains cell-wall integrity during salt stress through Ca2+ signaling. Curr Biol 28: 666–675.e5. 10.1016/j.cub.2018.01.023 [DOI] [PMC free article] [PubMed] [Google Scholar]
- Floris M, Mahgoub H, Lanet E, Robaglia C, Menand B. 2009. Post-transcriptional regulation of gene expression in plants during abiotic stress. Int J Mol Sci 10: 3168–3185. 10.3390/ijms10073168 [DOI] [PMC free article] [PubMed] [Google Scholar]
- Gu J, Xia Z, Luo Y, Jiang X, Qian B, Xie H, Zhu JK, Xiong L, Zhu J, Wang ZY. 2018. Spliceosomal protein U1A is involved in alternative splicing and salt stress tolerance in Arabidopsis thaliana. Nucleic Acids Res 46: 1777–1792. 10.1093/nar/gkx1229 [DOI] [PMC free article] [PubMed] [Google Scholar]
- Harigaya Y, Parker R. 2016. Analysis of the association between codon optimality and mRNA stability in Schizosaccharomyces pombe. BMC Genomics 17: 895 10.1186/s12864-016-3237-6 [DOI] [PMC free article] [PubMed] [Google Scholar]
- Haruta M, Sabat G, Stecker K, Minkoff BB, Sussman MR. 2014. A peptide hormone and its receptor protein kinase regulate plant cell expansion. Science 343: 408–411. 10.1126/science.1244454 [DOI] [PMC free article] [PubMed] [Google Scholar]
- Heilman-Miller SL, Thirumalai D, Woodson SA. 2001. Role of counterion condensation in folding of the Tetrahymena ribozyme. I. Equilibrium stabilization by cations. J Mol Biol 306: 1157–1166. 10.1006/jmbi.2001.4437 [DOI] [PubMed] [Google Scholar]
- Hull CM, Anmangandla A, Bevilacqua PC. 2016. Bacterial riboswitches and ribozymes potently activate the human innate immune sensor PKR. ACS Chem Biol 11: 1118–1127. 10.1021/acschembio.6b00081 [DOI] [PMC free article] [PubMed] [Google Scholar]
- Huot B, Yao J, Montgomery BL, He SY. 2014. Growth-defense tradeoffs in plants: a balancing act to optimize fitness. Mol Plant 7: 1267–1287. 10.1093/mp/ssu049 [DOI] [PMC free article] [PubMed] [Google Scholar]
- Isayenkov SV, Maathuis FJM. 2019. Plant salinity stress: many unanswered questions remain. Front Plant Sci 10: 80 10.3389/fpls.2019.00080 [DOI] [PMC free article] [PubMed] [Google Scholar]
- Jiang C, Mithani A, Belfield EJ, Mott R, Hurst LD, Harberd NP. 2014. Environmentally responsive genome-wide accumulation of de novo Arabidopsis thaliana mutations and epimutations. Genome Res 24: 1821–1829. 10.1101/gr.177659.114 [DOI] [PMC free article] [PubMed] [Google Scholar]
- Jiao Y, Riechmann JL, Meyerowitz EM. 2008. Transcriptome-wide analysis of uncapped mRNAs in Arabidopsis reveals regulation of mRNA degradation. Plant Cell 20: 2571–2585. 10.1105/tpc.108.062786 [DOI] [PMC free article] [PubMed] [Google Scholar]
- Kawa D, Testerink C. 2017. Regulation of mRNA decay in plant responses to salt and osmotic stress. Cell Mol Life Sci 74: 1165–1176. 10.1007/s00018-016-2376-x [DOI] [PMC free article] [PubMed] [Google Scholar]
- Kertesz M, Wan Y, Mazor E, Rinn JL, Nutter RC, Chang HY, Segal E. 2010. Genome-wide measurement of RNA secondary structure in yeast. Nature 467: 103–107. 10.1038/nature09322 [DOI] [PMC free article] [PubMed] [Google Scholar]
- Khong A, Parker R. 2018. mRNP architecture in translating and stress conditions reveals an ordered pathway of mRNP compaction. J Cell Biol 217: 4124–4140. 10.1083/jcb.201806183 [DOI] [PMC free article] [PubMed] [Google Scholar]
- Kreps JA, Wu Y, Chang HS, Zhu T, Wang X, Harper JF. 2002. Transcriptome changes for Arabidopsis in response to salt, osmotic, and cold stress. Plant Physiol 130: 2129–2141. 10.1104/pp.008532 [DOI] [PMC free article] [PubMed] [Google Scholar]
- Lambert D, Draper DE. 2007. Effects of osmolytes on RNA secondary and tertiary structure stabilities and RNA-Mg2+ interactions. J Mol Biol 370: 993–1005. 10.1016/j.jmb.2007.03.080 [DOI] [PMC free article] [PubMed] [Google Scholar]
- Langmead B, Salzberg SL. 2012. Fast gapped-read alignment with Bowtie 2. Nat Methods 9: 357–359. 10.1038/nmeth.1923 [DOI] [PMC free article] [PubMed] [Google Scholar]
- Li H, Handsaker B, Wysoker A, Fennell T, Ruan J, Homer N, Marth G, Abecasis G, Durbin R, Genome Project Data Processing Subgroup. 2009. The Sequence Alignment/Map format and SAMtools. Bioinformatics 25: 2078-2079. 10.1093/bioinformatics/btp352 [DOI] [PMC free article] [PubMed] [Google Scholar]
- Li F, Zheng Q, Vandivier LE, Willmann MR, Chen Y, Gregory BD. 2012. Regulatory impact of RNA secondary structure across the Arabidopsis transcriptome. Plant Cell 24: 4346–4359. 10.1105/tpc.112.104232 [DOI] [PMC free article] [PubMed] [Google Scholar]
- Low JT, Weeks KM. 2010. SHAPE-directed RNA secondary structure prediction. Methods 52: 150–158. 10.1016/j.ymeth.2010.06.007 [DOI] [PMC free article] [PubMed] [Google Scholar]
- Manning GS. 1972. On the application of polyelectrolyte “limiting laws” to the helix-coil transition of DNA. II. The effect of Mg++ counterions. Biopolymers 11: 951–955. 10.1002/bip.1972.360110503 [DOI] [PubMed] [Google Scholar]
- Martin M. 2011. Cutadapt removes adapter sequences from high-throughput sequencing reads. EMBnetjournal 17: 10–12. 10.14806/ej.17.1.200 [DOI] [Google Scholar]
- Mishima Y, Tomari Y. 2016. Codon usage and 3′ UTR length determine maternal mRNA stability in zebrafish. Mol Cell 61: 874–885. 10.1016/j.molcel.2016.02.027 [DOI] [PubMed] [Google Scholar]
- Mitchell D III, Renda AJ, Douds CA, Babitzke P, Assmann SM, Bevilacqua PC. 2019. In vivo RNA structural probing of uracil and guanine base-pairing by 1-ethyl-3-(3-dimethylaminopropyl)carbodiimide (EDC). RNA 25: 147–157. 10.1261/rna.067868.118 [DOI] [PMC free article] [PubMed] [Google Scholar]
- Muhlrad D, Decker CJ, Parker R. 1994. Deadenylation of the unstable mRNA encoded by the yeast mfa2 gene leads to decapping followed by 5′→3′ digestion of the transcript. Genes Dev 8: 855–866. 10.1101/gad.8.7.855 [DOI] [PubMed] [Google Scholar]
- Nagarajan VK, Jones CI, Newbury SF, Green PJ. 2013. XRN 5′→3′ exoribonucleases: structure, mechanisms and functions. Biochim Biophys Acta 1829: 590–603. 10.1016/j.bbagrm.2013.03.005 [DOI] [PMC free article] [PubMed] [Google Scholar]
- Narberhaus F, Waldminghaus T, Chowdhury S. 2006. RNA thermometers. FEMS Microbiol Rev 30: 3–16. 10.1111/j.1574-6976.2005.004.x [DOI] [PubMed] [Google Scholar]
- Narsai R, Howell KA, Millar AH, O'Toole N, Small I, Whelan J. 2007. Genome-wide analysis of mRNA decay rates and their determinants in Arabidopsis thaliana. Plant Cell 19: 3418–3436. 10.1105/tpc.107.055046 [DOI] [PMC free article] [PubMed] [Google Scholar]
- Narula A, Ellis J, Taliaferro JM, Rissland OS. 2019. Coding regions affect mRNA stability in human cells. RNA 25: 1751–1764. 10.1261/rna.073239.119 [DOI] [PMC free article] [PubMed] [Google Scholar]
- Parker R, Sheth U. 2007. P bodies and the control of mRNA translation and degradation. Mol Cell 25: 635–646. 10.1016/j.molcel.2007.02.011 [DOI] [PubMed] [Google Scholar]
- Pennisi E. 2018. Development cell by cell. Science 362: 1344–1345. 10.1126/science.362.6421.1344 [DOI] [PubMed] [Google Scholar]
- Qadir M, Quillérou E, Nangia V, Murtaza G, Singh M, Thomas RJ, Drechsel P, Noble AD. 2014. Economics of salt-induced land degradation and restoration. Nat Resour Forum 38: 282–295. 10.1111/1477-8947.12054 [DOI] [Google Scholar]
- Rabani M, Pieper L, Chew GL, Schier AF. 2017. A massively parallel reporter assay of 3′ UTR sequences identifies in vivo rules for mRNA degradation. Mol Cell 68: 1083–1094.e5. 10.1016/j.molcel.2017.11.014 [DOI] [PMC free article] [PubMed] [Google Scholar]
- R Core Team. 2019. R: A language and environment for statistical computing. R Foundation for Statistical Computing, Vienna, Austria. [Google Scholar]
- Rengasamy P. 2006. World salinization with emphasis on Australia. J Exp Bot 57: 1017–1023. 10.1093/jxb/erj108 [DOI] [PubMed] [Google Scholar]
- Reuter JS, Mathews DH. 2010. RNAstructure: software for RNA secondary structure prediction and analysis. BMC Bioinformatics 11: 129 10.1186/1471-2105-11-129 [DOI] [PMC free article] [PubMed] [Google Scholar]
- Ritchey LE, Su Z, Tang Y, Tack DC, Assmann SM, Bevilacqua PC. 2017. Structure-seq2: sensitive and accurate genome-wide profiling of RNA structure in vivo. Nucleic Acids Res 45: e135 10.1093/nar/gkx533 [DOI] [PMC free article] [PubMed] [Google Scholar]
- Ritchey LE, Su Z, Assmann SM, Bevilacqua PC. 2019. In vivo genome-wide RNA structure probing with Structure-seq. Methods Mol Biol 1933: 305–341. 10.1007/978-1-4939-9045-0_20 [DOI] [PubMed] [Google Scholar]
- Rouskin S, Zubradt M, Washietl S, Kellis M, Weissman JS. 2014. Genome-wide probing of RNA structure reveals active unfolding of mRNA structures in vivo. Nature 505: 701–705. 10.1038/nature12894 [DOI] [PMC free article] [PubMed] [Google Scholar]
- Roy SJ, Negrão S, Tester M. 2014. Salt resistant crop plants. Curr Opin Biotechnol 26: 115–124. 10.1016/j.copbio.2013.12.004 [DOI] [PubMed] [Google Scholar]
- Song L, Huang SC, Wise A, Castanon R, Nery JR, Chen H, Watanabe M, Thomas J, Bar-Joseph Z, Ecker JR. 2016. A transcription factor hierarchy defines an environmental stress response network. Science 354: aag1550 10.1126/science.aag1550 [DOI] [PMC free article] [PubMed] [Google Scholar]
- Sorenson RS, Deshotel MJ, Johnson K, Adler FR, Sieburth LE. 2018. Arabidopsis mRNA decay landscape arises from specialized RNA decay substrates, decapping-mediated feedback, and redundancy. Proc Natl Acad Sci 115: E1485–E1494. 10.1073/pnas.1712312115 [DOI] [PMC free article] [PubMed] [Google Scholar]
- Srivastava AK, Lu Y, Zinta G, Lang Z, Zhu JK. 2018. UTR-dependent control of gene expression in plants. Trends Plant Sci 23: 248–259. 10.1016/j.tplants.2017.11.003 [DOI] [PMC free article] [PubMed] [Google Scholar]
- Stepien P, Johnson GN. 2009. Contrasting responses of photosynthesis to salt stress in the glycophyte Arabidopsis and the halophyte thellungiella: role of the plastid terminal oxidase as an alternative electron sink. Plant Physiol 149: 1154–1165. 10.1104/pp.108.132407 [DOI] [PMC free article] [PubMed] [Google Scholar]
- Su Z, Tang Y, Ritchey LE, Tack DC, Zhu M, Bevilacqua PC, Assmann SM. 2018. Genome-wide RNA structurome reprogramming by acute heat shock globally regulates mRNA abundance. Proc Natl Acad Sci 115: 12170–12175. 10.1073/pnas.1807988115 [DOI] [PMC free article] [PubMed] [Google Scholar]
- Sun W, Xu X, Zhu H, Liu A, Liu L, Li J, Hua X. 2010. Comparative transcriptomic profiling of a salt-tolerant wild tomato species and a salt-sensitive tomato cultivar. Plant Cell Physiol 51: 997–1006. 10.1093/pcp/pcq056 [DOI] [PubMed] [Google Scholar]
- Sun Y, Kong X, Li C, Liu Y, Ding Z. 2015. Potassium retention under salt stress is associated with natural variation in salinity tolerance among Arabidopsis accessions. PLoS One 10: e0124032 10.1371/journal.pone.0124032 [DOI] [PMC free article] [PubMed] [Google Scholar]
- Tack DC, Tang Y, Ritchey LE, Assmann SM, Bevilacqua PC. 2018. StructureFold2: bringing chemical probing data into the computational fold of RNA structural analysis. Methods 143: 12–15. 10.1016/j.ymeth.2018.01.018 [DOI] [PubMed] [Google Scholar]
- Takahashi S, Murata N. 2008. How do environmental stresses accelerate photoinhibition? Trends Plant Sci 13: 178–182. 10.1016/j.tplants.2008.01.005 [DOI] [PubMed] [Google Scholar]
- Talkish J, May G, Lin Y, Woolford JL Jr, McManus CJ. 2014. Mod-seq: high-throughput sequencing for chemical probing of RNA structure. RNA 20: 713–720. 10.1261/rna.042218.113 [DOI] [PMC free article] [PubMed] [Google Scholar]
- Tang Y, Bouvier E, Kwok CK, Ding Y, Nekrutenko A, Bevilacqua PC, Assmann SM. 2015. StructureFold: genome-wide RNA secondary structure mapping and reconstruction in vivo. Bioinformatics 31: 2668–2675. 10.1093/bioinformatics/btv213 [DOI] [PMC free article] [PubMed] [Google Scholar]
- Tester M, Davenport R. 2003. Na+ tolerance and Na+ transport in higher plants. Ann Bot 91: 503–527. 10.1093/aob/mcg058 [DOI] [PMC free article] [PubMed] [Google Scholar]
- Tian T, Liu Y, Yan H, You Q, Yi X, Du Z, Xu W, Su Z. 2017. agriGO v2.0: a GO analysis toolkit for the agricultural community, 2017 update. Nucleic Acids Res 45: W122–W129. 10.1093/nar/gkx382 [DOI] [PMC free article] [PubMed] [Google Scholar]
- Tijerina P, Mohr S, Russell R. 2007. DMS footprinting of structured RNAs and RNA-protein complexes. Nat Protoc 2: 2608–2623. 10.1038/nprot.2007.380 [DOI] [PMC free article] [PubMed] [Google Scholar]
- Vashisht AA, Tuteja N. 2006. Stress responsive dead-box helicases: a new pathway to engineer plant stress tolerance. J Photochem Photobiol B 84: 150–160. 10.1016/j.jphotobiol.2006.02.010 [DOI] [PubMed] [Google Scholar]
- Vicens Q, Kieft JS, Rissland OS. 2018. Revisiting the closed-loop model and the nature of mRNA 5′–3′ communication. Mol Cell 72: 805–812. 10.1016/j.molcel.2018.10.047 [DOI] [PMC free article] [PubMed] [Google Scholar]
- Vu DT, Yamada T, Ishidaira H. 2018. Assessing the impact of sea level rise due to climate change on seawater intrusion in Mekong Delta, Vietnam. Water Sci Technol 77: 1632–1639. 10.2166/wst.2018.038 [DOI] [PubMed] [Google Scholar]
- Waldron JA, Tack DC, Ritchey LE, Gillen SL, Wilczynska A, Turro E, Bevilacqua PC, Assmann SM, Bushell M, Le Quesne J. 2019. mRNA structural elements immediately upstream of the start codon dictate dependence upon eIF4A1 helicase activity. Genome Biol 20: 300 10.1186/s13059-019-1901-2 [DOI] [PMC free article] [PubMed] [Google Scholar]
- Walley JW, Dehesh K. 2010. Molecular mechanisms regulating rapid stress signaling networks in Arabidopsis. J Integr Plant Biol 52: 354–359. 10.1111/j.1744-7909.2010.00940.x [DOI] [PubMed] [Google Scholar]
- Wan Y, Qu K, Ouyang Z, Kertesz M, Li J, Tibshirani R, Makino DL, Nutter RC, Segal E, Chang HY. 2012. Genome-wide measurement of RNA folding energies. Mol Cell 48: 169–181. 10.1016/j.molcel.2012.08.008 [DOI] [PMC free article] [PubMed] [Google Scholar]
- Wan Y, Qu K, Zhang QC, Flynn RA, Manor O, Ouyang Z, Zhang J, Spitale RC, Snyder MP, Segal E, et al. 2014. Landscape and variation of RNA secondary structure across the human transcriptome. Nature 505: 706–709. 10.1038/nature12946 [DOI] [PMC free article] [PubMed] [Google Scholar]
- Wang J, Zhu J, Zhang Y, Fan F, Li W, Wang F, Zhong W, Wang C, Yang J. 2018. Comparative transcriptome analysis reveals molecular response to salinity stress of salt-tolerant and sensitive genotypes of indica rice at seedling stage. Sci Rep 8: 2085 10.1038/s41598-018-19984-w [DOI] [PMC free article] [PubMed] [Google Scholar]
- Wang PY, Sexton AN, Culligan WJ, Simon MD. 2019. Carbodiimide reagents for the chemical probing of RNA structure in cells. RNA 25: 135–146. 10.1261/rna.067561.118 [DOI] [PMC free article] [PubMed] [Google Scholar]
- Washburn JD, Mejia-Guerra MK, Ramstein G, Kremling KA, Valluru R, Buckler ES, Wang H. 2019. Evolutionarily informed deep learning methods for predicting transcript abundance from DNA sequence. PNAS 116: 5524–5549. 10.1073/pnas.1814551116 [DOI] [PMC free article] [PubMed] [Google Scholar]
- Watters KE, Strobel EJ, Yu AM, Lis JT, Lucks JB. 2016. Cotranscriptional folding of a riboswitch at nucleotide resolution. Nat Struct Mol Biol 23: 1124–1131. 10.1038/nsmb.3316 [DOI] [PMC free article] [PubMed] [Google Scholar]
- Wickham H. 2011. The split-apply-combine strategy for data analysis. J Stat Softw 40 10.18637/jss.v040.i01 [DOI] [Google Scholar]
- Wickham H. 2016. Ggplot2: elegant graphics for data analysis. Springer-Verlag, New York. [Google Scholar]
- Wong MM, Chong GL, Verslues PE. 2017. Epigenetics and RNA processing: connections to drought, salt, and ABA? Methods Mol Biol 1631: 3–21. 10.1007/978-1-4939-7136-7_1 [DOI] [PubMed] [Google Scholar]
- Yamashita A, Chang TC, Yamashita Y, Zhu W, Zhong Z, Chen CY, Shyu AB. 2005. Concerted action of poly(a) nucleases and decapping enzyme in mammalian mRNA turnover. Nat Struct Mol Biol 12: 1054–1063. 10.1038/nsmb1016 [DOI] [PubMed] [Google Scholar]
- Yu Y, Assmann SM. 2015. The heterotrimeric G-protein β subunit, AGB1, plays multiple roles in the Arabidopsis salinity response. Plant Cell Environ 38: 2143–2156. 10.1111/pce.12542 [DOI] [PubMed] [Google Scholar]
- Yu Y, Assmann SM. 2018. Inter-relationships between the heterotrimeric Gβ subunit AGB1, the receptor-like kinase FERONIA, and RALF1 in salinity response. Plant Cell Environ 41: 2475–2489. 10.1111/pce.13370 [DOI] [PMC free article] [PubMed] [Google Scholar]
- Zaug AJ, Cech TR. 1995. Analysis of the structure of Tetrahymena nuclear RNAs in vivo: telomerase RNA, the self-splicing rRNA intron, and U2 snRNA. RNA 1: 363–374. [PMC free article] [PubMed] [Google Scholar]
- Zhang M, Kong X, Xu X, Li C, Tian H, Ding Z. 2015. Comparative transcriptome profiling of the maize primary, crown and seminal root in response to salinity stress. PLoS One 10: e0121222 10.1371/journal.pone.0121222 [DOI] [PMC free article] [PubMed] [Google Scholar]
- Zhang Y, Burkhardt DH, Rouskin S, Li GW, Weissman JS, Gross CA. 2018. A stress response that monitors and regulates mRNA structure is central to cold shock adaptation. Mol Cell 70: 274–286 e277. 10.1016/j.molcel.2018.02.035 [DOI] [PMC free article] [PubMed] [Google Scholar]
- Zhu JK. 2002. Salt and drought stress signal transduction in plants. Annu Rev Plant Biol 53: 247–273. 10.1146/annurev.arplant.53.091401.143329 [DOI] [PMC free article] [PubMed] [Google Scholar]
- Zhu G, Li W, Zhang F, Guo W. 2018. RNA-seq analysis reveals alternative splicing under salt stress in cotton, Gossypium davidsonii. BMC Genomics 19: 73 10.1186/s12864-018-4449-8 [DOI] [PMC free article] [PubMed] [Google Scholar]
Associated Data
This section collects any data citations, data availability statements, or supplementary materials included in this article.
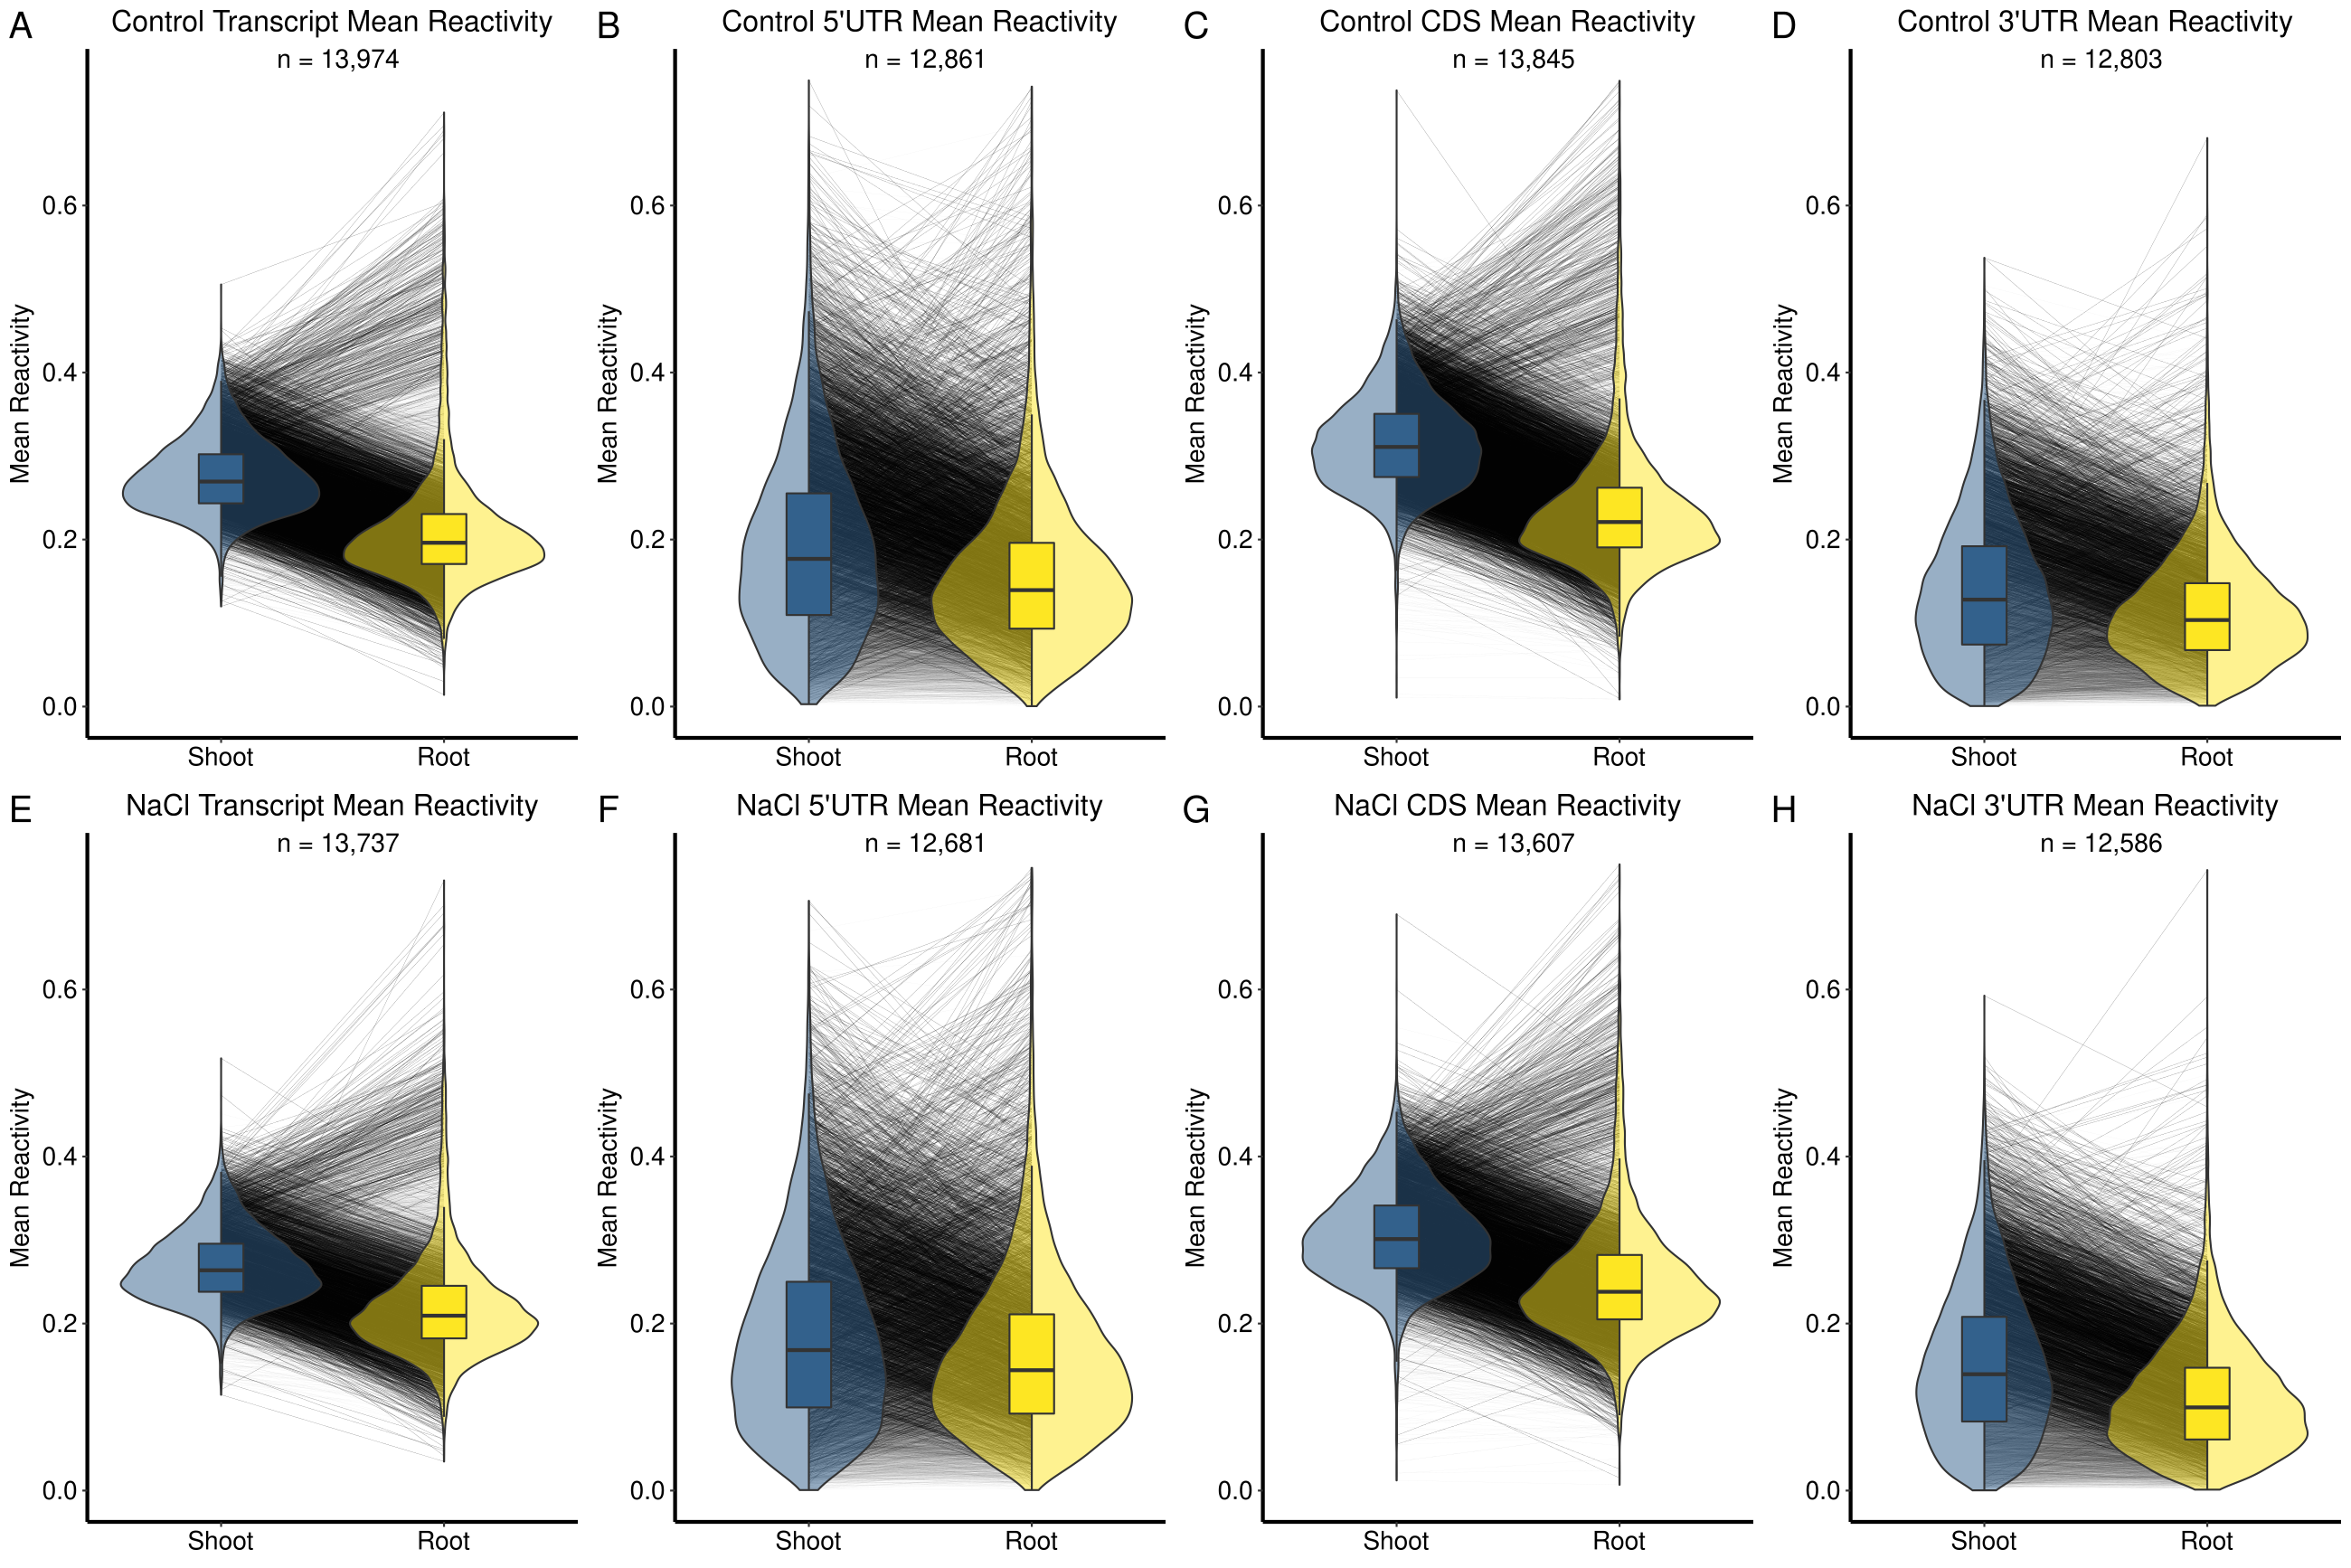